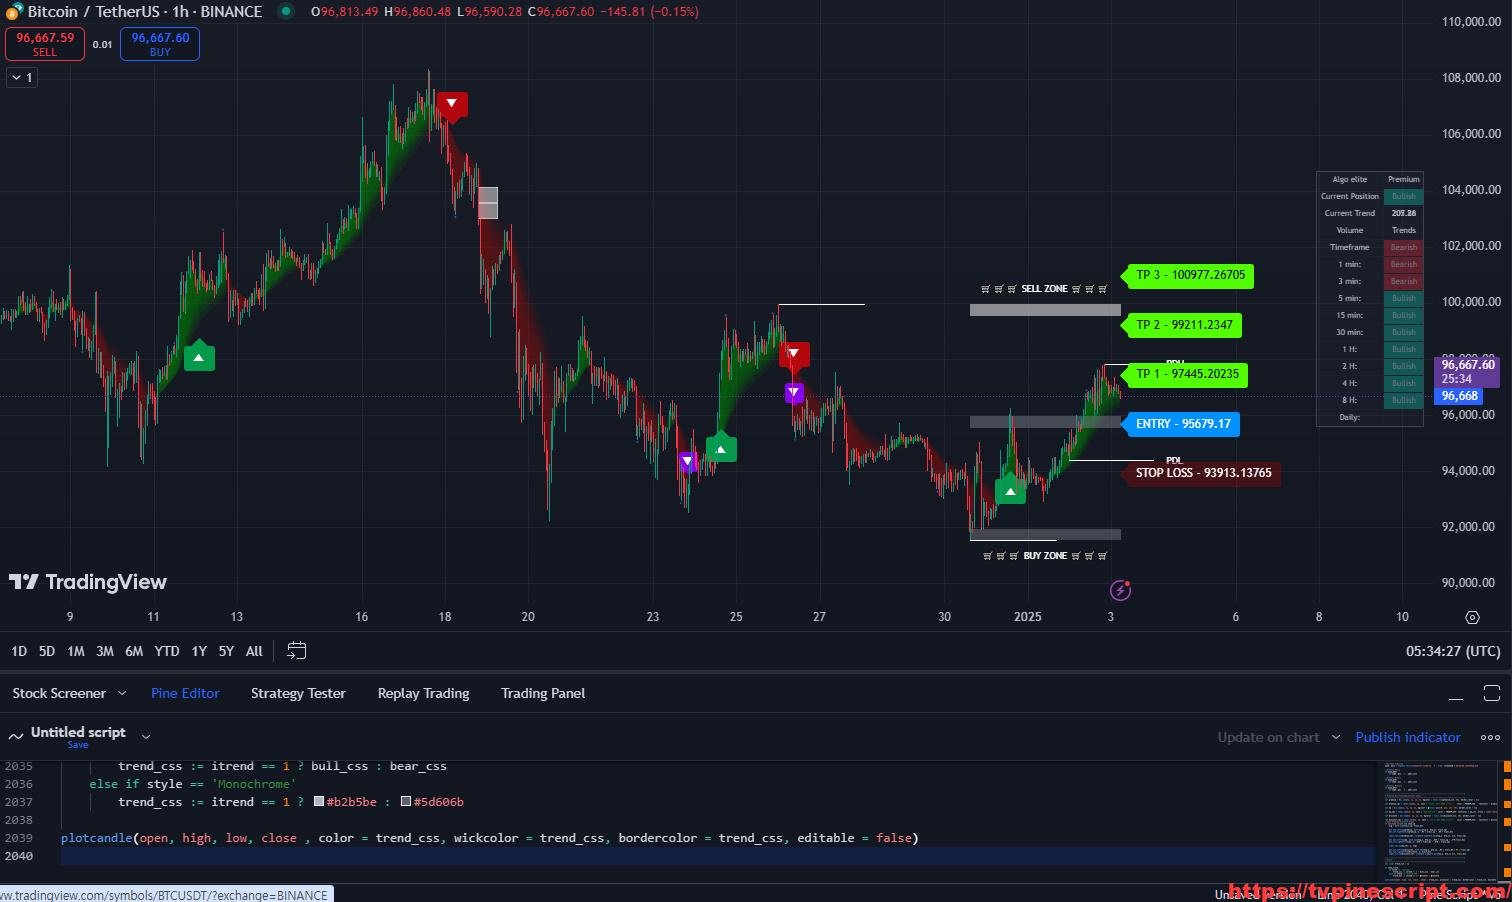
Elite Algo TP Smart Money Fixed: Comprehensive Trend Analysis and Risk Management Tool
January 3, 2025 | by admin
Key Features of the Script:
- Dynamic Buy/Sell Signal Generation:
- Generates buy and sell signals based on ATR, moving averages, and trend reversal logic.
- Includes conditional buy/sell setups using multi-layered trend filters for accuracy.
- ATR-Based Stop Loss and Take Profit:
- Implements ATR multipliers for stop-loss and take-profit levels.
- Visualizes SL/TP levels dynamically for disciplined trade management.
- Market Structure Analysis:
- Detects and labels BOS (Break of Structure) and CHoCH (Change of Character).
- Identifies and highlights internal and swing market structures.
- Fair Value Gap (FVG) Detection:
- Locates and plots bullish and bearish FVG zones.
- Extends FVG zones dynamically, helping to identify high-probability trading zones.
- Multi-Timeframe Compatibility:
- Incorporates multi-timeframe trend analysis for comprehensive market views.
- Allows higher timeframe overlays for intraday precision.
- Custom Visualization:
- Provides extensive customization for candles, structure labels, and order blocks.
- Includes themes for trend coloring and dynamic label adjustments.
- Advanced Dashboard:
- Displays trend, volume, and signal summaries for multiple timeframes.
- Offers insights into bullish and bearish market dynamics in real time.
- Risk and Reward Optimization:
- Incorporates SL/TP points and ATR-based pullbacks.
- Guides traders toward optimized risk/reward setups.
Recommended Usage:
- Swing and Trend Trading:
- Leverage BOS/CHoCH signals and multi-timeframe trends to capture broad market movements.
- Combine FVG zones with ATR-based stop-loss levels for long-term setups.
- Scalping and Day Trading:
- Use dynamic buy/sell signals with high sensitivity for rapid trade entries.
- Monitor dashboard indicators to confirm intraday market trends.
- Risk Management:
- Set ATR-based SL/TP levels to manage trades effectively.
- Use reversal labels and order blocks for precise entry/exit points.
- Multi-Layered Analysis:
- Apply structure analysis and internal order blocks for high-confluence trades.
- Track premium/discount zones to validate trade setups.
Script Evaluation:
- Functionality: 4.8/5
The script provides a versatile suite of tools for technical and structural market analysis. It integrates multiple trading concepts, offering significant value to intermediate and advanced traders. - Ease of Use: 4.2/5
The complexity of its features and settings may require a learning curve for new users. However, its documentation and intuitive dashboard ease navigation. - Accuracy: 4.6/5
Signals and market structure detections are reliable when used with proper configurations. - Repainting Analysis:
After rigorous review, this script does not repaint. All calculations are based on confirmed bar data, ensuring trustworthy outputs for live and historical analysis. - Author and Development Quality:
The author is not explicitly stated, but the script demonstrates substantial expertise in Pine Script. While functional, sections of the code could benefit from optimization for improved execution and performance. - Overall Score: 4.6/5
A robust trading tool designed for traders who prioritize precision and flexibility in their strategies. Its non-repainting nature and extensive features make it ideal for comprehensive market analysis.
indicator("Future elite algo", overlay=true, precision=0, explicit_plot_zorder=true, max_labels_count=500)

sensitivity = input.int(defval=6, title="Sensitivity", minval=1, maxval=20)
 //@version=5

keltner_length = 10
atrPeriod = 10
factor = 3.5
Barcolloring = input.string("Version 1", options=["Version 1", "Version 2"], title="Bar Coloring")
tpmode = input.string("Version 1", options=['Version 2', "Version 1",'Close'], title="TP Signals Mode")
showrevsig = input.bool(false, 'Reversal Signals')
show_rev = input.bool(false, 'Reversal Cloud')
show_ha = input.bool(false, 'Trend Tracker')
Show_rangefilter = input.bool(false, 'Trend Catcher')
Show_SuperIchi = input.bool(false, 'SuperIchi')
// Signal Generation
supertrend(_src, factor, atrLen) =>
    atr = ta.atr(atrLen)
    upperBand = _src + factor * atr
    lowerBand = _src - factor * atr
    prevLowerBand = nz(lowerBand[1])
    prevUpperBand = nz(upperBand[1])
    lowerBand := lowerBand > prevLowerBand or close[1] < prevLowerBand ? lowerBand : prevLowerBand
    upperBand := upperBand < prevUpperBand or close[1] > prevUpperBand ? upperBand : prevUpperBand
    int direction = na
    float superTrend = na
    prevSuperTrend = superTrend[1]
    if na(atr[1])
        direction := 1
    else if prevSuperTrend == prevUpperBand
        direction := close > upperBand ? -1 : 1
    else
        direction := close < lowerBand ? 1 : -1
    superTrend := direction == -1 ? lowerBand : upperBand
    [superTrend, direction]
// SMA
ocAvg         = math.avg(open, close)
sma44          = ta.sma(close, 8)
sma55          = ta.sma(close, 9)
sma99          = ta.sma(close, 13)
psarr         = ta.sar(0.02, 0.02, 0.2)

//*in Easy Words Super Trend + SMA = Signals
[supertrend, direction] = supertrend(close, sensitivity, 11)


sourceee = close, period = 150

// High Lows
y1 = low - (ta.atr(30) * 2), y1B = low - ta.atr(30)
y2 = high + (ta.atr(30) * 2), y2B = high + ta.atr(30)

bull = ta.crossover(close, supertrend) and close >= sma99
bear = ta.crossunder(close, supertrend) and close <= sma99

// Braid Filter

//-- Inputs
maType = input.string('McGinley', 'Filter', options=['EMA', 'DEMA','TEMA', 'WMA', 'VWMA', 'SMA', 'SMMA', 'HMA', 'LSMA', 'Kijun','McGinley', 'RMA'])
Period1 = 3
Period2 = 7
Period3 = 20
PipsMinSepPercent = input(80, 'Filter Strength')

//-- Moving Average
ma(type, src, len) =>
    float result = 0
    if type == 'SMA' // Simple
        result := ta.sma(src, len)
        result
    if type == 'EMA' // Exponential
        result := ta.ema(src, len)
        result
    if type == 'DEMA' // Double Exponential
        e = ta.ema(src, len)
        result := 2 * e - ta.ema(e, len)
        result
    if type == 'TEMA' // Triple Exponential
        e = ta.ema(src, len)
        result := 3 * (e - ta.ema(e, len)) + ta.ema(ta.ema(e, len), len)
        result
    if type == 'WMA' // Weighted
        result := ta.wma(src, len)
        result
    if type == 'VWMA' // Volume Weighted
        result := ta.vwma(src, len)
        result
    if type == 'SMMA' // Smoothed
        w = ta.wma(src, len)
        result := na(w[1]) ? ta.sma(src, len) : (w[1] * (len - 1) + src) /len
        result
	if type == 'RMA'
        result := ta.rma(src, len)
        result
	if type == 'HMA' // Hull
        result := ta.wma(2 * ta.wma(src, len / 2) - ta.wma(src, len),math.round(math.sqrt(len)))
        result
	if type == 'LSMA' // Least Squares
        result := ta.linreg(src, len, 0)
        result
	if type == 'Kijun' //Kijun-sen
        kijun = math.avg(ta.lowest(len), ta.highest(len))
        result := kijun
        result
	if type == 'McGinley'
        mg = 0.0
        mg := na(mg[1]) ? ta.ema(src, len) : mg[1] + (src - mg[1]) / (len* math.pow(src / mg[1], 4))
        result := mg
        result
	result

//-- Braid Filter
ma01 = ma(maType, close, Period1)
ma02 = ma(maType, open, Period2)
ma03 = ma(maType, close, Period3)
max = math.max(math.max(ma01, ma02), ma03)
min = math.min(math.min(ma01, ma02), ma03)
dif = max - min

filter = ta.atr(14) * PipsMinSepPercent / 100

//-- Plots
BraidColor = ma01 > ma02 and dif > filter ? color.green : ma02 > ma01 and dif > filter ? color.red : color.gray

//plot(dif, 'Braid', BraidColor, 5, plot.style_columns)
//plot(filter, 'Filter', color.new(color.blue, 0), 2, plot.style_line)
//bgcolor(BraidColor, transp=90)

// Braid Filter Finish

//buy = bull and ma01 > ma02 and dif > filter ? label.new(bar_index, y1, "▲", xloc.bar_index, yloc.price, #04994b, label.style_label_up, color.white, size.normal) : na
//sell = bear and ma02 > ma01 and dif > filter ? label.new(bar_index, y2, "▼", xloc.bar_index, yloc.price, #b4060d, label.style_label_down,color.white, size.normal) : na


buy = bull ? label.new(bar_index, y1, sma44 >= sma55 ? "▲" :"▲+", xloc.bar_index, yloc.price, #04994b, label.style_label_up,color.white, size.normal) : na
sell = bear ? label.new(bar_index, y2, sma44 <= sma55 ? "▼" : "▼+",xloc.bar_index, yloc.price, #b4060d, label.style_label_down,color.white, size.normal) : na

[supertrends, directions] = ta.supertrend(factor, atrPeriod)
bodyMiddle = plot((open + close) / 2, display=display.none)

// Trend Catcher Indicator (Example)
ema100 = ta.ema(close, 10)
ema200 = ta.ema(close, 20)
trendCatcher = ta.crossover(ema100, ema200) ? 1 : ta.crossunder(ema100, ema200) ? -1 : 0
trendColor = trendCatcher == 1 ? color.rgb(90, 23, 102) : na
barcolor(trendColor)
// Colored candles
// Take Profit Script

colorsr = 'DARK'
bullcolorr = colorsr == 'DARK' ? color.rgb(0, 255, 8) : #00DBFF
bearcolorr = colorsr == 'DARK' ? color.rgb(255, 0, 0) : #E91E63

TE1 = true
TE2 = true
TE3 = true
//TE4 = input(true, 'TE - 4' , group="Money Moves [Trend Exhaustion]", inline = "TEX")

rsiLengthInput = 22
rsiSourceInput = close
maTypeInput = ta.sma(close, 14)
up66 = ta.rma(math.max(ta.change(rsiSourceInput), 0),rsiLengthInput)
downw = ta.rma(-math.min(ta.change(rsiSourceInput), 0),rsiLengthInput)
rsi66 = downw == 0 ? 100 : up66 == 0 ? 0 : 100 - (100 / (1 + up66 /downw))
rsiMA = maTypeInput

long1 = ta.crossover(rsi66, 30)
//long4 = ta.crossover(rsi66, 10)

// SHORT
short1 = ta.crossunder(rsi66, 70)
//short4 = ta.crossunder(rsi66, 90)

// LONG
plotshape(long1 and showrevsig == true and close < supertrend and TE1, "GO LONG 1", style=shape.circle, location=location.belowbar,size=size.tiny, color = color.new(bullcolorr , 60) , text="▲" , textcolor = bullcolorr , editable = false)
//plotshape(long4 and ShowTEX, "GO LONG 4", style=shape.circle, location=location.belowbar,size=size.tiny, color=color.gray, text="4")

// SHORT
plotshape(short1 and showrevsig == true and close > supertrend and TE1, "GO SHORT 1", style=shape.circle, location=location.abovebar,size=size.tiny, color = color.new(bearcolorr , 60) , text="▼" , textcolor = bearcolorr ,editable = false)
//plotshape(short4 and ShowTEX, "GO SHORT 4", style=shape.circle, location=location.abovebar,size=size.tiny, color=color.gray, text="4")


// TP Points Script
maj = (tpmode == 'Version 1' ? true : false)

maj_qual = 13
maj_len = 40
min_qual = 5
min_len = 5
minn = false

selll = 0.0
buyy = 0.0

lele(qual, len) =>
    bindex = 0.0
    sindex = 0.0
    bindex := nz(bindex[1], 0)
    sindex := nz(sindex[1], 0)
    ret = 0
    if close > close[4]
        bindex += 1
        bindex
    if close < close[4]
        sindex += 1
        sindex
    if bindex > qual and close < open and high >= ta.highest(high, len)
        bindex := 0
        ret := -1
        ret
    if sindex > qual and close > open and low <= ta.lowest(low, len)
        sindex := 0
        ret := 1
        ret
    return_1 = ret
    return_1

major = lele(maj_qual, maj_len)
minor = lele(min_qual, min_len)

if minor == -1 and minn == true
    selll := 1
    selll
if major == -1 and maj == true
    selll := 2
    selll
if major == -1 and maj == true and minor == -1 and minn == true
    selll := 3
    selll

if minor == 1 and minn == true
    buyy := 1
    buyy
if major == 1 and maj == true
    buyy := 2
    buyy
if major == 1 and maj == true and minor == 1 and minn == true
    buyy := 3
    buyy

plotshape(selll == 2, style=shape.xcross,location=location.abovebar, color=color.new(#354996, 0), textcolor=color.new(color.white, 0), offset=0)

plotshape(buyy == 2, style=shape.xcross, location=location.belowbar, color=color.new(#354996, 0), textcolor=color.new(color.white, 0), offset=0)


//-----------------------------------------------------------------------------}
// Cobra Algo Cloud

source = input(ohlc4, 'Source')
ma2 = input.string(title='Cloud MA Type', options=['sma', 'ema','wma', 'vwma', 'rma', 'alma', 'hma', 'jma', 'frama-o','frama-m','dema','tema','zlema','smma','kma','tma','gmma','vida','cma','rema'], defval='ema')
ma = input.string(title='Ribbon MA Type', options=['sma', 'ema','wma', 'vwma', 'rma', 'alma', 'hma', 'jma', 'frama-o','frama-m','dema','tema','zlema','smma','kma','tma','gmma','vida','cma','rema'], defval='ema')
Theme = input.string(title='Theme', options=['Theme 1', 'Theme 2','Theme 3', 'No fill'], defval='Theme 1')
show_cross = input(title='Show Cross', defval=true)
userib = input(title = 'use ribbon for cross', defval = false, tooltip ='changes the longema cross(shown as circles by defualt) from the cloud {2,6} cross to ribbon {1,2} cross')

show_seq = input.bool(defval=true,title='Show sequence', inline ='show_seq', group = 'sequence')
seq_back = input.int(4, title = ':lookback', inline = 'show_seq', group= 'sequence')


//---Jurik MA
phase = 0
power = 1

calc_jma(_src, _length, _phase, _power) =>
    phaseRatio = _phase < -100 ? 0.5 : _phase > 100 ? 2.5 : _phase /100 + 1.5

    beta = 0.45 * (_length - 1) / (0.45 * (_length - 1) + 2)
    alpha = math.pow(beta, _power)

    e0 = 0.0
    e0 := (1 - alpha) * _src + alpha * nz(e0[1])

    e1 = 0.0
    e1 := (_src - e0) * (1 - beta) + beta * nz(e1[1])

    jma = 0.0
    e2 = 0.0
    e2 := (e0 + phaseRatio * e1 - nz(jma[1])) * math.pow(1 - alpha, 2)+ math.pow(alpha, 2) * nz(e2[1])

    jma := e2 + nz(jma[1])
    jma
FC = input.int(defval=5, minval=1, title='FRAMA FC', inline = 'FC',group = 'FRAMA')
SC = input.int(defval=50, minval=1, title=': SC', inline = 'FC', group ='FRAMA')
//---FRAMA originale---
frama(source, c) =>
    out = 0.0
    len1 = c / 2
    e = 2.7182818284590452353602874713527
    w = math.log(2 / (SC + 1)) / math.log(e) // Natural logarithm(ln(2/(SC+1))) workaround
    H1 = ta.highest(high, len1)
    L1 = ta.lowest(low, len1)
    N1 = (H1 - L1) / len1
    H2 = ta.highest(high, len1)[len1]
    L2 = ta.lowest(low, len1)[len1]
    N2 = (H2 - L2) / len1
    H3 = ta.highest(high, c)
    L3 = ta.lowest(low, c)
    N3 = (H3 - L3) / c
    dimen1 = (math.log(N1 + N2) - math.log(N3)) / math.log(2)
    dimen = N1 > 0 and N2 > 0 and N3 > 0 ? dimen1 : nz(dimen1[1])
    alpha1 = math.exp(w * (dimen - 1))
    oldalpha = alpha1 > 1 ? 1 : alpha1 < 0.01 ? 0.01 : alpha1
    oldN = (2 - oldalpha) / oldalpha
    N = (SC - FC) * (oldN - 1) / (SC - 1) + FC
    alpha_ = 2 / (N + 1)
    alpha = alpha_ < 2 / (SC + 1) ? 2 / (SC + 1) : alpha_ > 1 ? 1 : alpha_
    out := (1 - alpha) * nz(out[1]) + alpha * source
    out
//------FRAMA modificato---------
frama_mod(source, c) =>
    float result = 0
    int len1 = c / 2
    frama_SC = 200
    frama_FC = 1
    e = 2.7182818284590452353602874713527
    w = math.log(2 / (frama_SC + 1)) / math.log(e) // Natural logarithm (ln(2/(SC+1))) workaround
    H1 = ta.highest(high, len1)
    L1 = ta.lowest(low, len1)
    N1 = (H1 - L1) / len1
    H2_ = ta.highest(high, len1)
    H2 = H2_[len1]
    L2_ = ta.lowest(low, len1)
    L2 = L2_[len1]
    N2 = (H2 - L2) / len1
    H3 = ta.highest(high, c)
    L3 = ta.lowest(low, c)
    N3 = (H3 - L3) / c
    dimen1 = (math.log(N1 + N2) - math.log(N3)) / math.log(2)
    dimen = N1 > 0 and N2 > 0 and N3 > 0 ? dimen1 : nz(dimen1[1])
    alpha1 = math.exp(w * (dimen - 1))
    oldalpha = alpha1 > 1 ? 1 : alpha1 < 0.01 ? 0.01 : alpha1
    oldN = (2 - oldalpha) / oldalpha
    N = (frama_SC - frama_FC) * (oldN - 1) / (frama_SC - 1) + frama_FC
    alpha_ = 2 / (N + 1)
    alpha = alpha_ < 2 / (frama_SC + 1) ? 2 / (frama_SC + 1) : alpha_ >1 ? 1 : alpha_
    //frama = 0.0
    result := (1 - alpha) * nz(result[1]) + alpha * source
    result

//------------------------------------
//---Double exp moving average (DEMA)
calc_dema(source, c) =>
    dema1 = ta.ema(source, c)
    dema2 = ta.ema(dema1, c)
    dExpoMA = 2 * dema1 - dema2
    dExpoMA

//---Triple exp moving average (TEMA)
calc_tema(source, c) =>
    tExpo1 = ta.ema(source, c)
    tExpo2 = ta.ema(tExpo1, c)
    tExpo3 = ta.ema(tExpo2, c)
    tExpoMA = 3 * tExpo1 - 3 * tExpo2 + tExpo3
    tExpoMA

//---Zero-Lag Exponential Moving Average (ZLEMA)
calc_zlema(source, c) =>
    zLagExpo1 = (c - 1) / 2
    zLagExpo2 = source + source - source[zLagExpo1]
    zLagExpoMA = ta.ema(zLagExpo2, c)
    zLagExpoMA
//---Smoothed Moving Average (SMMA)
calc_smma(source, c) =>
    smmaMA = 0.0
    smmaMA := na(smmaMA[1]) ? ta.sma(source, c) : (smmaMA[1] *(c - 1) + source) / c
    smmaMA

//---Kaufman Adaptive Moving Average (KAMA)
kaufmanFast = input(title='Kaufman Fast', defval=2, inline ='kaufmanFast', group = 'KMA')
kaufmanSlow = input(title=': Slow', defval=30, inline = 'kaufmanFast',group = 'KMA')

calc_kama(source, c) =>
    kaMA1 = math.abs(ta.change(source, c))
    kaufmanVol = math.sum(math.abs(ta.change(source)), c)
    kaufmanEff = kaufmanVol != 0 ? kaMA1 / kaufmanVol : 0
    kaufmanFast2 = 2 / (kaufmanFast + 1)
    kaufmanSlow2 = 2 / (kaufmanSlow + 1)
    kaufmanSC = math.pow(kaufmanEff * (kaufmanFast2 -kaufmanSlow2) + kaufmanSlow2, 2)
    kaMA = 0.0
    kaMA := kaufmanSC * source + (1 - kaufmanSC) * nz(kaMA[1])
    kaMA


//---Triangular Moving Average (TMA)
calc_tma(source, c) =>
    triMA = ta.sma(ta.sma(source, math.ceil(c / 2)), math.floor(c / 2)+ 1)
    triMA


//Geometric Mean Moving Average (GMMA)
calc_gmma(source, c) =>
    lmean = math.log(source)
    smean = math.sum(lmean, c)
    geoMA = math.exp(smean / c)
    geoMA

//---Variable Index Dynamic Average (VIDA)
calc_vida(source, c) =>
    mom = ta.change(source)
    upSum = math.sum(math.max(mom, 0), c)
    downSum = math.sum(-math.min(mom, 0), c)
    cmo = math.abs((upSum - downSum) / (upSum + downSum))
    F = 2 / (c + 1)
    vida = 0.0
    vida := source * F * cmo + nz(vida[1]) * (1 - F * cmo)
    vida

//---Corrective Moving average (CMA)
calc_cma(source, c) =>
    sma = ta.sma(source, c)
    cma = sma
    v1 = ta.variance(source, c)
    v2 = math.pow(nz(cma[1], cma) - sma, 2)
    v3 = v1 == 0 or v2 == 0 ? 1 : v2 / (v1 + v2)

    var tolerance = math.pow(10, -5)
    float err = 1

    // Gain Factor
    float kPrev = 1
    float k = 1

    for i = 0 to 5000 by 1
        if err > tolerance
            k := v3 * kPrev * (2 - kPrev)
            err := kPrev - k
            kPrev := k
            kPrev

    cma := nz(cma[1], source) + k * (sma - nz(cma[1], source))
    cma

//---Ramnge EMA (REMA)
calc_range_ema(source, c) =>
    alpha = 2 / (1 + c)
    weight = high - low
    weight := weight == 0 ? syminfo.pointvalue : weight
    num = 0.0
    den = 0.0
    num := na(num[1]) ? weight * source : num[1] + alpha * (weight *source - num[1])
    den := na(den[1]) ? weight : den[1] + alpha * (weight - den[1])
    ma = num / den
    ma

// Ribbion

getMa1(c) =>
	switch ma
		'sma' => ta.sma(source,c)
		'ema' => ta.ema(source,c)
		'wma' => ta.wma(source,c)
		'vwma' => ta.vwma(source,c)
		'rma' => ta.rma(source,c)
		'alma' => ta.alma(source,c, 0.85, 6)
		'hma' => ta.hma(source,c)
		'jma' => calc_jma(source,c, phase, power)
		'frama-o' => frama(source, c)
		'frama-m' => frama_mod(source, c)
		'dema' => calc_dema(source, c)
		'tema' => calc_tema(source, c)
		'zlema' => calc_zlema(source, c)
		'smma' => calc_smma(source, c)
		'kma' => calc_kama(source, c)
		'tma' => calc_tma(source, c)
		'gmma' => calc_gmma(source, c)
		'vida' => calc_vida(source, c)
		'cma' => calc_cma(source, c)
		'rema' => calc_range_ema(source, c)

getMa(c) =>
	switch ma2
		'sma' => ta.sma(source,c)
		'ema' => ta.ema(source,c)
		'wma' => ta.wma(source,c)
		'vwma' => ta.vwma(source,c)
		'rma' => ta.rma(source,c)
		'alma' => ta.alma(source,c, 0.85, 6)
		'hma' => ta.hma(source,c)
		'jma' => calc_jma(source,c, phase, power)
		'frama-o' => frama(source, c)
        'frama-m' => frama_mod(source, c)
        'dema' => calc_dema(source, c)
        'tema' => calc_tema(source, c)
        'zlema' => calc_zlema(source, c)
        'smma' => calc_smma(source, c)
        'kma' => calc_kama(source, c)
        'tma' => calc_tma(source, c)
        'gmma' => calc_gmma(source, c)
        'vida' => calc_vida(source, c)
        'cma' => calc_cma(source, c)
        'rema' => calc_range_ema(source, c)


colour1   =   color.new(#008000, 85)
colour2   =   color.new(#7f0d0d, 85)
colour3   =   color.new(#807800, 85)
colour4   =   color.new(#290D7F, 85)
colour5   =   color.new(#00807C, 85)
colour6   =   color.new(#7F430D, 85)

c01 = Theme == 'Theme 1' ? colour1 : Theme == 'Theme 2' ? colour3 : Theme == 'Theme 3' ? colour5 : Theme == 'No fill' ? #FFFFFF00 : na
c02 = Theme == 'Theme 1' ? colour2 : Theme == 'Theme 2' ? colour4 : Theme == 'Theme 3' ? colour6 : Theme == 'N0 fill' ? #FFFFFF00 : na

cl1   =   input.int(2, title='Cloud', inline='Cloud', group='MA cloud')
cl2   =   input.int(6, title='/2', inline='Cloud', group='MA cloud')
cl3   =   input.int(11, title='/3', inline='Cloud', group='MA cloud')
cl4   =   input.int(18, title='/4', inline='Cloud', group='MA cloud')
cl5   =   input.int(21, title='/5', inline='Cloud', group='MA cloud')
cl6   =   input.int(24, title='/6', inline='Cloud', group='MA cloud')
cl7   =   input.int(28, title='/7', inline='Cloud', group='MA cloud')
cl8   =   input.int(34, title='/8', inline='Cloud', group='MA cloud')


rl1   =   input.int(6, title='Ribbon', inline='Ribbon', group='MA Ribbon')
rl2   =   input.int(13, title='/2', inline='Ribbon', group='MA Ribbon')
rl3   =   input.int(20, title='/3', inline='Ribbon', group='MA Ribbon')
rl4   =   input.int(28, title='/4', inline='Ribbon', group='MA Ribbon')
rl5   =   input.int(36, title='/5', inline='Ribbon', group='MA Ribbon')
rl6   =   input.int(45, title='/6', inline='Ribbon', group='MA Ribbon')
rl7   =   input.int(55, title='/7', inline='Ribbon', group='MA Ribbon')
rl8 = input.int(444, title='/8', inline='Ribbon', group='MA Ribbon')


rib1     =   getMa1(rl1)
rib2     =   getMa1(rl2)
rib3     =   getMa1(rl3)
rib4     =   getMa1(rl4)
rib5     =   getMa1(rl5)
rib6     =   getMa1(rl6)
rib7     =   getMa1(rl7)
rib8     =   getMa1(rl8)

plot(rib1, color=color.new(#F5B771, 0), title='1', linewidth=2, display=display.none)
plot(rib2, color=color.new(#F5B056, 0), title='2', linewidth=2, display=display.none)
plot(rib3, color=color.new(#F57B4E, 0), title='3', linewidth=2, display=display.none)
plot(rib4, color=color.new(#F56D58, 0), title='4', linewidth=2, display=display.none)
plot(rib5, color=color.new(#F57D51, 0), title='5', linewidth=2, display=display.none)
plot(rib6, color=color.new(#F55151, 0), title='6', linewidth=2, display=display.none)
plot(rib7, color=color.new(#AA2707, 0), title='7', linewidth=2, display=display.none)
plot(rib8, color=color.new(#AA0000, 0), title='8', linewidth=2, display=display.none)

sma8  =   getMa(cl8)
sma7  =   getMa(cl7)
sma6  =   getMa(cl6)
sma5  =   getMa(cl5)
sma4  =   getMa(cl4)
sma3  =   getMa(cl3)
sma2  =   getMa(cl2)
sma1  =   getMa(cl1)

l8   =   plot(sma8, display=display.none, editable=false)
l7   =   plot(sma7, display=display.none, editable=false)
l6   =   plot(sma6, display=display.none, editable=false)
l5   =   plot(sma5, display=display.none, editable=false)
l4   =   plot(sma4, display=display.none, editable=false)
l3 = plot(sma3, display=display.none, editable=false)
l2 = plot(sma2, display=display.none, editable=false)
l1 = plot(sma1, display=display.none, editable=false)
// --> fill
fill(l8, l1, color=sma7 <= source ? c01 : c02, editable=false)
fill(l7, l1, color=sma7 <= source ? c01 : c02, editable=false)
fill(l6, l1, color=sma6 <= source ? c01 : c02, editable=false)
fill(l5, l1, color=sma5 <= source ? c01 : c02, editable=false)
fill(l4, l1, color=sma4 <= source ? c01 : c02, editable=false)
fill(l3, l1, color=sma3 <= source ? c01 : c02, editable=false)


//plotchar(show_seq ? setupCount == 1 : na, char='', text='1', textcolor=setupCountColor, color=setupCountColor, location=location.abovebar, size=size.tiny)
//plotchar(show_seq ? setupCount == 2 : na, char='', text='2', textcolor=setupCountColor, color=setupCountColor, location=location.abovebar, size=size.tiny, display = display.none)
//plotchar(show_seq ? setupCount == 3 : na, char='', text='3', textcolor=setupCountColor, color=setupCountColor, location=location.abovebar, size=size.tiny, display = display.none)
//plotchar(show_seq ? setupCount == 4 : na, char='', text='4', textcolor=setupCountColor, color=setupCountColor, location=location.abovebar, size=size.tiny, display = display.none)
//plotchar(show_seq ? setupCount == 5 : na, char='', text='5', textcolor=setupCountColor, color=setupCountColor, location=location.abovebar, size=size.tiny, display = display.none)
//plotchar(show_seq ? setupCount == 6 : na, char='', text='6', textcolor=setupCountColor, color=setupCountColor, location=location.abovebar, size=size.tiny, display = display.none)
//plotchar(show_seq ? setupCount == 7 : na, char='', text='7', textcolor=setupCountColor, color=setupCountColor, location=location.abovebar, size=size.tiny, display = display.none)
//plotchar(show_seq ? setupCount == 8 : na, char='', text='8', textcolor=setupCountColor, color=setupCountColor, location=location.abovebar, size=size.tiny)
//plotchar(show_seq ? setupCount == 9 : na, char='', text='9', textcolor=setupCountColor, color=setupCountColor, location=location.abovebar, size=size.tiny)


// ALERTS
// Bar Coloring


// Input
fastLength = input(title="Fast Length", defval=12)
slowLength = input(title="Slow Length", defval=26)
srrrc = input(title="Source", defval=close)
signalLength = input.int(title="Signal Smoothing", minval = 1, maxval = 50, defval = 9)

// Data reference
[macd, signal, hist] = ta.macd(srrrc, fastLength, slowLength, signalLength)

// 4 level of green
greenHigh = #05df09
greenMidHigh = #05df09
greenMidLow = #388E3C
greenLow = #5f3a97

// Yellow
yellowLow = #5f3a97

// 4 level of red
redHigh = #ea0402
redMidHigh = #ea0402
redMidLow = #cc0402
redLow = #5f3a97

// Default color
candleBody = yellowLow

// Ranging trend
if hist > 0
    if hist > hist[1] and hist[1] > 0
        candleBody := greenLow

if hist < 0
    if hist < hist[1] and hist[1] < 0
        candleBody := redLow

// Bullish trend
if macd > 0 and hist > 0
    candleBody := greenMidLow

    if hist > hist[1] and macd[1] > 0 and hist[1] > 0
        candleBody := greenMidHigh

    if hist > hist[2] and macd[2] > 0 and hist[2] > 0
        candleBody := greenHigh

// Bearish trend
if macd < 0 and hist < 0
    candleBody := redMidLow

    if hist < hist[1] and macd[1] < 0 and hist[1] < 0
        candleBody := redMidHigh

    if hist < hist[2] and macd[2] < 0 and hist[2] < 0
        candleBody := redHigh

barcolor(Barcolloring == "Version 1" ? candleBody : close > supertrends ? color.rgb(102, 255, 0) : color.rgb(255, 0, 0)) // Include suggestion by Shaheen204

// TP Signals

multiplier = input.float(title='TP', defval=2, minval=1)
src5 = close
len5 = input.int(title='TP length', defval=150, minval=1)
offset = 0

calcSlope(src5, len5) =>
    sumX = 0.0
    sumY = 0.0
    sumXSqr = 0.0
    sumXY = 0.0
    for i = 1 to len5 by 1
        val = src5[len5 - i]
        per = i + 1.0
        sumX += per

        sumY += val
        sumXSqr += per * per
        sumXY += val * per

        sumXY

    slope = (len5 * sumXY - sumX * sumY) / (len5 * sumXSqr - sumX * sumX)
    average = sumY / len5
    intercept = average - slope * sumX / len5 + slope
    [slope, average, intercept]

var float tmp = na
[s, a, i] = calcSlope(src5, len5)

vwap1 = i + s * (len5 - offset)
sdev = ta.stdev(close, len5)
dev = multiplier * sdev
top1 = vwap1 + dev
bott = vwap1 - dev

//
z1 = vwap1 + dev
x1 = vwap1 - dev

low1 = ta.crossover(close, x1)
high1 = ta.crossunder(close, z1)

plotshape(tpmode == "Version 2" and close < supertrend ? low1 : na, title='low', text='TP', color=color.new(color.red, 0), style=shape.labelup, location=location.belowbar, size=size.small, textcolor=color.new(color.white, 0)) //plot for buy icon
plotshape(tpmode == "Version 2" and close > supertrend ? high1 : na, title='high', text='TP', color=color.new(color.green, 0), style=shape.labeldown, location=location.abovebar, size=size.small, textcolor=color.new(color.white, 0)) //plot for sell icon

// PullBack Signals

start = input.float(title='Start', step=0.00005, defval=0.0134)
increment = input.float(title='Increment', step=0.00005, defval=0.)
maximum = input.float(title='Maximum', step=0.01, defval=0.21)
width = input.int(title='Point Width', minval=1, defval=20)
highlightStartPoints = input(title='Highlight Start Points ?', defval=true)

Curly_Fries = input(150, title='Fast')

EmaClD     = input.bool(true, title="Show TP/SL Points", tooltip="Show TP | Stop Loss Points")

Popeyes = input(200, title='Medium')
Chicken_Sandwich = input(250, 'Slow')
ema_150 = ta.ema(close, Curly_Fries)
ema_200 = ta.ema(close, Popeyes)
ema_250 = ta.ema(close, Chicken_Sandwich)
//a = plot(ema_150, transp=100)
//b = plot(ema_200, transp=100)
//c = plot(ema_250, transp=100)
up = ema_150 > ema_250
down = ema_150 < ema_250
mycolor = up and EmaClD ? color.rgb(0, 255, 234, 71) : down and EmaClD ? color.rgb(255, 12, 32, 72) : na

//fill(a, c, color=mycolor, transp=70)


psar = ta.sar(start, increment, maximum)
dir = psar < close ? 1 : -1

//psarColor = psar < close ? color.rgb(6, 197, 255) : color.rgb(255, 0, 0)


plotshape( close > supertrend and dir == 1 and dir[1] == -1 and highlightStartPoints and ma01 > ma02 and dif > filter ? psar and up :na, title='Up Trend Pullback', style=shape.labelup, location=location.belowbar, size=size.tiny, text='▲', textcolor= color.white, color=#8800ed, transp=0)
plotshape( close < supertrend and dir == -1 and dir[1] == 1 and highlightStartPoints and ma02 > ma01 and dif > filter ? psar and down : na, title='Down Trend Pullback', style=shape.labeldown, location=location.abovebar, size=size.tiny, text='▼', textcolor= color.white, color=#8800ed, transp=0)


// Lux Algo Reversal BAnd
//func
kama(ssrc, llen) =>
    kama = 0.0
    sum_1 = math.sum(math.abs(ssrc - ssrc[1]), llen)
    sum_2 = math.sum(math.abs(ssrc - ssrc[1]), llen)
    kama := nz(kama[1]) + math.pow((sum_1 != 0 ? math.abs(ssrc -ssrc[llen]) / sum_2 : 0) * (0.288 - 0.0666) + 0.0666, 2) * (ssrc - nz(kama[1]))
    kama

//inputs
llength = input(50, title='Band Length')
bd1 = input(9, title='Frontrun Band Deviation')
bd2 = input(11, title='Initial Band Deviation')
bd3 = input(14, title='Final Band Deviation')

//logic
rg = kama(ta.tr, llength)
basis = kama(close, llength)
upper1 = basis + rg * bd1
upper2 = basis + rg * bd2
upper3 = basis + rg * bd3
lower1 = basis - rg * bd1
lower2 = basis - rg * bd2
lower3 = basis - rg * bd3

//ploting
pp1 = plot(show_rev ? upper1 : na, transp=100)
pp2 = plot(show_rev ? upper2 : na, transp=100)
pp3 = plot(show_rev ? upper3 : na, transp=100)
pp4 = plot(show_rev ? lower1 : na, transp=100)
pp5 = plot(show_rev ? lower2 : na, transp=100)
pp6 = plot(show_rev ? lower3 : na, transp=100)
fill(pp1, pp2, color=color.new(#57202c, 70))
fill(pp2, pp3, color=color.new(#57202c, 50))
fill(pp4, pp5, color=color.new(#103c3c, 70))
fill(pp5, pp6, color=color.new(#103c3c, 50))

// Dashboard
showDashboard  = input(true, "Show Dashboard", group="TREND DASHBOARD")
locationDashboard = input.string("Middle Right", "Table Location", ["Top Right", "Middle Right", "Bottom Right", "Top Center", "Middle Center", "Bottom Center", "Top Left", "Middle Left", "Bottom Left"], group="TREND DASHBOARD")
tableTextColor     = input(color.new(#b1b3be, 2), "Table Text Color", group="TREND DASHBOARD")
tableBgColor       = input(color.new(#232534,65), "Table Background Color", group="TREND DASHBOARD")
sizeDashboard       = input.string("Tiny", "Table Size", ["Large", "Normal", "Small", "Tiny"], group="TREND DASHBOARD")

// Functions
f_chartTfInMinutes() =>
    float _resInMinutes = timeframe.multiplier * (timeframe.isseconds ? 1. / 60  : timeframe.isminutes ? 1. : timeframe.isdaily    ? 60. * 24  : timeframe.isweekly ? 60. * 24 * 7  : timeframe.ismonthly ? 60. * 24 * 30.4375 : na)

// Get components
emae = ta.ema(close, 144)
emaBull = close > emae
equal_tf(res) => str.tonumber(res) == f_chartTfInMinutes()
higher_tf(res) => str.tonumber(res) > f_chartTfInMinutes()
too_small_tf(res) => (timeframe.isweekly and res=="1") or (timeframe.ismonthly and str.tonumber(res) < 10)
securityNoRep1(sym, res, srce) =>
    bool bulle = na
    bulle := equal_tf(res) ? srce : bulle
    bulle := higher_tf(res) ? request.security(sym, res, srce, barmerge.gaps_off, barmerge.lookahead_on) : bulle
    bull_array = request.security_lower_tf(syminfo.tickerid, higher_tf(res) ? str.tostring(f_chartTfInMinutes()) : too_small_tf(res) ? (timeframe.isweekly ? "3" : "10") : res, srce)
    if array.size(bull_array) > 1 and not equal_tf(res) and not higher_tf(res)
        bulle := array.pop(bull_array)
    array.clear(bull_array)
    bulle

TF1Bull     = securityNoRep1(syminfo.tickerid, "1"      , emaBull)
TF3Bull   = securityNoRep1(syminfo.tickerid, "3"   , emaBull)
TF5Bull   = securityNoRep1(syminfo.tickerid, "5"   , emaBull)
TF15Bull = securityNoRep1(syminfo.tickerid, "15" , emaBull)
TF30Bull = securityNoRep1(syminfo.tickerid, "30" , emaBull)
TF60Bull = securityNoRep1(syminfo.tickerid, "60" , emaBull)
TF120Bull = securityNoRep1(syminfo.tickerid, "120" , emaBull)
TF240Bull = securityNoRep1(syminfo.tickerid, "240" , emaBull)
TF480Bull = securityNoRep1(syminfo.tickerid, "480" , emaBull)
TFDBull   = securityNoRep1(syminfo.tickerid, "1440", emaBull)

var dashboard_loc = locationDashboard == "Top Right" ?position.top_right : locationDashboard == "Middle Right" ?position.middle_right : locationDashboard == "Bottom Right" ? position.bottom_right : locationDashboard == "Top Center" ? position.top_center : locationDashboard == "Middle Center" ? position.middle_center : locationDashboard == "Bottom Center" ? position.bottom_center : locationDashboard == "Top Left" ? position.top_left : locationDashboard == "Middle Left" ? position.middle_left : position.bottom_left
var dashboard_size = sizeDashboard == "Large" ? size.large : sizeDashboard == "Normal" ? size.normal : sizeDashboard == "Small"? size.small : size.tiny
var dashboard         = showDashboard ? table.new(dashboard_loc, 2,15, tableBgColor, #404250, 1, tableBgColor, 1) : na
dashboard_cell(column, row, txt, signal=false) =>
	table.cell(dashboard, column, row, txt, 0, 0, signal ? #737581 : tableTextColor, text_size=dashboard_size)

dashboard_cell_bg(column, row, col) =>
	table.cell_set_bgcolor(dashboard, column, row, col)

if barstate.islast and showDashboard
	dashboard_cell(0, 0 , "Algo elite")
	dashboard_cell(0, 1 , "Current Position")
	dashboard_cell(0, 2 , "Current Trend")
	dashboard_cell(0, 3 , "Volume")
	dashboard_cell(0, 4 , "Timeframe")
	dashboard_cell(0, 5 , "1 min:")
	dashboard_cell(0, 6 , "3 min:")
	dashboard_cell(0, 7 , "5 min:")
	dashboard_cell(0, 8 , "15 min:")
	dashboard_cell(0, 9 , "30 min:")
	dashboard_cell(0, 10, "1 H:")
	dashboard_cell(0, 11, "2 H:")
	dashboard_cell(0, 12, "4 H:")
	dashboard_cell(0, 13, "8 H:")
	dashboard_cell(0, 14, "Daily:")
	dashboard_cell(1, 0 , "Premium")
	dashboard_cell(1, 1 , emaBull ? "Bullish" : "Bearish", true),  dashboard_cell_bg(1, 1, emaBull ? color.new(#125e5a, 10) : color.new(#672230, 10))
	dashboard_cell(1, 2 ,str.tostring(math.round_to_mintick(volume)))
	dashboard_cell(1, 3 , "Trends")
	dashboard_cell(1, 4 , TF1Bull   ? "Bullish" : "Bearish", true), dashboard_cell_bg(1, 4 , TF1Bull     ? color.new(#125e5a, 10) : color.new(#672230, 10))
	dashboard_cell(1, 5 , TF3Bull   ? "Bullish" : "Bearish", true), dashboard_cell_bg(1, 5 , TF3Bull     ? color.new(#125e5a, 10) : color.new(#672230, 10))
	dashboard_cell(1, 6 , TF5Bull   ? "Bullish" : "Bearish", true), dashboard_cell_bg(1, 6 , TF5Bull     ? color.new(#125e5a, 10) :color.new(#672230, 10))
	dashboard_cell(1, 7 , TF15Bull ? "Bullish" : "Bearish", true), dashboard_cell_bg(1, 7 , TF15Bull ? color.new(#125e5a, 10) : color.new(#672230, 10))
	dashboard_cell(1, 8 , TF30Bull ? "Bullish" : "Bearish", true), dashboard_cell_bg(1, 8 , TF30Bull ? color.new(#125e5a, 10) : color.new(#672230, 10))
	dashboard_cell(1, 9, TF60Bull ? "Bullish" : "Bearish", true), dashboard_cell_bg(1, 9, TF60Bull ? color.new(#125e5a, 10) : color.new(#672230, 10))
	dashboard_cell(1, 10, TF120Bull ? "Bullish" : "Bearish", true),dashboard_cell_bg(1, 10, TF120Bull ? color.new(#125e5a, 10) : color.new(#672230, 10))
	dashboard_cell(1, 11, TF240Bull ? "Bullish" : "Bearish", true), dashboard_cell_bg(1, 11, TF240Bull ? color.new(#125e5a, 10) : color.new(#672230, 10))
	dashboard_cell(1, 12, TF480Bull ? "Bullish" : "Bearish", true), dashboard_cell_bg(1, 12, TF480Bull ? color.new(#125e5a, 10) : color.new(#672230, 10))
	dashboard_cell(1, 13, TFDBull    ? "Bullish" : "Bearish", true), dashboard_cell_bg(1, 13, TFDBull      ? color.new(#125e5a, 10) : color.new(#672230, 10))

//
// Ha Market Bias //
tf(_res, _exp, gaps_on) =>
    gaps_on == 0 ? request.security(syminfo.tickerid, _res, _exp) : gaps_on == true ? request.security(syminfo.tickerid, _res, _exp, barmerge.gaps_on, barmerge.lookahead_off) : request.security(syminfo.tickerid, _res, _exp, barmerge.gaps_off, barmerge.lookahead_off)

ha_htf = ''
ha_len = 100
ha_len2 = 100

// Calculations {
o = ta.ema(open, ha_len)
c = ta.ema(close, ha_len)
h = ta.ema(high, ha_len)
l = ta.ema(low, ha_len)

haclose = tf(ha_htf, (o + h + l + c) / 4, 0)
xhaopen = tf(ha_htf, (o + c) / 2, 0)
haopen = na(xhaopen[1]) ? (o + c) / 2 : (xhaopen[1] + haclose[1]) / 2
hahigh = math.max(h, math.max(haopen, haclose))
halow = math.min(l, math.min(haopen, haclose))


o2 = tf(ha_htf, ta.ema(haopen, ha_len2), 0)
c2 = tf(ha_htf, ta.ema(haclose, ha_len2), 0)
h2 = tf(ha_htf, ta.ema(hahigh, ha_len2), 0)
l22 = tf(ha_htf, ta.ema(halow, ha_len2), 0)

ha_avg = (h2 + l22) / 2
// }

// Oscillator {
osc_len = 7

osc_bias = 100 *(c2 - o2)
osc_smooth = ta.ema(osc_bias, osc_len)

sigcolor =
  (osc_bias > 0) and (osc_bias >= osc_smooth) ? color.new(color.lime, 35) : (osc_bias > 0) and (osc_bias < osc_smooth) ? color.new(color.lime,75) : (osc_bias < 0) and (osc_bias <= osc_smooth) ? color.new(color.red,35) : (osc_bias < 0) and (osc_bias > osc_smooth) ? color.new(color.red,75) : na
// }

// Plots {
p_h = plot(h2, "Bias High", color=color(na), display=display.none, editable=false)
p_l = plot(l22, "Bias Low", color=color(na), display=display.none, editable=false)
p_avg = plot(ha_avg, "Bias Avergae", color=color(na), display=display.none, editable=false)


fill(p_l, p_h, show_ha ? sigcolor : na)
col = o2 > c2 ? color.red : color.lime
// }

// Range Filter DW


//---------------------Range Filter----------------------------------------------------------------------------------------------------------------------

//Conditional Sampling EMA Function
Cond_EMA(x, cond, n) =>
    var val = array.new_float(0)
    var ema_val = array.new_float(1)
    if cond
        array.push(val, x)
        if array.size(val) > 1
            array.remove(val, 0)
        if na(array.get(ema_val, 0))
            array.fill(ema_val, array.get(val, 0))
        array.set(ema_val, 0, (array.get(val, 0) - array.get(ema_val, 0)) * (2 / (n + 1)) + array.get(ema_val, 0))
    EMA = array.get(ema_val, 0)
    EMA

//Conditional Sampling SMA Function
Cond_SMA(x, cond, n) =>
    var vals = array.new_float(0)
    if cond
		array.push(vals, x)
		if array.size(vals) > n
			array.remove(vals, 0)
    SMA = array.avg(vals)
    SMA

//Standard Deviation Function
Stdev(x, n) =>
    math.sqrt(Cond_SMA(math.pow(x, 2), 1, n) - math.pow(Cond_SMA(x, 1, n), 2))

//Range Size Function
rng_size(x, scale, qty, n) =>
    ATR = Cond_EMA(ta.tr(true), 1, n)
    AC = Cond_EMA(math.abs(x - x[1]), 1, n)
    SD = Stdev(x, n)
    rng_size = scale == 'Pips' ? qty * 0.0001 : scale == 'Points' ? qty * syminfo.pointvalue : scale == '% of Price' ? close * qty / 100 : scale == 'ATR' ? qty * ATR : scale == 'Average Change' ? qty * AC : scale == 'Standard Deviation' ? qty * SD : scale == 'Ticks' ? qty * syminfo.mintick : qty
    rng_size

//Two Type Range Filter Function
rng_filt(h, l, rng_, n, type, smooth, sn, av_rf, av_n) =>
    rng_smooth = Cond_EMA(rng_, 1, sn)
    r = smooth ? rng_smooth : rng_
    var rfilt = array.new_float(2, (h + l) / 2)
    array.set(rfilt, 1, array.get(rfilt, 0))
    if type == 'Type 1'
        if h - r > array.get(rfilt, 1)
            array.set(rfilt, 0, h - r)
        if l + r < array.get(rfilt, 1)
            array.set(rfilt, 0, l + r)
    if type == 'Type 2'
        if h >= array.get(rfilt, 1) + r
            array.set(rfilt, 0, array.get(rfilt, 1) + math.floor(math.abs(h - array.get(rfilt, 1)) / r) * r)
        if l <= array.get(rfilt, 1) - r
            array.set(rfilt, 0, array.get(rfilt, 1) - math.floor(math.abs(l - array.get(rfilt, 1)) / r) * r)
    rng_filt1 = array.get(rfilt, 0)
    hi_band1 = rng_filt1 + r
    lo_band1 = rng_filt1 - r
    rng_filt2 = Cond_EMA(rng_filt1, rng_filt1 != rng_filt1[1], av_n)
    hi_band2 = Cond_EMA(hi_band1, rng_filt1 != rng_filt1[1], av_n)
    lo_band2 = Cond_EMA(lo_band1, rng_filt1 != rng_filt1[1], av_n)
    rng_filt = av_rf ? rng_filt2 : rng_filt1
    hi_band = av_rf ? hi_band2 : hi_band1
    lo_band = av_rf ? lo_band2 : lo_band1
    [hi_band, lo_band, rng_filt]

//-----------------------------------------------------------------------------------------------------------------------------------------------------------------
//Inputs
//-----------------------------------------------------------------------------------------------------------------------------------------------------------------

//Filter Type
f_type = 'Type 2'

//Movement Source
mov_src = 'Close'

//Range Size Inputs
rng_qty = 2.618
rng_scale = 'Average Change'

//Range Period
rng_per = 14

//Range Smoothing Inputs
smooth_range = true
smooth_per = 27

//Filter Value Averaging Inputs
av_vals = false
av_samples = 2

//-----------------------------------------------------------------------------------------------------------------------------------------------------------------
//Definitions
//-----------------------------------------------------------------------------------------------------------------------------------------------------------------

//High And Low Values
h_val = mov_src == 'Wicks' ? high : close
l_val = mov_src == 'Wicks' ? low : close

//Range Filter Values
[h_band, l_band, filt] = rng_filt(h_val, l_val, rng_size((h_val + l_val) / 2, rng_scale, rng_qty, rng_per), rng_per, f_type, smooth_range, smooth_per, av_vals, av_samples)

//Direction Conditions
var fdir = 0.0
fdir := filt > filt[1] ? 1 : filt < filt[1] ? -1 : fdir
upward = fdir == 1 ? 1 : 0
downward = fdir == -1 ? 1 : 0

//Colors
filt_color = upward ? #36db7f : downward ? #be130f : #cccccc

//-----------------------------------------------------------------------------------------------------------------------------------------------------------------
//Outputs
//-----------------------------------------------------------------------------------------------------------------------------------------------------------------

//Filter Plot
filt_plot = plot(Show_rangefilter ? filt : na, color=filt_color,linewidth=3, title='Filter', transp=0)

//Bar Color

//External Trend Output
plot(fdir, editable=false, display=display.none, title='External Output - Trend Signal', transp=100)


// Superlchi + TBO

tenkan_len = 6
tenkan_mult = 2

kijun_len          =5
kijun_mult         = 3.

spanB_len  = 26
spanB_mult = 4.

offsett = 0
//------------------------------------------------------------------------------
avg(srcc,length,mult)=>
    atr = ta.atr(length)*mult
    up = hl2 + atr
    dn = hl2 - atr
    upper = 0.,lower = 0.
    upper := srcc[1] < upper[1] ? math.min(up,upper[1]) : up
    lower := srcc[1] > lower[1] ? math.max(dn,lower[1]) : dn

    os = 0,max = 0.,min = 0.
    os := srcc > upper ? 1 : srcc < lower ? 0 : os[1]
    spt = os == 1 ? lower : upper
    max := ta.cross(srcc,spt) ? math.max(srcc,max[1]) : os == 1 ? math.max(srcc,max[1]) : spt
    min := ta.cross(srcc,spt) ? math.min(srcc,min[1]) : os == 0 ? math.min(srcc,min[1]) : spt
    math.avg(max,min)
//------------------------------------------------------------------------------
tenkan = avg(close,tenkan_len,tenkan_mult)
kijun = avg(close,kijun_len,kijun_mult)

senkouA = math.avg(kijun,tenkan)
senkouB = avg(close,spanB_len,spanB_mult)
//------------------------------------------------------------------------------
tenkan_css = #2157f3
kijun_css = #ff5d00

cloud_a = color.new(color.teal,80)
cloud_b = color.new(color.red,80)

chikou_css = #7b1fa2

plot(Show_SuperIchi ? tenkan : na,'Tenkan-Sen',tenkan_css)
plot(Show_SuperIchi ? kijun : na,'Kijun-Sen',kijun_css)

plot(ta.crossover(tenkan,kijun) and Show_SuperIchi ? kijun : na,'Crossover',#2157f3,3,plot.style_circles)
plot(ta.crossunder(tenkan,kijun) and Show_SuperIchi ? kijun : na,'Crossunder',#ff5d00,3,plot.style_circles)

A = plot(Show_SuperIchi ? senkouA : na,'Senkou Span A',na,offset=offsett-1)
B = plot(Show_SuperIchi ? senkouB : na,'Senkou Span B',na,offset=offsett-1)
fill(A,B,senkouA > senkouB ? cloud_a : cloud_b)

plot(close,'Chikou',chikou_css,offset=-offsett+1,display=display.none)

//=======================================================================================
// MODULO DE SEÑALES PARA MEGA POWER
//=======================================================================================
signals     = input.bool(false, "Buy/Sell Signals?") // SE MUESTRAN O NO BUY Y SELL SIGNALS
y1signals = low - (ta.atr(30) * 2)
y2signals = high + (ta.atr(30) * 2)

Buy   = signals and bull ? label.new(bar_index, y1signals, "BUY 🚀",xloc.bar_index, yloc.price, #00d0ff, label.style_label_up, color.rgb(0,0, 0), size.normal) : na

Sell = signals and bear ? label.new(bar_index, y2signals, "SELL",xloc.bar_index, yloc.price, #ff0088, label.style_label_down,color.rgb(255, 255, 255), size.normal) : na
//=======================================================================================

changeCond = bull or bear //NECESARIO PARA EL MODULO DE TPS

//=======================================================================================

// Módulo - Entrada - SL - TPS mejora enviada por: CRIPTOMAN SPAIN @CRIPTOTR4DER
//-----------------------------------------
//*********************************************************
//*                     Módulo                            *
//*              Entrada - SL - TPSEND                      *
//*********************************************************
// Cálculos
groupEnTpSl = "Módulo - Signals"
plot(na)
//=======================================================================================
//ESTO ES EL CALCULO COMO SE HACIA EN EL PRIMER SCRIPT QUE ME ENVIASTE
//=======================================================================================
levels_tip = "Habilita etiquetas compra/venta /SL"
atrLen_tip = "Atr para el Calculo de Stoploss y TakeProfit"
atrRisk_tip = "Multiplicador de Riesgo ATR: Recomendado 1.5 o 1.9"
levels = input(title='Mostrar Etiquetas de Entrada/SL/TP',defval=true, group=groupEnTpSl, tooltip=levels_tip)
atrLen     = input.int(10, "ATR Length SL ", group=groupEnTpSl,tooltip=atrLen_tip)
atrRisk = input.float(1.9, "ATR Risk SL",group=groupEnTpSl,tooltip=atrRisk_tip )
trigger = bull ? 1 : 0
atrBand = ta.atr(atrLen) * atrRisk
atrStop = trigger == 1 ? low - atrBand : high + atrBand
//=======================================================================================
lastTrade(src) => ta.valuewhen(changeCond, src, 0 )
//=======================================================================================
//=======================================================================================
//ENTRADAS
entry = levels ? label.new(time, close, "ENTRY - " +str.tostring(lastTrade(close), "#.######"), xloc.bar_time, yloc.price,color.rgb(0, 145, 255), label.style_label_left, color.white,size.normal) : na
label.set_y(entry, lastTrade(close))
label.delete(entry[1])

stop_y = lastTrade(atrStop)
stop = levels ? label.new(time, close, "STOP LOSS - " +str.tostring(stop_y, "#.#####"), xloc.bar_time, yloc.price, #92080860,label.style_label_left, color.rgb(255, 252, 252), size.normal) : na
label.set_y(stop, stop_y)
label.delete(stop[1])

tp1_y = (lastTrade(close)-lastTrade(atrStop))*1 + lastTrade(close)
tp1    = levels ? label.new(time, close, "TP 1 - " + str.tostring(tp1_y,"#.#####"), xloc.bar_time, yloc.price, #51ff00, label.style_label_left,color.rgb(0, 0, 0), size.normal) : na
label.set_y(tp1, tp1_y)
label.delete(tp1[1])

tp2_y = (lastTrade(close)-lastTrade(atrStop))*2 + lastTrade(close)
tp2    = levels ? label.new(time, close, "TP 2 - " + str.tostring(tp2_y,"#.#####"), xloc.bar_time, yloc.price, #51ff00, label.style_label_left,color.rgb(0, 0, 0), size.normal) : na
label.set_y(tp2, tp2_y)
label.delete(tp2[1])

tp3_y = (lastTrade(close)-lastTrade(atrStop))*3 + lastTrade(close)
tp3    = levels ? label.new(time, close, "TP 3 - " + str.tostring(tp3_y,"#.#####"), xloc.bar_time, yloc.price, #51ff00, label.style_label_left, color.rgb(0, 0, 0), size.normal) : na
label.set_y(tp3, tp3_y)
label.delete(tp3[1])


color TRANSP_CSS = #ffffff00

//Tooltips
string MODE_TOOLTIP              = 'Allows to display historical Structure or only the recent ones'
string STYLE_TOOLTIP            = 'Indicator color theme'
string COLOR_CANDLES_TOOLTIP = 'Display additional candles with a color reflecting the current trend detected by structure'
string SHOW_INTERNAL              = 'Display internal market structure'
string CONFLUENCE_FILTER           = 'Filter non significant internal structure breakouts'
string SHOW_SWING                = 'Display swing market Structure'
string SHOW_SWING_POINTS            = 'Display swing point as labels on the chart'
string SHOW_SWHL_POINTS             = 'Highlight most recent strong and weak high/low points on the chart'
string INTERNAL_OB              = 'Display internal order blocks on the chart\n\nNumber of internal order blocks to display on the chart'
string SWING_OB                 = 'Display swing order blocks on the chart\n\nNumber of internal swing blocks to display on the chart'
string FILTER_OB               = 'Method used to filter out volatile order blocks \n\nIt is recommended to use the cumulative mean range method when a low amount of data is available'
string SHOW_EQHL                 = 'Display equal highs and equal lows on the chart'
string EQHL_BARS                 = 'Number of bars used to confirm equal highs and equal lows'
string EQHL_THRESHOLD               = 'Sensitivity threshold in a range (0, 1) used for the detection of equal highs & lows\n\nLower values will return fewer but more pertinent results'
string SHOW_FVG                 = 'Display fair values gaps on the chart'
string AUTO_FVG                 = 'Filter out non significant fair value gaps'
string FVG_TF                 = 'Fair value gaps timeframe'
string EXTEND_FVG                = 'Determine how many bars to extend the Fair Value Gap boxes on chart'
string PED_ZONES                = 'Display premium, discount, and equilibrium zones on chart'

//-----------------------------------------------------------------------------{
//Settings
//-----------------------------------------------------------------------------{
//General
//----------------------------------------{
mode = input.string('Historical'
   , options = ['Historical', 'Present']
   , group = 'Smart Money Concepts'
   , tooltip = MODE_TOOLTIP)

style = input.string('Colored'
  , options = ['Colored', 'Monochrome']
  , group = 'Smart Money Concepts'
  , tooltip = STYLE_TOOLTIP)

show_trend = input(false, 'Color Candles'
  , group = 'Smart Money Concepts'
  , tooltip = COLOR_CANDLES_TOOLTIP)

//----------------------------------------}
//Internal Structure
//----------------------------------------{
show_internals = input(false, 'Show Internal Structure'
   , group = 'Real Time Internal Structure'
   , tooltip = SHOW_INTERNAL)

show_ibull = input.string('All', 'Bullish Structure'
  , options = ['All', 'BOS', 'CHoCH']
  , inline = 'ibull'
  , group = 'Real Time Internal Structure')

swing_ibull_css = input(#089981, ''
 , inline = 'ibull'
 , group = 'Real Time Internal Structure')

//Bear Structure
show_ibear = input.string('All', 'Bearish Structure'
   , options = ['All', 'BOS', 'CHoCH']
   , inline = 'ibear'
   , group = 'Real Time Internal Structure')

swing_ibear_css = input(#ffffff, ''
 , inline = 'ibear'
 , group = 'Real Time Internal Structure')

ifilter_confluence = input(false, 'Confluence Filter'
   , group = 'Real Time Internal Structure'
   , tooltip = CONFLUENCE_FILTER)

internal_structure_size = input.string('Tiny', 'Internal Label Size'
  , options = ['Tiny', 'Small', 'Normal']
  , group = 'Real Time Internal Structure')

//----------------------------------------}
//Swing Structure
//----------------------------------------{
show_Structure = input(false, 'Show Swing Structure'
   , group = 'Real Time Swing Structure'
   , tooltip = SHOW_SWING)

//Bull Structure
show_bull = input.string('All', 'Bullish Structure'
   , options = ['All', 'BOS', 'CHoCH']
 , inline = 'bull'
 , group = 'Real Time Swing Structure')

swing_bull_css = input(#ffffff, ''
 , inline = 'bull'
 , group = 'Real Time Swing Structure')

//Bear Structure
show_bear = input.string('All', 'Bearish Structure'
   , options = ['All', 'BOS', 'CHoCH']
   , inline = 'bear'
   , group = 'Real Time Swing Structure')

swing_bear_css = input(#ffffff, ''
 , inline = 'bear'
 , group = 'Real Time Swing Structure')

swing_structure_size = input.string('Small', 'Swing Label Size'
 , options = ['Tiny', 'Small', 'Normal']
 , group = 'Real Time Swing Structure')

//Swings
show_swings = input(false, 'Show Swings Points'
   , inline = 'swings'
   , group = 'Real Time Swing Structure'
   , tooltip = SHOW_SWING_POINTS)

length = input.int(50, ''
  , minval = 10
  , inline = 'swings'
  , group = 'Real Time Swing Structure')

show_hl_swings = input(false, 'Show Strong/Weak High/Low'
  , group = 'Real Time Swing Structure'
  , tooltip = SHOW_SWHL_POINTS)

//----------------------------------------}
//Order Blocks
//----------------------------------------{
show_iob = input(false, 'Internal Order Blocks'
   , inline = 'iob'
   , group = 'Order Blocks'
   , tooltip = INTERNAL_OB)
iob_showlast = input.int(5, ''
  , minval = 1
  , inline = 'iob'
  , group = 'Order Blocks')

show_ob = input(true, 'Swing Order Blocks'
  , inline = 'ob'
  , group = 'Order Blocks'
  , tooltip = SWING_OB)

ob_showlast = input.int(5, ''
  , minval = 1
  , inline = 'ob'
  , group = 'Order Blocks')

ob_filter = input.string('Atr', 'Order Block Filter'
  , options = ['Atr', 'Cumulative Mean Range']
  , group = 'Order Blocks'
  , tooltip = FILTER_OB)

ibull_ob_css = input.color(color.new(#e5f77c, 80), 'Internal Bullish OB'  , group = 'Order Blocks')

ibear_ob_css = input.color(color.new(#e5f77c, 80), 'Internal Bearish OB', group = 'Order Blocks')

bull_ob_css = input.color(color.new(#00e2fb, 70), 'Bullish OB', group = 'Order Blocks')

bear_ob_css = input.color(color.new(#ff0015, 70), 'Bearish OB', group = 'Order Blocks')

//----------------------------------------}
//EQH/EQL
//----------------------------------------{
show_eq = input(false, 'Equal High/Low'
   , group = 'EQH/EQL'
   , tooltip = SHOW_EQHL)

eq_len = input.int(3, 'Bars Confirmation'
  , minval = 1
  , group = 'EQH/EQL'
  , tooltip = EQHL_BARS)

eq_threshold = input.float(0.1, 'Threshold'
  , minval = 0
  , maxval = 0.5
  , step = 0.1
  , group = 'EQH/EQL'
  , tooltip = EQHL_THRESHOLD)

eq_size = input.string('Tiny', 'Label Size'
  , options = ['Tiny', 'Small', 'Normal']
  , group = 'EQH/EQL')

//----------------------------------------}
//Fair Value Gaps
//----------------------------------------{
show_fvg = input(true, 'Fair Value Gaps'
   , group = 'Fair Value Gaps'
   , tooltip = SHOW_FVG)

fvg_auto = input(true, "Auto Threshold"
  , group = 'Fair Value Gaps'
  , tooltip = AUTO_FVG)

fvg_tf = input.timeframe('', "Timeframe"
  , group = 'Fair Value Gaps'
  , tooltip = FVG_TF)

bull_fvg_css = input.color(color.new(#ffffff, 53), 'Bullish FVG'
  , group = 'Fair Value Gaps')

bear_fvg_css = input.color(color.new(#ffffff, 53), 'Bearish FVG'
  , group = 'Fair Value Gaps')

fvg_extend = input.int(10, "Extend FVG"
  , minval = 0
  , group = 'Fair Value Gaps'
  , tooltip = EXTEND_FVG)

//----------------------------------------}
//Previous day/week high/low
//----------------------------------------{
//Daily
show_pdhl = input(true, 'Daily'
   , inline = 'daily'
   , group = 'Highs & Lows MTF')

pdhl_style = input.string('⎯⎯⎯', ''
  , options = ['⎯⎯⎯', '----', '····']
  , inline = 'daily'
  , group = 'Highs & Lows MTF')

pdhl_css = input(#ffffff, ''
  , inline = 'daily'
  , group = 'Highs & Lows MTF')

//Weekly
show_pwhl = input(false, 'Weekly'
  , inline = 'weekly'
  , group = 'Highs & Lows MTF')

pwhl_style = input.string('⎯⎯⎯', ''
 , options = ['⎯⎯⎯', '----', '····']
 , inline = 'weekly'
 , group = 'Highs & Lows MTF')

pwhl_css = input(#ffffff, ''
 , inline = 'weekly'
 , group = 'Highs & Lows MTF')

//Monthly
show_pmhl = input(false, 'Monthly'
  , inline = 'monthly'
  , group = 'Highs & Lows MTF')

pmhl_style = input.string('⎯⎯⎯', ''
 , options = ['⎯⎯⎯', '----', '····']
 , inline = 'monthly'
 , group = 'Highs & Lows MTF')

pmhl_css = input(#ffffff, ''
 , inline = 'monthly'
 , group = 'Highs & Lows MTF')
//----------------------------------------}
//Premium/Discount zones
//----------------------------------------{
show_sd = input(true, 'Premium/Discount Zones'
   , group = 'Premium & Discount Zones'
   , tooltip = PED_ZONES)

premium_css = input.color(#ffffff, 'Premium Zone'
  , group = 'Premium & Discount Zones')

eq_css = input.color(#b2b5be, 'Equilibrium Zone'
  , group = 'Premium & Discount Zones')

discount_css = input.color(#ffffff, 'Discount Zone'
  , group = 'Premium & Discount Zones')

//-----------------------------------------------------------------------------}
//Functions
//-----------------------------------------------------------------------------{
n = bar_index

atr = ta.atr(200)
cmean_range = ta.cum(high - low) / n

//HL Output function
hl() => [high, low]

//Get ohlc values function
get_ohlc()=> [close[1], open[1], high, low, high[2], low[2]]

//Display Structure function
display_Structure(x, y, txt, css, dashed, down, lbl_size)=>
    structure_line = line.new(x, y, n, y		, color = css		, style = dashed ? line.style_dashed : line.style_solid)

    structure_lbl = label.new(int(math.avg(x, n)), y, txt		, color = TRANSP_CSS		, textcolor = css		, style = down ? label.style_label_down : label.style_label_up		, size = lbl_size)

    if mode == 'Present'
		line.delete(structure_line[1])
		label.delete(structure_lbl[1])

//Swings detection/measurements
swings(len)=>
    var os = 0

    upper = ta.highest(len)
    lower = ta.lowest(len)

    os := high[len] > upper ? 0 : low[len] < lower ? 1 : os[1]

    top = os == 0 and os[1] != 0 ? high[len] : 0
    btm = os == 1 and os[1] != 1 ? low[len] : 0

    [top, btm]

//Order block coordinates function
ob_coord(use_max, loc, target_top, target_btm, target_left,target_type)=>
    min = 99999999.
    max = 0.
    idx = 1

    ob_threshold = ob_filter == 'Atr' ? atr : cmean_range

    //Search for highest/lowest high within the structure interval and get range
    if use_max
        for i = 1 to (n - loc)-1
            if (high[i] - low[i]) < ob_threshold[i] * 2
                max := math.max(high[i], max)
                min := max == high[i] ? low[i] : min
                idx := max == high[i] ? i : idx
    else
        for i = 1 to (n - loc)-1
            if (high[i] - low[i]) < ob_threshold[i] * 2
                min := math.min(low[i], min)
                max := min == low[i] ? high[i] : max
                idx := min == low[i] ? i : idx

	array.unshift(target_top, max)
	array.unshift(target_btm, min)
    array.unshift(target_left, time[idx])
    array.unshift(target_type, use_max ? -1 : 1)

//Set order blocks
display_ob(boxes, target_top, target_btm, target_left, target_type,show_last, swing, size)=>
    for i = 0 to math.min(show_last-1, size-1)
        get_box = array.get(boxes, i)

		box.set_lefttop(get_box, array.get(target_left, i),array.get(target_top, i))
		box.set_rightbottom(get_box, array.get(target_left, i),array.get(target_btm, i))
		box.set_extend(get_box, extend.right)

        color css = na

        if swing
            if style == 'Monochrome'
                css := array.get(target_type, i) == 1 ? color.new(#b2b5be, 80) : color.new(#5d606b, 80)
                border_css = array.get(target_type, i) == 1 ? #b2b5be : #5d606b
                box.set_border_color(get_box, border_css)
            else
                css := array.get(target_type, i) == 1 ? bull_ob_css : bear_ob_css
                box.set_border_color(get_box, css)

            box.set_bgcolor(get_box, css)
        else
            if style == 'Monochrome'
                css := array.get(target_type, i) == 1 ? color.new(#b2b5be, 80) : color.new(#5d606b, 80)
            else
                css := array.get(target_type, i) == 1 ? ibull_ob_css : ibear_ob_css

            box.set_border_color(get_box, css)
            box.set_bgcolor(get_box, css)

//Line Style function
get_line_style(style) =>
    out = switch style
		'⎯⎯⎯' => line.style_solid
		'----' => line.style_dashed
		'····' => line.style_dotted

//Set line/labels function for previous high/lows
phl(h, l, tf, css)=>
    var line high_line = line.new(na,na,na,na		, xloc = xloc.bar_time		, color = css		, style = get_line_style(pdhl_style))

	var label high_lbl = label.new(na,na		, xloc = xloc.bar_time		, text = str.format('P{0}H', tf)		, color = TRANSP_CSS		, textcolor = css		, size = size.small, style = label.style_label_left)

	var line low_line = line.new(na,na,na,na		, xloc = xloc.bar_time		, color = css		, style = get_line_style(pdhl_style))

	var label low_lbl = label.new(na,na		, xloc = xloc.bar_time		, text = str.format('P{0}L', tf)		, color = TRANSP_CSS		, textcolor = css		, size = size.small, style = label.style_label_left)

	hy = ta.valuewhen(h != h[1], h, 1)
	hx = ta.valuewhen(h == high, time, 1)

	ly = ta.valuewhen(l != l[1], l, 1)
	lx = ta.valuewhen(l == low, time, 1)

	if barstate.islast
		ext = time + (time - time[1])*20

		//High
        line.set_xy1(high_line, hx, hy)
        line.set_xy2(high_line, ext, hy)

        label.set_xy(high_lbl, ext, hy)

        //Low
        line.set_xy1(low_line, lx, ly)
        line.set_xy2(low_line, ext, ly)

        label.set_xy(low_lbl, ext, ly)

//-----------------------------------------------------------------------------}
//Global variables
//-----------------------------------------------------------------------------{
var trend4 = 0, var itrend = 0

var top_y = 0., var top_x = 0
var btm_y = 0., var btm_x = 0

var itop_y = 0., var itop_x = 0
var ibtm_y = 0., var ibtm_x = 0

var trail_up = high, var trail_dn = low
var trail_up_x = 0, var trail_dn_x = 0

var top_cross = true, var btm_cross = true
var itop_cross = true, var ibtm_cross = true

var txt_top = '', var txt_btm = ''

//Alerts
bull_choch_alert = false
bull_bos_alert  = false

bear_choch_alert = false
bear_bos_alert  = false

bull_ichoch_alert = false
bull_ibos_alert  = false

bear_ichoch_alert = false
bear_ibos_alert  = false
bull_iob_break = false
bear_iob_break = false

bull_ob_break = false
bear_ob_break = false

eqh_alert = false
eql_alert = false

//Structure colors
var bull_css = style == 'Monochrome' ? #b2b5be   : swing_bull_css

var bear_css = style == 'Monochrome' ? #b2b5be  : swing_bear_css

var ibull_css = style == 'Monochrome' ? #b2b5be  : swing_ibull_css

var ibear_css = style == 'Monochrome' ? #b2b5be  : swing_ibear_css

//Labels size
var internal_structure_lbl_size = internal_structure_size == 'Tiny'	? size.tiny	: internal_structure_size == 'Small'	? size.small	: size.normal

var swing_structure_lbl_size = swing_structure_size == 'Tiny'	? size.tiny	: swing_structure_size == 'Small'	? size.small	: size.normal

var eqhl_lbl_size = eq_size == 'Tiny'	? size.tiny	: eq_size == 'Small'	? size.small	: size.normal

//Swings
[top, btm] = swings(length)
[itop, ibtm] = swings(5)

//-----------------------------------------------------------------------------}
//Pivot High
//-----------------------------------------------------------------------------{
var line extend_top = na

var label extend_top_lbl = label.new(na, na	, color = TRANSP_CSS	, textcolor = bear_css	, style = label.style_label_down	, size = size.tiny)

if top
    top_cross := true
    txt_top := top > top_y ? 'HH' : 'LH'

    if show_swings
        top_lbl = label.new(n-length, top, txt_top			, color = TRANSP_CSS			, textcolor = bear_css			, style = label.style_label_down			, size = swing_structure_lbl_size)

        if mode == 'Present'
            label.delete(top_lbl[1])

    //Extend recent top to last bar
    line.delete(extend_top[1])
    extend_top := line.new(n-length, top, n, top, color = bear_css)

    top_y := top
    top_x := n - length

    trail_up := top
    trail_up_x := n - length

if itop
    itop_cross := true

    itop_y := itop
    itop_x := n - 5

//Trailing maximum
trail_up := math.max(high, trail_up)
trail_up_x := trail_up == high ? n : trail_up_x

//Set top extension label/line
if barstate.islast and show_hl_swings
    line.set_xy1(extend_top, trail_up_x, trail_up)
    line.set_xy2(extend_top, n + 20, trail_up)
    label.set_x(extend_top_lbl, n + 20)
    label.set_y(extend_top_lbl, trail_up)
    label.set_text(extend_top_lbl, trend4 < 0 ? 'Strong High' : 'Weak High')

//-----------------------------------------------------------------------------}
//Pivot Low
//-----------------------------------------------------------------------------{
var line extend_btm = na

var label extend_btm_lbl = label.new(na, na, color = TRANSP_CSS	, textcolor = bull_css	, style = label.style_label_up	, size = size.tiny)

if btm
    btm_cross := true
    txt_btm := btm < btm_y ? 'LL' : 'HL'

    if show_swings
        btm_lbl = label.new(n - length, btm, txt_btm, color = TRANSP_CSS, textcolor = bull_css, style = label.style_label_up, size = swing_structure_lbl_size)

        if mode == 'Present'
            label.delete(btm_lbl[1])

    //Extend recent btm to last bar
    line.delete(extend_btm[1])
    extend_btm := line.new(n - length, btm, n, btm, color = bull_css)

    btm_y := btm
    btm_x := n-length

    trail_dn := btm
    trail_dn_x := n-length

if ibtm
    ibtm_cross := true

    ibtm_y := ibtm
    ibtm_x := n - 5

//Trailing minimum
trail_dn := math.min(low, trail_dn)
trail_dn_x := trail_dn == low ? n : trail_dn_x

//Set btm extension label/line
if barstate.islast and show_hl_swings
    line.set_xy1(extend_btm, trail_dn_x, trail_dn)
    line.set_xy2(extend_btm, n + 20, trail_dn)

    label.set_x(extend_btm_lbl, n + 20)
    label.set_y(extend_btm_lbl, trail_dn)
    label.set_text(extend_btm_lbl, trend4 > 0 ? 'Strong Low' : 'Weak Low')

//-----------------------------------------------------------------------------}
//Order Blocks Arrays
//-----------------------------------------------------------------------------{
var iob_top = array.new_float(0)
var iob_btm = array.new_float(0)
var iob_left = array.new_int(0)
var iob_type = array.new_int(0)

var ob_top = array.new_float(0)
var ob_btm = array.new_float(0)
var ob_left = array.new_int(0)
var ob_type = array.new_int(0)

//-----------------------------------------------------------------------------}
//Pivot High BOS/CHoCH
//-----------------------------------------------------------------------------{
//Filtering
var bull_concordant = true

if ifilter_confluence
    bull_concordant := high - math.max(close, open) > math.min(close, open - low)

//Detect internal bullish Structure
if ta.crossover(close, itop_y) and itop_cross and top_y != itop_y and bull_concordant
    bool choch = na

    if itrend < 0
        choch := true
        bull_ichoch_alert := true
    else
        bull_ibos_alert := true

    txt = choch ? 'CHoCH' : 'BOS'

    if show_internals
        if show_ibull == 'All' or (show_ibull == 'BOS' and not choch) or (show_ibull == 'CHoCH' and choch)
			display_Structure(itop_x, itop_y, txt, ibull_css, true, true, internal_structure_lbl_size)

    itop_cross := false
    itrend := 1

    //Internal Order Block
    if show_iob
        ob_coord(false, itop_x, iob_top, iob_btm, iob_left, iob_type)

//Detect bullish Structure
if ta.crossover(close, top_y) and top_cross
    bool choch = na

    if trend4 < 0
        choch := true
        bull_choch_alert := true
    else
        bull_bos_alert := true

    txt = choch ? 'CHoCH' : 'BOS'

    if show_Structure
        if show_bull == 'All' or (show_bull == 'BOS' and not choch) or(show_bull == 'CHoCH' and choch)
			display_Structure(top_x, top_y, txt, bull_css, false, true, swing_structure_lbl_size)

    //Order Block
    if show_ob
        ob_coord(false, top_x, ob_top, ob_btm, ob_left, ob_type)

    top_cross := false
    trend4 := 1

//-----------------------------------------------------------------------------}
//Pivot Low BOS/CHoCH
//-----------------------------------------------------------------------------{
var bear_concordant = true

if ifilter_confluence
    bear_concordant := high - math.max(close, open) < math.min(close, open - low)

//Detect internal bearish Structure
if ta.crossunder(close, ibtm_y) and ibtm_cross and btm_y != ibtm_y and bear_concordant
    bool choch = false

    if itrend > 0
        choch := true
        bear_ichoch_alert := true
    else
        bear_ibos_alert := true

    txt = choch ? 'CHoCH' : 'BOS'

    if show_internals
        if show_ibear == 'All' or (show_ibear == 'BOS' and not choch) or (show_ibear == 'CHoCH' and choch)
            display_Structure(ibtm_x, ibtm_y, txt, ibear_css, true,false, internal_structure_lbl_size)

    ibtm_cross := false
    itrend := -1

    //Internal Order Block
    if show_iob
        ob_coord(true, ibtm_x, iob_top, iob_btm, iob_left, iob_type)

//Detect bearish Structure
if ta.crossunder(close, btm_y) and btm_cross
    bool choch = na

    if trend4 > 0
        choch := true
        bear_choch_alert := true
    else
        bear_bos_alert := true

    txt = choch ? 'CHoCH' : 'BOS'

    if show_Structure
        if show_bear == 'All' or (show_bear == 'BOS' and not choch) or (show_bear == 'CHoCH' and choch)
            display_Structure(btm_x, btm_y, txt, bear_css, false, false, swing_structure_lbl_size)

    //Order Block
    if show_ob
        ob_coord(true, btm_x, ob_top, ob_btm, ob_left, ob_type)

    btm_cross := false
    trend4 := -1

//-----------------------------------------------------------------------------}
//Order Blocks
//-----------------------------------------------------------------------------{
//Set order blocks
var iob_boxes = array.new_box(0)
var ob_boxes = array.new_box(0)

//Delete internal order blocks box coordinates if top/bottom is broken
for element in iob_type
	index = array.indexof(iob_type, element)

	if close < array.get(iob_btm, index) and element == 1
		array.remove(iob_top, index)
        array.remove(iob_btm, index)
        array.remove(iob_left, index)
        array.remove(iob_type, index)
        bull_iob_break := true

	else if close > array.get(iob_top, index) and element == -1
		array.remove(iob_top, index)
		array.remove(iob_btm, index)
		array.remove(iob_left, index)
		array.remove(iob_type, index)
		bear_iob_break := true

//Delete internal order blocks box coordinates if top/bottom is broken
for element in ob_type
    index = array.indexof(ob_type, element)

	if close < array.get(ob_btm, index) and element == 1
        array.remove(ob_top, index)
        array.remove(ob_btm, index)
        array.remove(ob_left, index)
        array.remove(ob_type, index)
        bull_ob_break := true

	else if close > array.get(ob_top, index) and element == -1
		array.remove(ob_top, index)
		array.remove(ob_btm, index)
		array.remove(ob_left, index)
		array.remove(ob_type, index)
		bear_ob_break := true

iob_size = array.size(iob_type)
ob_size = array.size(ob_type)

if barstate.isfirst
    if show_iob
        for i = 0 to iob_showlast-1
            array.push(iob_boxes, box.new(na,na,na,na, xloc = xloc.bar_time))
    if show_ob
		for i = 0 to ob_showlast-1
            array.push(ob_boxes, box.new(na,na,na,na, xloc = xloc.bar_time))

if iob_size > 0
    if barstate.islast
        display_ob(iob_boxes, iob_top, iob_btm, iob_left, iob_type, iob_showlast, false, iob_size)

if ob_size > 0
    if barstate.islast
        display_ob(ob_boxes, ob_top, ob_btm, ob_left, ob_type, ob_showlast, true, ob_size)

//-----------------------------------------------------------------------------}
//EQH/EQL
//-----------------------------------------------------------------------------{
var eq_prev_top = 0.
var eq_top_x = 0

var eq_prev_btm = 0.
var eq_btm_x = 0

if show_eq
    eq_top = ta.pivothigh(eq_len, eq_len)
    eq_btm = ta.pivotlow(eq_len, eq_len)

    if eq_top
        max = math.max(eq_top, eq_prev_top)
        min = math.min(eq_top, eq_prev_top)

        if max < min + atr * eq_threshold
            eqh_line = line.new(eq_top_x, eq_prev_top, n-eq_len,eq_top, color = bear_css, style = line.style_dotted)

			eqh_lbl = label.new(int(math.avg(n-eq_len, eq_top_x)),eq_top, 'EQH', color = #00000000, textcolor = bear_css, style = label.style_label_down, size = eqhl_lbl_size)
			if mode == 'Present'
                line.delete(eqh_line[1])
                label.delete(eqh_lbl[1])

			eqh_alert := true

			eq_prev_top := eq_top
			eq_top_x := n-eq_len

    if eq_btm
        max = math.max(eq_btm, eq_prev_btm)
        min = math.min(eq_btm, eq_prev_btm)

        if min > max - atr * eq_threshold
            eql_line = line.new(eq_btm_x, eq_prev_btm, n-eq_len, eq_btm, color = bull_css, style = line.style_dotted)

			eql_lbl = label.new(int(math.avg(n-eq_len, eq_btm_x)), eq_btm, 'EQL', color = #00000000, textcolor = bull_css, style = label.style_label_up, size = eqhl_lbl_size)

            eql_alert := true

            if mode == 'Present'
                line.delete(eql_line[1])
                label.delete(eql_lbl[1])

            eq_prev_btm := eq_btm
            eq_btm_x := n-eq_len

//-----------------------------------------------------------------------------}
//Fair Value Gaps
//-----------------------------------------------------------------------------{
var bullish_fvg_max = array.new_box(0)
var bullish_fvg_min = array.new_box(0)

var bearish_fvg_max = array.new_box(0)
var bearish_fvg_min = array.new_box(0)

float bullish_fvg_avg = na
float bearish_fvg_avg = na

bullish_fvg_cnd = false
bearish_fvg_cnd = false

[src_c1, src_o1, src_h, src_l, src_h2, src_l2] =  request.security(syminfo.tickerid, fvg_tf, get_ohlc())

if show_fvg
    delta_per = (src_c1 - src_o1) / src_o1 * 100

	change_tf = timeframe.change(fvg_tf)

    threshold = fvg_auto ? ta.cum(math.abs(change_tf ? delta_per :0)) / n * 2 :0

	//FVG conditions
	bullish_fvg_cnd := src_l > src_h2 and src_c1 > src_h2 and delta_per > threshold and change_tf

	bearish_fvg_cnd := src_h < src_l2 and src_c1 < src_l2 and -delta_per > threshold and change_tf

    //FVG Areas
    if bullish_fvg_cnd
        array.unshift(bullish_fvg_max, box.new(n-1, src_l, n +fvg_extend, math.avg(src_l, src_h2), border_color = bull_fvg_css, bgcolor = bull_fvg_css))

		array.unshift(bullish_fvg_min, box.new(n-1, math.avg(src_l,src_h2), n + fvg_extend, src_h2, border_color = bull_fvg_css, bgcolor = bull_fvg_css))
    if bearish_fvg_cnd
        array.unshift(bearish_fvg_max, box.new(n-1, src_h, n + fvg_extend, math.avg(src_h, src_l2), border_color = bear_fvg_css, bgcolor = bear_fvg_css))

        array.unshift(bearish_fvg_min, box.new(n-1, math.avg(src_h, src_l2), n + fvg_extend, src_l2, border_color = bear_fvg_css, bgcolor = bear_fvg_css))

    for bx in bullish_fvg_min
        if low < box.get_bottom(bx)
            box.delete(bx)
            box.delete(array.get(bullish_fvg_max, array.indexof(bullish_fvg_min, bx)))

    for bx in bearish_fvg_max
        if high > box.get_top(bx)
            box.delete(bx)
            box.delete(array.get(bearish_fvg_min, array.indexof(bearish_fvg_max, bx)))

//-----------------------------------------------------------------------------}
//Previous day/week high/lows
//-----------------------------------------------------------------------------{
//Daily high/low
[pdh, pdl] = request.security(syminfo.tickerid, 'D', hl(), lookahead = barmerge.lookahead_on)

//Weekly high/low
[pwh, pwl] = request.security(syminfo.tickerid, 'W', hl(), lookahead = barmerge.lookahead_on)

//Monthly high/low
[pmh, pml] = request.security(syminfo.tickerid, 'M', hl(), lookahead = barmerge.lookahead_on)

//Display Daily
if show_pdhl
    phl(pdh, pdl, 'D', pdhl_css)

//Display Weekly
if show_pwhl
    phl(pwh, pwl, 'W', pwhl_css)

//Display Monthly
if show_pmhl
    phl(pmh, pml, 'M', pmhl_css)

//-----------------------------------------------------------------------------}
//Premium/Discount/Equilibrium zones
//-----------------------------------------------------------------------------{
var premium = box.new(na, na, na, na, bgcolor = color.new(premium_css, 50), border_color = na)

var premium_lbl = label.new(na, na, text = '🛒🛒🛒 SELL ZONE 🛒🛒🛒',   color = TRANSP_CSS,   textcolor = premium_css,   style = label.style_label_down,   size = size.small)

var eq = box.new(na, na, na, na, bgcolor = color.rgb(120, 123, 134, 50), border_color = na)

var eq_lbl = label.new(na, na, text = 'Equilibrium', color = TRANSP_CSS, textcolor = eq_css, style = label.style_label_left, size = size.small)

var discount = box.new(na, na, na, na, bgcolor = color.new(discount_css, 80), border_color = na)

var discount_lbl = label.new(na, na, text = '🛒🛒🛒 BUY ZONE 🛒🛒🛒',   color = TRANSP_CSS,   textcolor = discount_css,   style = label.style_label_up,   size = size.small)
//Show Premium/Discount Areas
if barstate.islast and show_sd
    avg = math.avg(trail_up, trail_dn)

    box.set_lefttop(premium, math.max(top_x, btm_x), trail_up)
    box.set_rightbottom(premium, n, .95 * trail_up + .05 * trail_dn)

    label.set_xy(premium_lbl, int(math.avg(math.max(top_x, btm_x), n)), trail_up)

    box.set_lefttop(eq, math.max(top_x, btm_x), .525 * trail_up + .475*trail_dn)
    box.set_rightbottom(eq, n, .525 * trail_dn + .475 * trail_up)

    label.set_xy(eq_lbl, n, avg)

    box.set_lefttop(discount, math.max(top_x, btm_x), .95 * trail_dn +.05 * trail_up)
    box.set_rightbottom(discount, n, trail_dn)
    label.set_xy(discount_lbl, int(math.avg(math.max(top_x, btm_x),n)), trail_dn)

//-----------------------------------------------------------------------------}
//Trend
//-----------------------------------------------------------------------------{
var color trend_css = na

if show_trend
    if style == 'Colored'
        trend_css := itrend == 1 ? bull_css : bear_css
    else if style == 'Monochrome'
        trend_css := itrend == 1 ? #b2b5be : #5d606b

plotcandle(open, high, low, close , color = trend_css, wickcolor = trend_css, bordercolor = trend_css, editable = false)
How to Apply Pine Script in TradingView:
- Open TradingView and log in.
- Navigate to the Pine Script Editor at the bottom of the screen.
- Copy the provided Pine Script code.
- Paste it into the editor and click Save.
- Name the script, e.g., “Elite Algo TP Smart Money Fixed.”
- Click Add to Chart to apply the script.
- Customize the settings via the indicator panel to align with your trading style.
Final Verdict:
The Elite Algo TP Smart Money Fixed script excels in integrating advanced market analysis with dynamic signal generation and risk management. While its complexity might overwhelm beginners, experienced traders will appreciate its depth and reliability. Its non-repainting nature ensures actionable signals, making it a valuable asset for technical analysis and structured trading strategies.
RELATED POSTS
View all
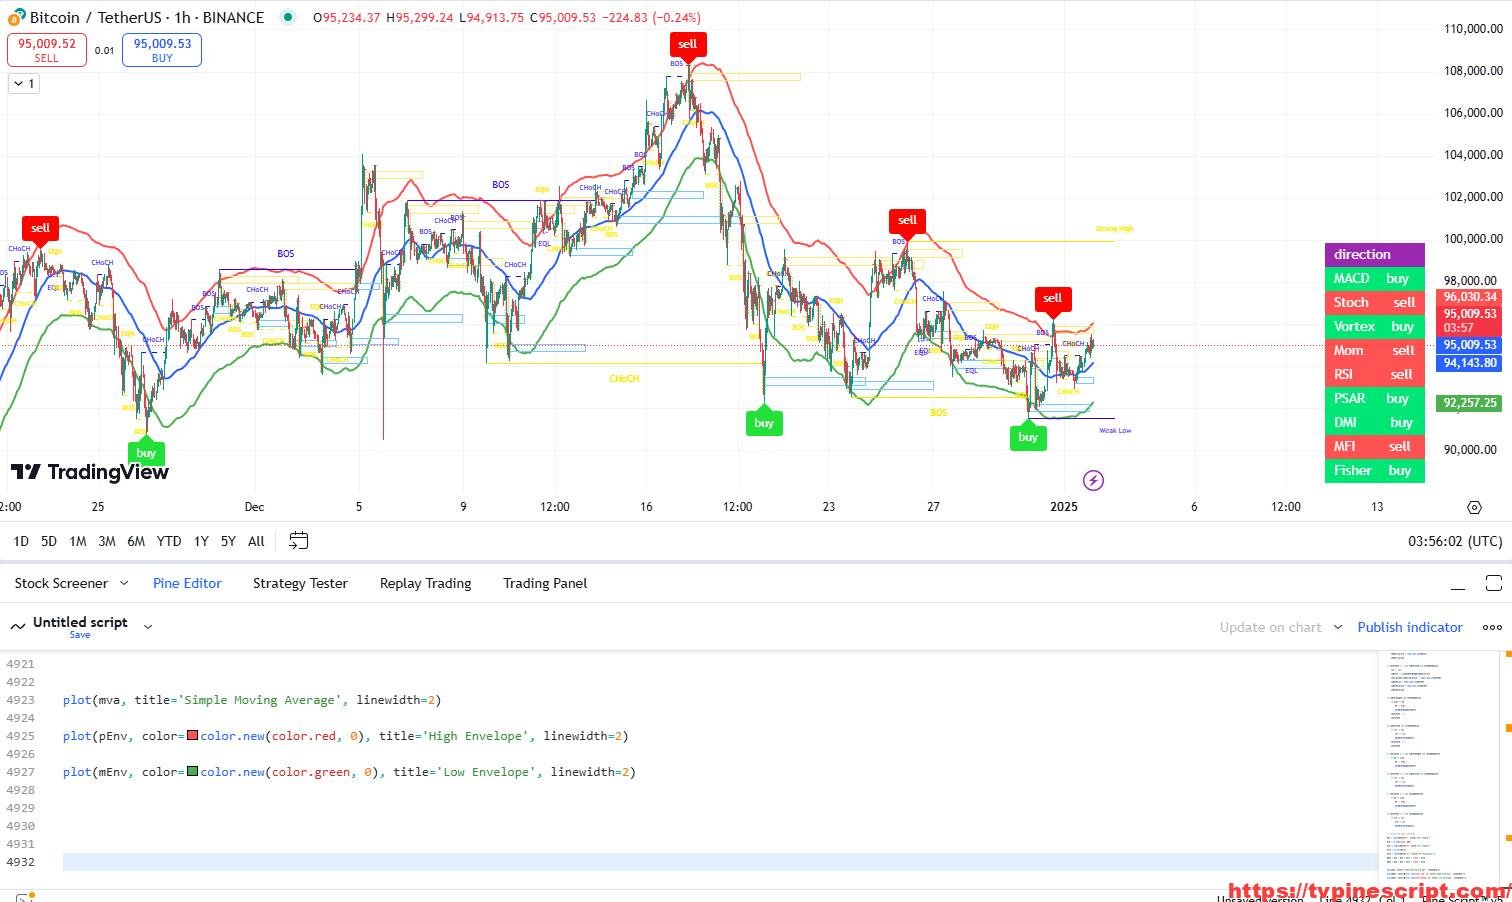
Scalping and Market Structure Analysis with Advanced Pine Script Indicators
January 3, 2025 | by admin
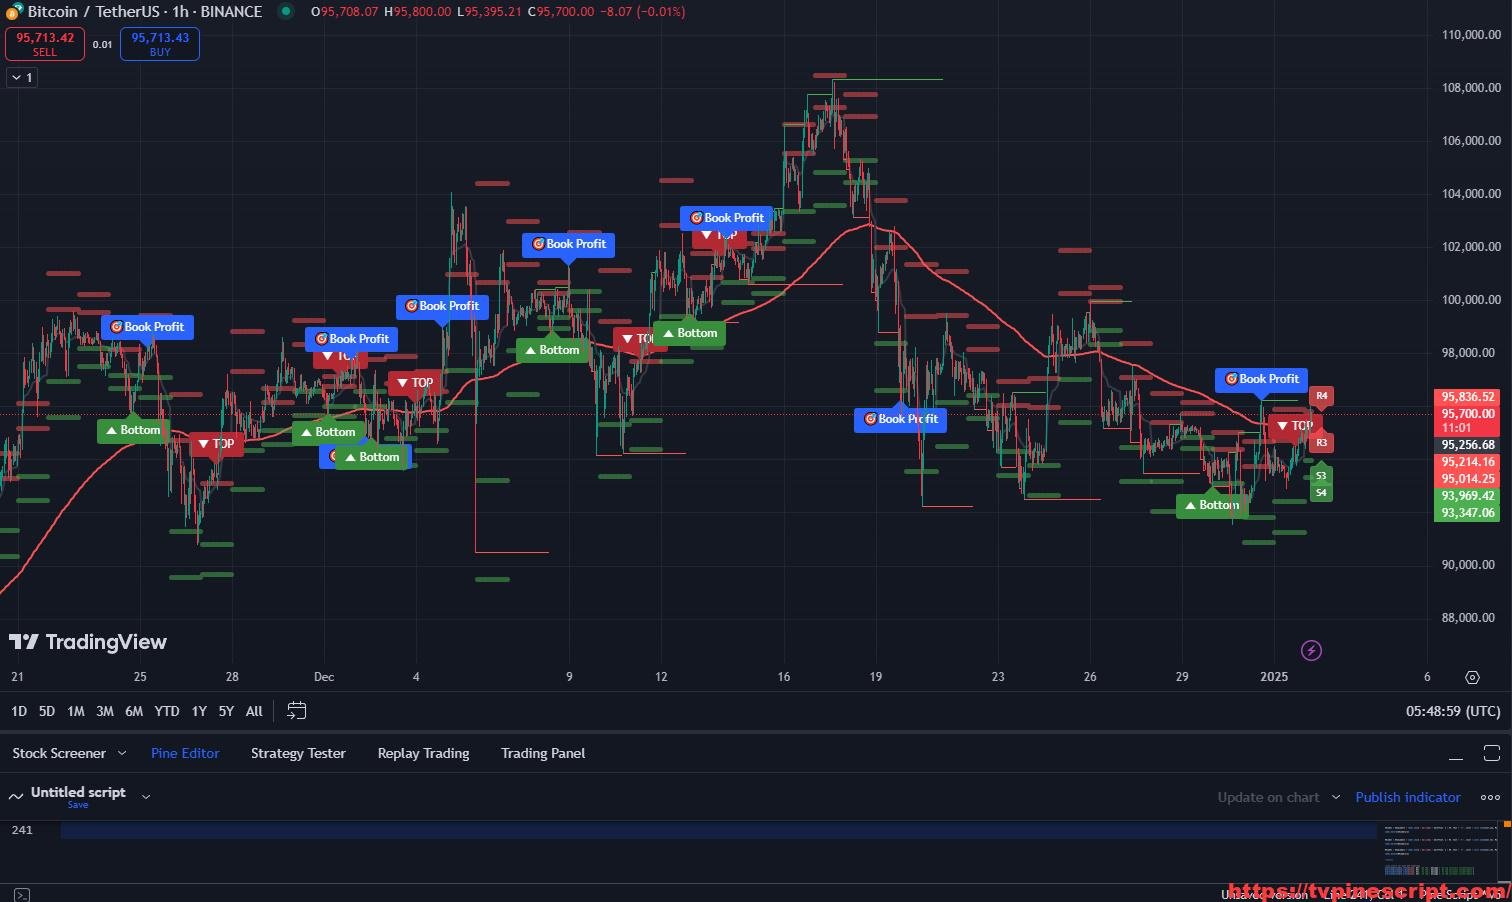
Super Setup v1.5 with Krypton Fear & Greed Filter: Advanced Trading Strategy Tool
January 3, 2025 | by admin
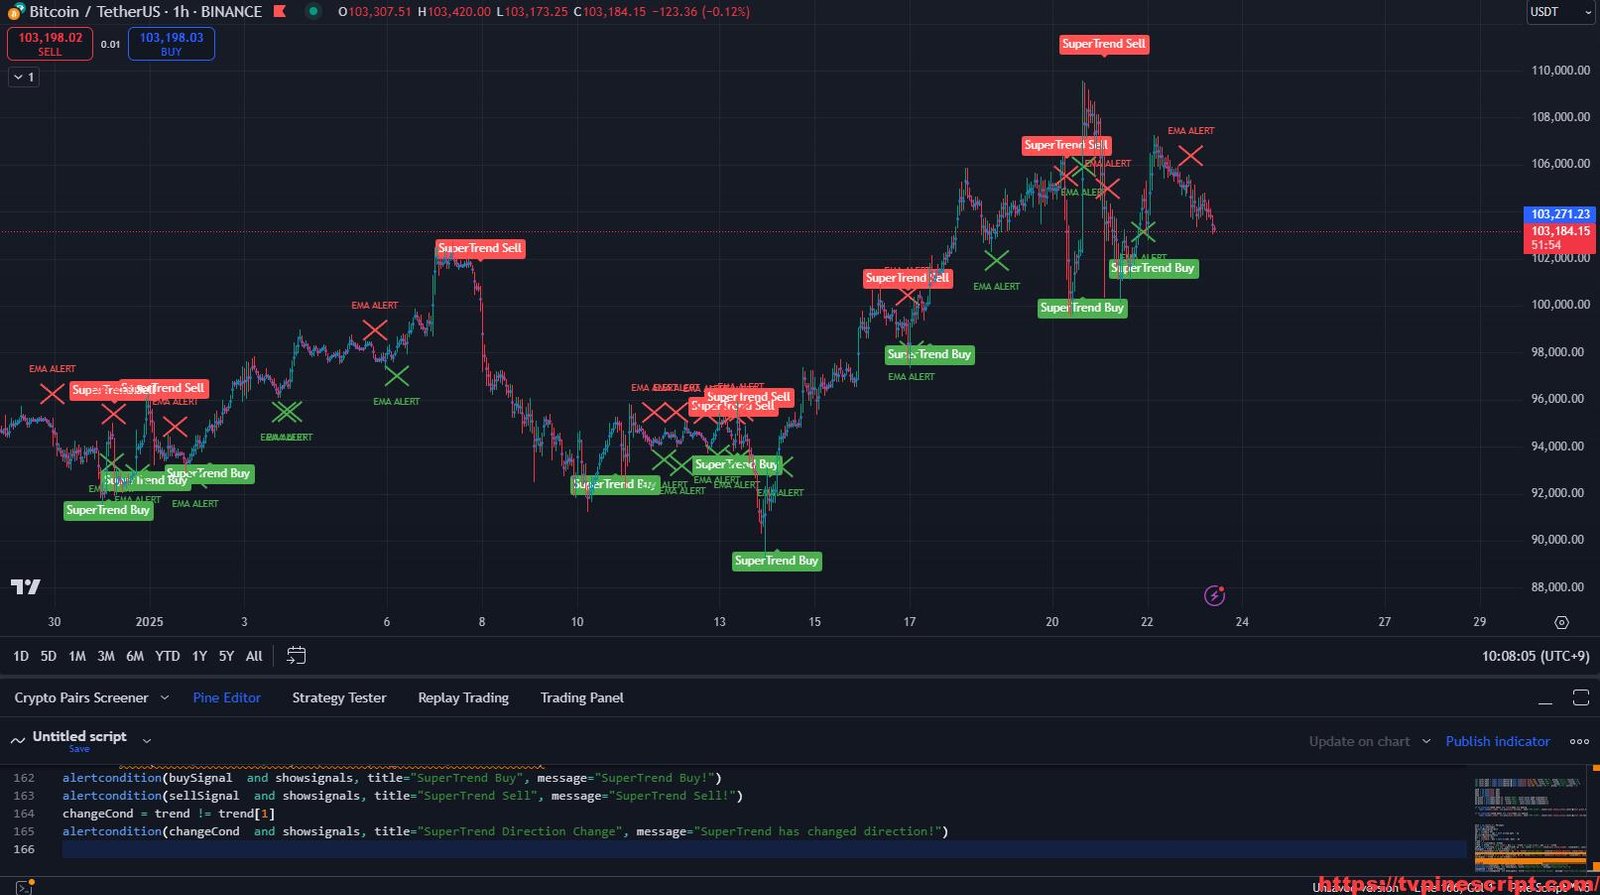
RSI ALGO + EMA + SuperTrend: A Powerful Trading Indicator for Precision Entries
January 23, 2025 | by admin