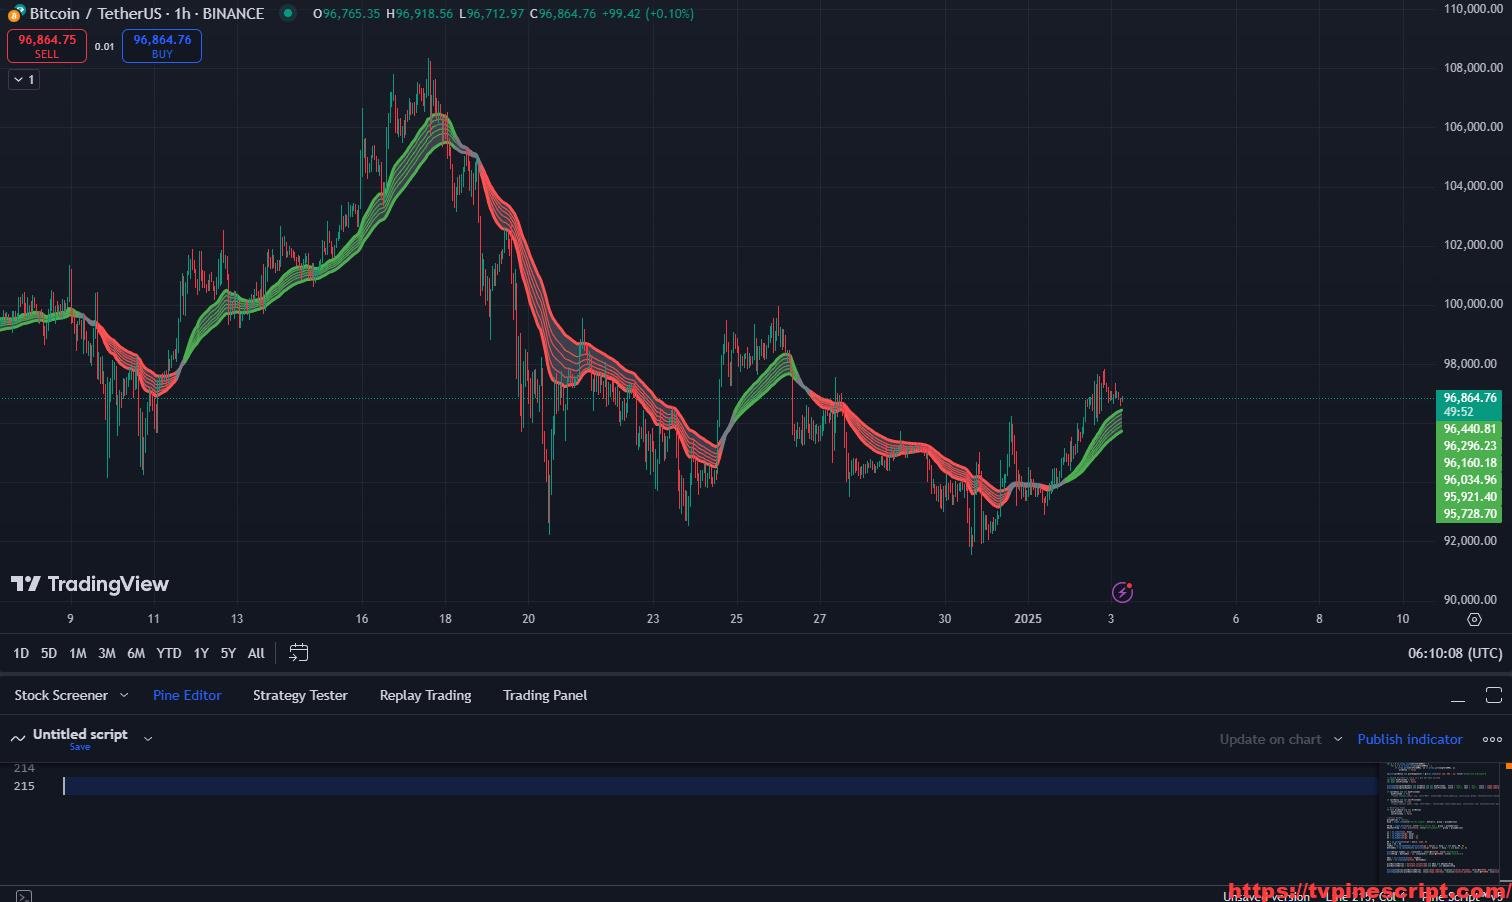
MADAlgo Guppy Ver 2: Dynamic EMA Visualization and Smart Signal Detection for Precision Trading
January 3, 2025 | by admin
Key Features of the Script:
- Guppy Multiple Moving Averages (GMMA):
- Includes fast and slow EMAs with customizable periods (e.g., 3, 5, 8, 30, 60).
- Visualizes moving averages with distinct color coding based on directional trends.
- Dynamic Guppy Coloring:
- Tracks short-term and long-term EMAs to indicate bullish or bearish trends.
- Provides gradient-based background coloring to highlight market conditions such as convergence or divergence of EMAs.
- 200 EMA and Directional Signal Support:
- Plots the 200 EMA as a long-term trend indicator.
- Integrates clear “Buy” and “Sell” directional signals based on Guppy and trend dynamics.
- Darvas Box Integration:
- Identifies breakout zones using the Darvas Box strategy.
- Highlights key support and resistance levels dynamically, marking potential breakout points.
- Risk and Trend Management Tools:
- Differentiates strong and weak trends by assessing the alignment of multiple EMAs.
- Provides buy/sell labels with optional flags to mark confirmed trends visually.
- Customizable Visualization:
- Offers flexibility to toggle individual EMAs, Guppy colors, and directional labels.
- Includes optional labels and boxes for a cleaner chart layout.
Recommended Usage:
- Trend-Following Strategies:
- Use GMMA to identify the strength and direction of long-term trends.
- Combine with directional signals to confirm trade entries.
- Breakout Trading:
- Leverage the Darvas Box for support and resistance levels.
- Monitor breakout signals for high-probability entry points.
- Scalping and Intraday Trading:
- Utilize fast EMAs and directional coloring to gauge short-term price movements.
- Apply buy/sell signals with 200 EMA for trend confirmation.
- Swing Trading:
- Follow slow EMAs and dynamic background colors for broader market analysis.
- Use Darvas Boxes for target setting and stop-loss placements.
Script Evaluation:
- Functionality: 4.7/5
The script effectively integrates GMMA and Darvas Box strategies, making it versatile for multiple trading styles. - Ease of Use: 4.3/5
While feature-rich, the settings might overwhelm new traders. Documentation could improve clarity for users unfamiliar with advanced features. - Accuracy: 4.6/5
Signals and trend coloring provide reliable insights when used with appropriate configurations. - Repainting Analysis:
This script does not repaint. All calculations are based on confirmed bar data and do not alter historical results, ensuring consistent reliability for real-time and backtesting scenarios. - Author and Development Quality:
The author is not explicitly named in the script. The code demonstrates thoughtful integration of technical concepts but could benefit from streamlined logic and better modularity to enhance performance on high-activity charts. - Overall Score: 4.6/5
A robust and dynamic tool for traders seeking advanced EMA-based analysis and breakout detection. Suitable for intermediate and advanced users, with room for improvement in accessibility.
//@version=5

indicator(title="MADAlgo_Guppy Indicator", shorttitle="MADAlgo_GAMA", overlay=true)
src = input(close, title="Source")

groupGuppy = "GuppyData"

plotFEMAs = input.bool(false, title="Plot Fast EMAs", group=groupGuppy)
plotSEMAs = input.bool(true, title="Plot Slow EMAs", group=groupGuppy)

plot200EMA = input.bool(false, title="Plot 200 EMA", group=groupGuppy)

plotGuppyColor = input.bool(false, title="Plot Guppy Color", group=groupGuppy)
originalBuySell = input.bool(false, title="Original Buy/Sellr", group=groupGuppy)
DBuySell = input.bool(false, title="Clear Direction Buy/Sell", group=groupGuppy)


// Guppy ema values
// 3, 5, 8, 10, 12, 15
// 30, 35, 40, 45, 50, 60

ema30 = ta.ema(src, 30)
ema35 = ta.ema(src, 35)
ema40 = ta.ema(src, 40)
ema45 = ta.ema(src, 45)
ema50 = ta.ema(src, 50)
ema60 = ta.ema(src, 60)

ema3 = ta.ema(src, 3)
ema5 = ta.ema(src, 5)
ema8 = ta.ema(src, 8)
ema10 = ta.ema(src, 10)
ema12 = ta.ema(src, 12)
ema15 = ta.ema(src, 15)

//Plotting 200 EMA
ema200 = ta.ema(src, 200)
plot(plot200EMA ? ema200 : na, title="EMA200", linewidth = 2)

//Push EMA data to Array
shortTermEMAs = array.new_float()
longTermEMAs = array.new_float()

array.push(shortTermEMAs, ema3)
array.push(shortTermEMAs, ema5)
array.push(shortTermEMAs, ema8)
array.push(shortTermEMAs, ema10)
array.push(shortTermEMAs, ema12)
array.push(shortTermEMAs, ema15)

array.push(longTermEMAs, ema30)
array.push(longTermEMAs, ema35)
array.push(longTermEMAs, ema40)
array.push(longTermEMAs, ema45)
array.push(longTermEMAs, ema50)
array.push(longTermEMAs, ema60)


//Check Color condition

// Loop through the array to check the condition
slowColorLongFlag = true
for i = 1 to array.size(longTermEMAs) - 1
    if array.get(longTermEMAs, i - 1) < array.get(longTermEMAs, i)
        slowColorLongFlag := false
        break

slowColorShortFlag = true
for i = 1 to array.size(longTermEMAs) - 1
    if array.get(longTermEMAs, i - 1) > array.get(longTermEMAs, i)
        slowColorShortFlag := false
        break

fastColorLongFlag = true
for i = 1 to array.size(shortTermEMAs) - 1
    if array.get(shortTermEMAs, i - 1) > array.get(shortTermEMAs, i)
        fastColorLongFlag := false
        break

fastColorShortFlag = true
for i = 1 to array.size(shortTermEMAs) - 1
    if array.get(shortTermEMAs, i - 1) < array.get(shortTermEMAs, i)
        fastColorShortFlag := false
        break

slowColor = slowColorLongFlag  ? color.green : slowColorShortFlag ? color.red : color.gray
fastColor = fastColorLongFlag and slowColorLongFlag ? color.blue : fastColorShortFlag and slowColorShortFlag ? color.red : color.gray

//Check for sideways market
var bool sideways = false

if slowColorLongFlag and slowColorShortFlag
	sideways := true

// Variable to track if a buy has been printed
var bool buyPrinted = false
var bool sellPrinted = false

plotshape(DBuySell and slowColorLongFlag and not buyPrinted,  title = "Buy",  text = 'DB',  style = shape.labelup,   location = location.belowbar, color= #00DBFF, textcolor = #FFFFFF,  size = size.tiny)
plotshape(DBuySell and slowColorShortFlag and not sellPrinted, title = "Sell", text = 'DS', style = shape.labeldown, location = location.abovebar, color= #E91E63, textcolor = #FFFFFF,  size = size.tiny)

if (slowColorLongFlag and not buyPrinted)
    buyPrinted := true
    //label.new(bar_index, low, text="BUY", style=label.style_label_up, color=color.green, textcolor=color.white, size=size.normal)

if (slowColorShortFlag and not sellPrinted)
    sellPrinted := true
    //label.new(bar_index, high, text="SELL", style=label.style_label_down, color=color.red, textcolor=color.white, size=size.normal)

// Resetting flags
if (not slowColorLongFlag and not slowColorShortFlag)
    buyPrinted := false
	sellPrinted := false


plot30 = plot( ema30, title="EMA30",   color=slowColor, style=plot.style_line, linewidth = 3)
plot( ema35 , color=slowColor, title="EMA35", style=plot.style_line)
plot( ema40 , color=slowColor, title="EMA40", style=plot.style_line)
plot( ema45 , color=slowColor, title="EMA45", style=plot.style_line)
plot( ema50  , color=slowColor, title="EMA50", style=plot.style_line)
plot60  = plot( ema60 , color=slowColor, title="EMA60",  style=plot.style_line, linewidth = 3)

fill(plot30, plot60, color=color.new(color.gray, 60))

plot(plotFEMAs ? ema3: na, title="EMA3",   color=fastColor, linewidth = 2)
plot(plotFEMAs ? ema5 : na, color=fastColor, title="EMA5")
plot(plotFEMAs ? ema8 : na, color=fastColor, title="EMA8")
plot(plotFEMAs ? ema10 : na, color=fastColor, title="EMA10")
plot(plotFEMAs ? ema12 : na, color=fastColor, title="EMA12")
plot(plotFEMAs ? ema15 : na, title="EMA15",   color=fastColor, linewidth = 2)

// Function to check if all EMAs are one above the other or one below the other
isOrderedAbove = true
isOrderedBelow = true

for i = 0 to 4
    if array.get(longTermEMAs, i) >= array.get(longTermEMAs, i + 1)
        isOrderedAbove := false
    if array.get(longTermEMAs, i) <= array.get(longTermEMAs, i + 1)
        isOrderedBelow := false


// Highlight the background color based on the order of the EMAs
bgcolor(plotGuppyColor ? isOrderedAbove ? na : isOrderedBelow ? na : color.new(color.red, 60) : na , title="EMA Order Highlight")

// Check if all short-term EMAs are above all long-term EMAs
allAbove = true
for i = 0 to array.size(shortTermEMAs) - 1
    for j = 0 to array.size(longTermEMAs) - 1
        if array.get(shortTermEMAs, i) <= array.get(longTermEMAs, j)
            allAbove := false


// Plot a shape or text when the condition is true
bgcolor(allAbove and plotGuppyColor? color.new(color.green, 90) : na, title="Background Highlight")

// Check if all short-term EMAs are below all long-term EMAs
allBelow = true
for i = 0 to array.size(shortTermEMAs) - 1
    for j = 0 to array.size(longTermEMAs) - 1
        if array.get(shortTermEMAs, i) >= array.get(longTermEMAs, j)
            allBelow := false

bgcolor(allBelow and plotGuppyColor ? color.new(color.red, 90) : na, title="Background Highlight")

// Second Variable to track if a buy has been printed
var bool buyPrinted2 = false
var bool sellPrinted2 = false

plotshape(originalBuySell and allAbove and not buyPrinted2,  title = "Buy",  text = 'Buy',  style = shape.labelup,   location = location.belowbar, color= #00DBFF, textcolor = #FFFFFF, size = size.tiny)
plotshape(originalBuySell and allBelow and not sellPrinted2, title = "Sell", text = 'Sell', style = shape.labeldown, location = location.abovebar, color= #E91E63, textcolor = #FFFFFF, size = size.tiny)

if (allAbove and not buyPrinted2)
    buyPrinted2 := true
    //label.new(bar_index, low, text="BUY", style=label.style_label_up, color=color.green, textcolor=color.white, size=size.normal)

if (allBelow and not sellPrinted2)
    sellPrinted2 := true
    //label.new(bar_index, high, text="SELL", style=label.style_label_down, color=color.red, textcolor=color.white, size=size.normal)

// Resetting flags
if (not allAbove and not allBelow)
    buyPrinted2 := false
	sellPrinted2 := false

//Darvas BuySELL
groupDarvas = "Darvas"
boxp = input.int(title="Darvas Length", defval=5, group = groupDarvas)

dFlag = input.bool(false, title="Plot Darvas Box", group = groupDarvas)
dBuySellFlag = input.bool(false, title="DarvasBuySell", group = groupDarvas)

LL = ta.lowest(low, boxp)
k1 = ta.highest(high, boxp)
k2 = ta.highest(high, boxp - 1)
k3 = ta.highest(high, boxp - 2)

NH = ta.valuewhen(high > k1[1], high, 0)
box1 = k3 < k2
TopBox = ta.valuewhen(ta.barssince(high > k1[1]) == boxp - 2 and box1, NH, 0)
BottomBox = ta.valuewhen(ta.barssince(high > k1[1]) == boxp - 2 and box1, LL, 0)

plot(dFlag? TopBox: na, linewidth=2, color=#4CAF50, title="UpperBand")
plot(dFlag ? BottomBox : na, linewidth=2, color=#FF0000, title="LowerBand")

dBuy = ta.crossover(close, TopBox)
dSell = ta.crossunder(close, BottomBox)

plotBullishDarvas = barstate.isconfirmed and dBuy and dBuySellFlag
plotBearishDarvas = barstate.isconfirmed and dSell  and dBuySellFlag

plotshape(series=plotBullishDarvas, style=shape.labelup, location=location.belowbar, color=#4CAF50, size=size.normal, title="Buy Signal", text="Buy", textcolor=color.black)
plotshape(series=plotBearishDarvas, style=shape.labeldown, location=location.abovebar, color=#FF0000, size=size.normal, title="Sell Signal", text="Sell", textcolor=color.white)
How to Apply Pine Script in TradingView:
- Open TradingView and log in.
- Navigate to the Pine Script Editor at the bottom of the screen.
- Copy the provided Pine Script code.
- Paste it into the editor and click Save.
- Name the script, e.g., “MADAlgo Guppy Ver 2.”
- Click Add to Chart to apply the script.
- Customize settings to align with your trading preferences via the indicator panel.
Final Verdict:
The MADAlgo Guppy Ver 2 script delivers a comprehensive EMA-based trend and breakout detection strategy. Its non-repainting nature ensures reliable outputs, while its integration of Darvas Boxes enhances versatility. Although its advanced features might challenge beginners, seasoned traders will find it a valuable addition to their toolkit. Further refinement in usability and performance could elevate its utility even more.
RELATED POSTS
View all
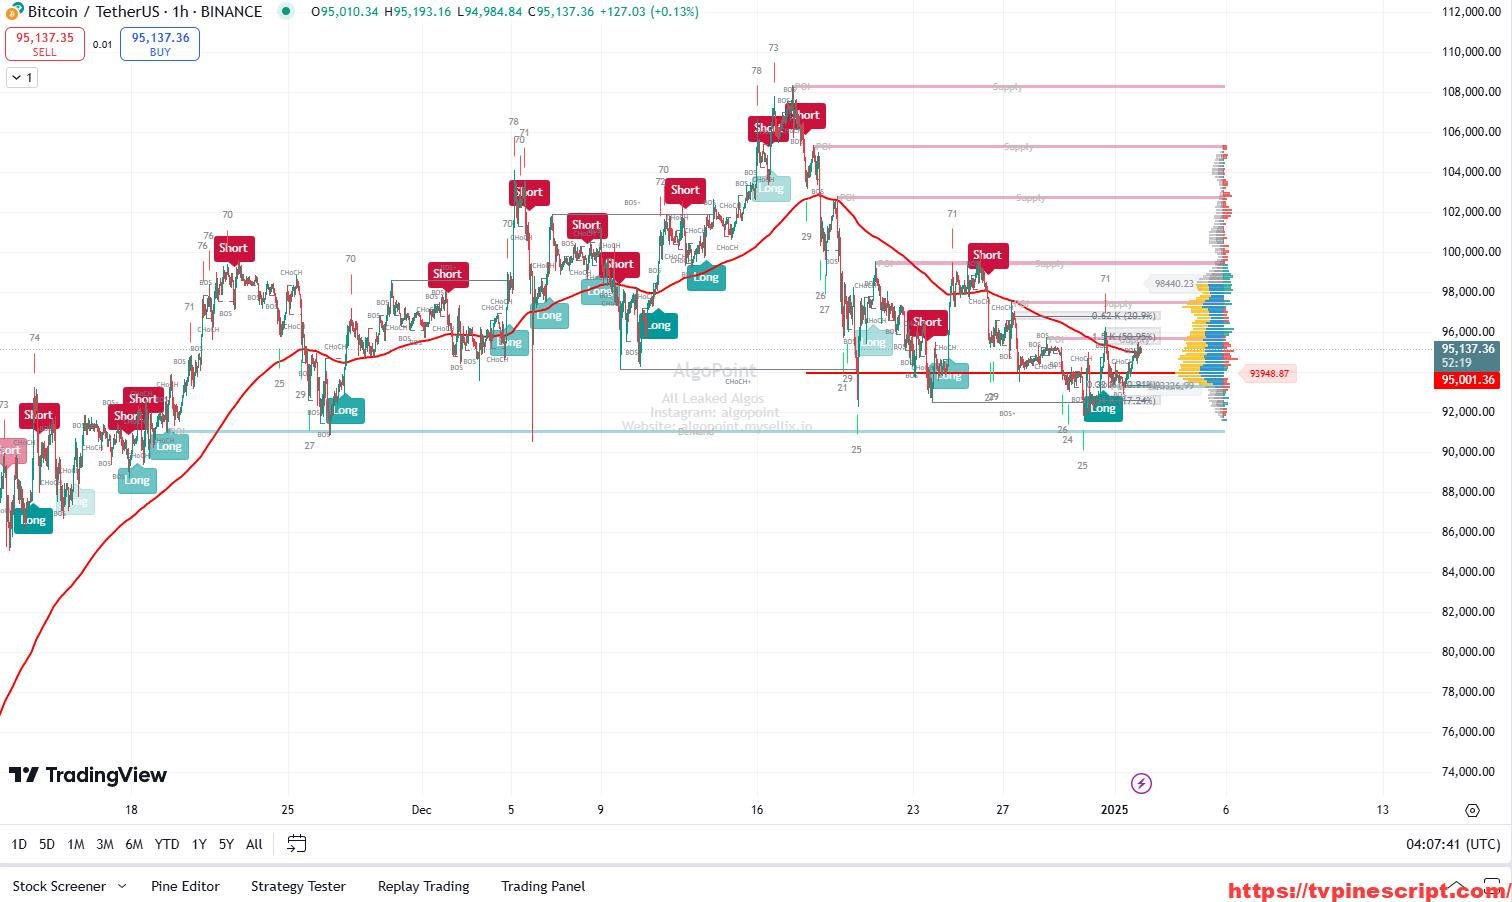
Consolidate Your Trading Analysis with the Ultimate All-in-One AlgoPoint Script
January 3, 2025 | by admin
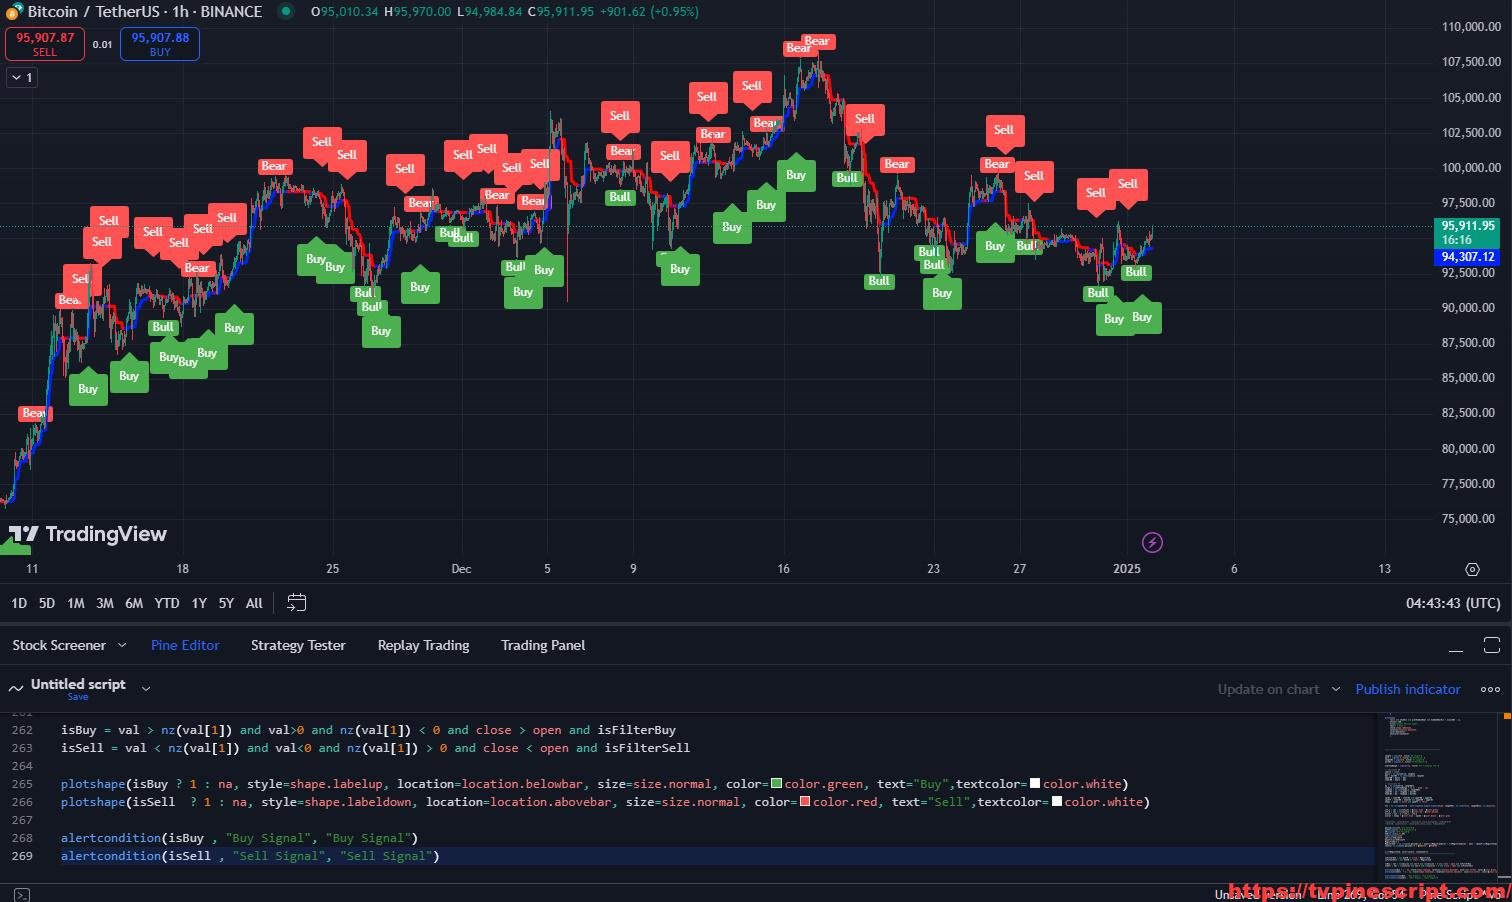
Algo Sambu: A Comprehensive Indicator for Multi-Faceted Trading Analysis
January 3, 2025 | by admin
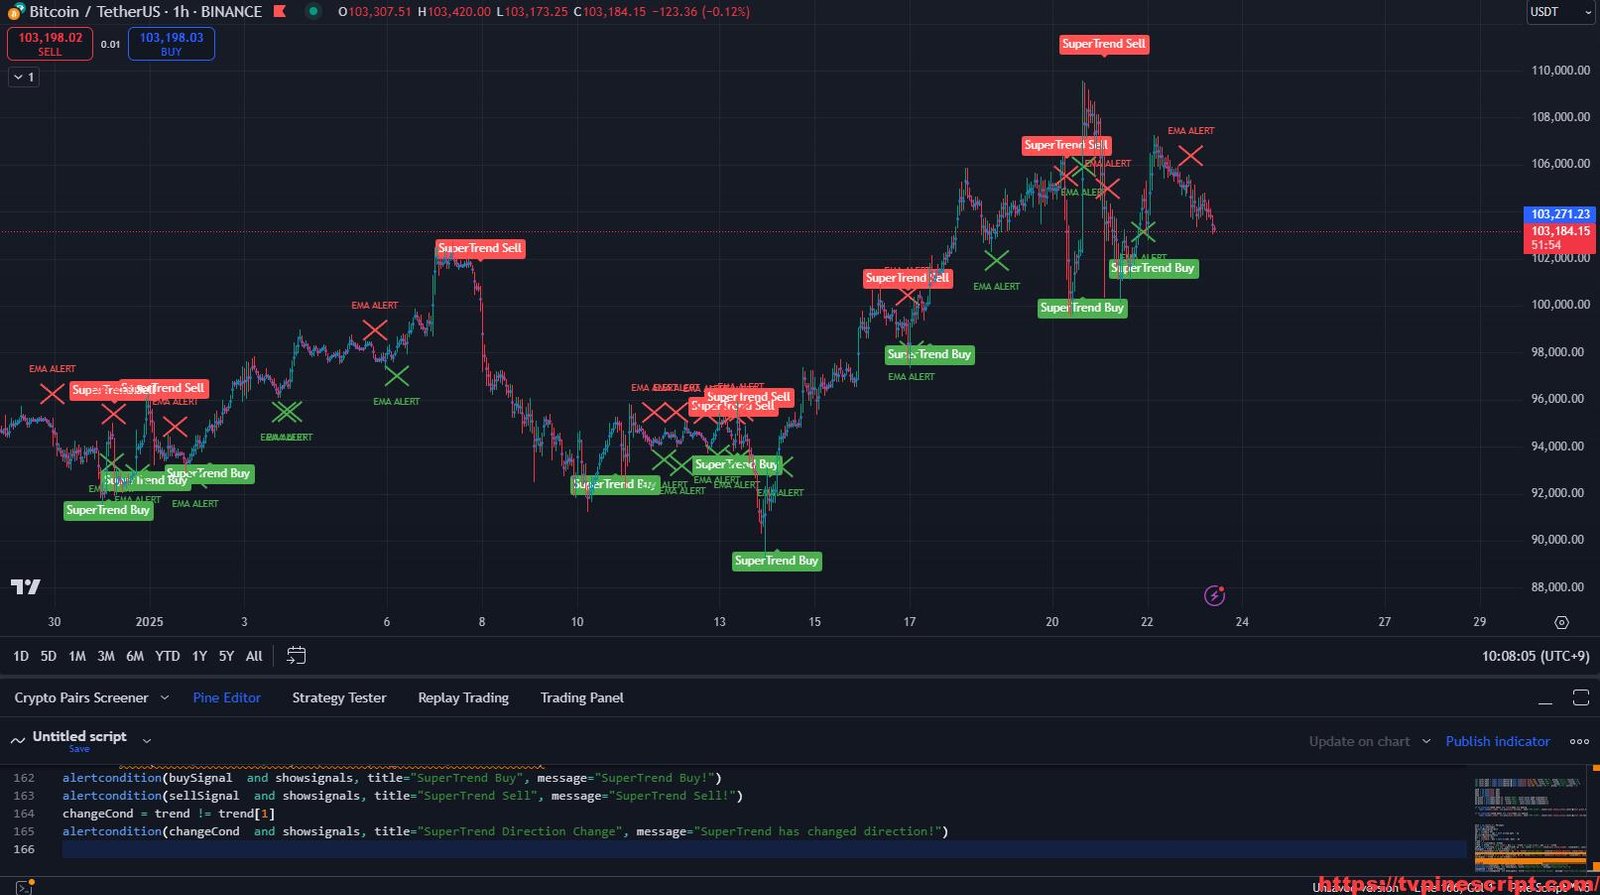
RSI ALGO + EMA + SuperTrend: A Powerful Trading Indicator for Precision Entries
January 23, 2025 | by admin