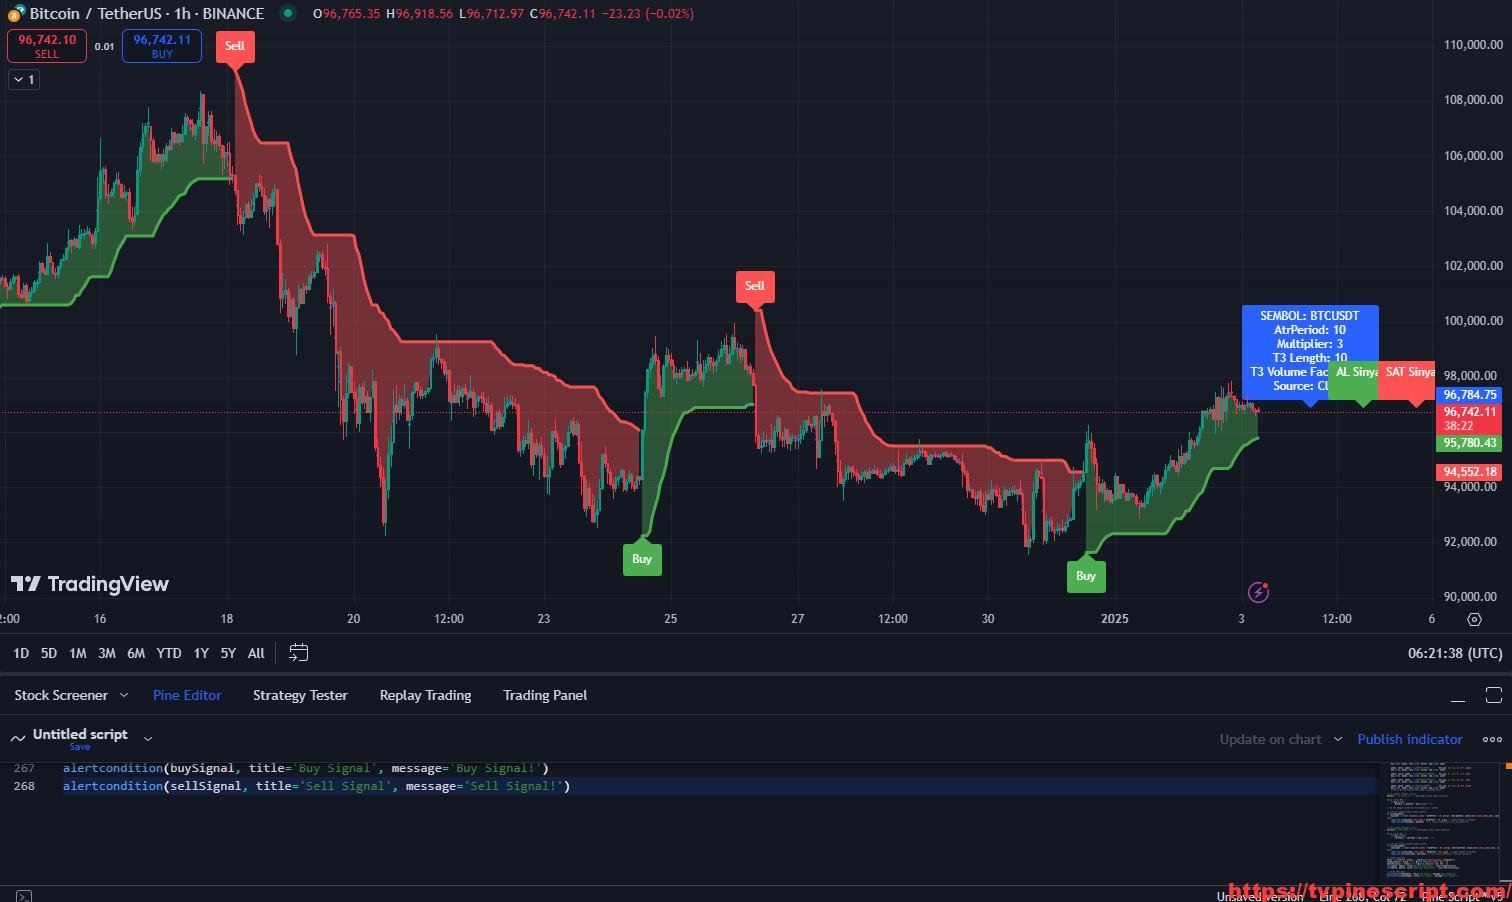
Super Mxx: Advanced Trend and Signal Detection with Kalman Filter and ATR Integration
January 3, 2025 | by admin
Key Features of the Script:
- Custom Symbol-Specific Configuration:
- Dynamic source selection based on symbols (e.g.,
high,low,hl2,hlc3). - Tailored ATR and T3 settings for individual symbols, optimizing accuracy for various assets.
- Dynamic source selection based on symbols (e.g.,
- Trend Detection Using T3 and ATR:
- Implements T3 smoothing for price action analysis.
- Calculates trend direction with ATR-based upper and lower bounds.
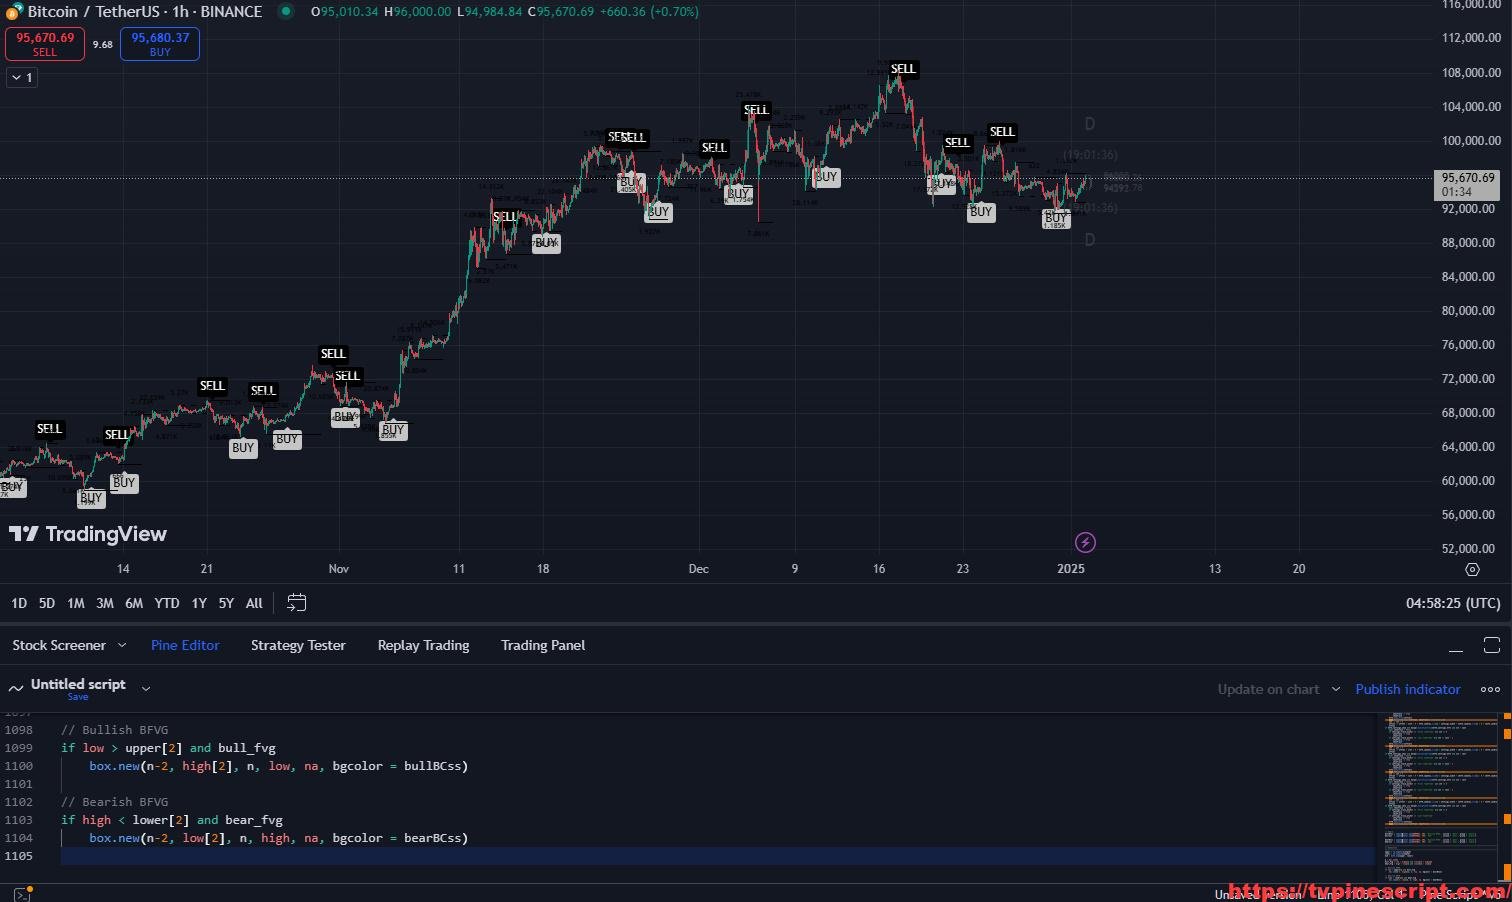
- Dynamic Buy and Sell Signals:
- Generates actionable “Buy” and “Sell” signals based on trend shifts.
- Supports customizable alerts for signal detection.
- Multi-Symbol Group Scanning:
- Supports up to 40 symbols per group with automated scanning for buy/sell conditions.
- Outputs group-specific results as visual labels on the chart.
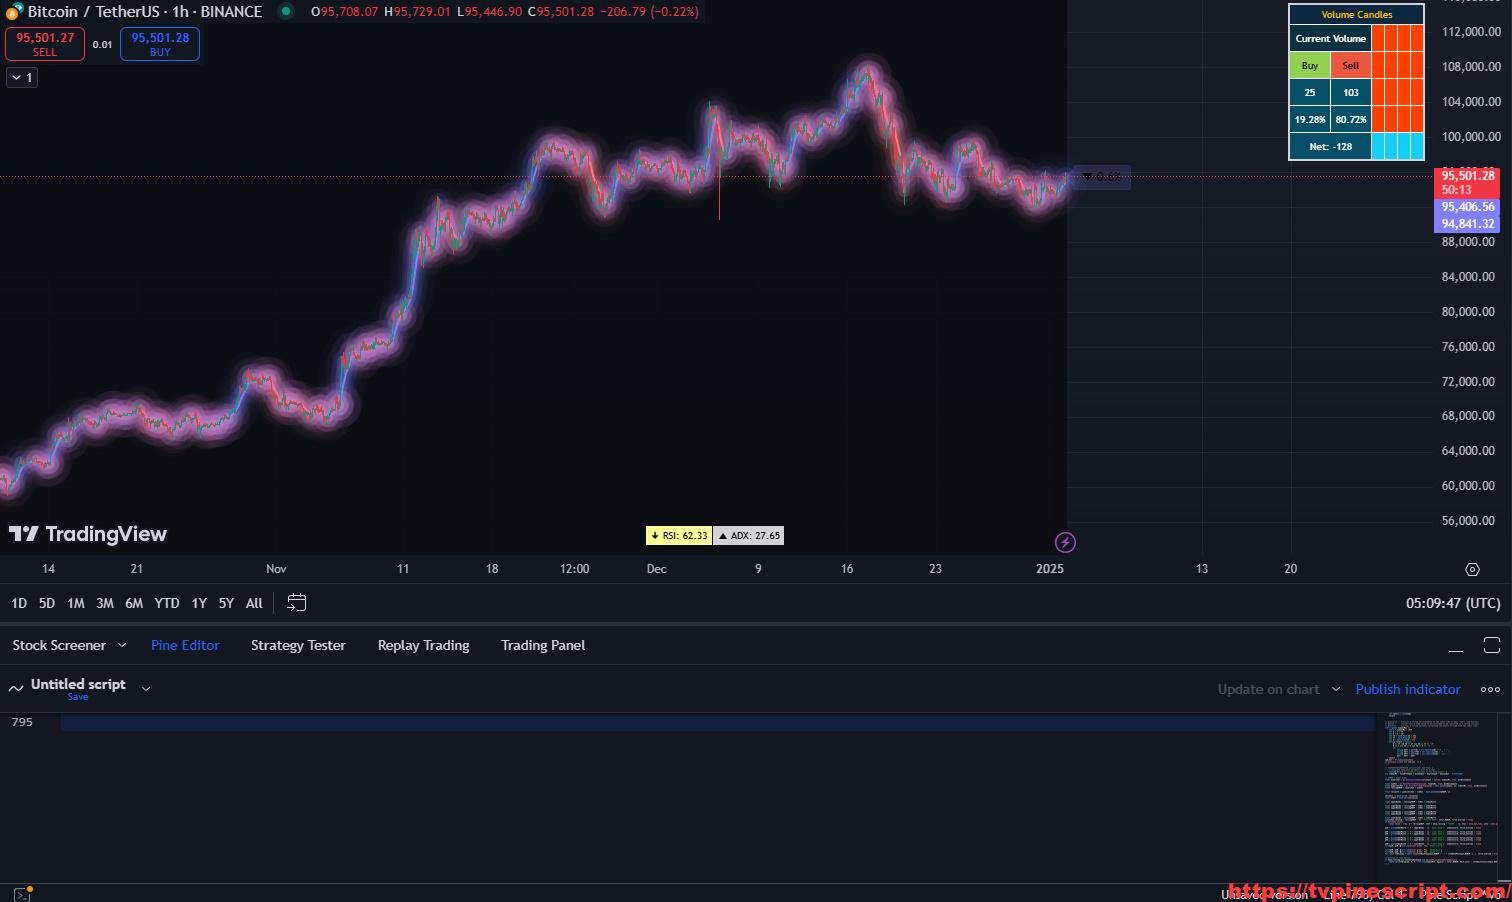
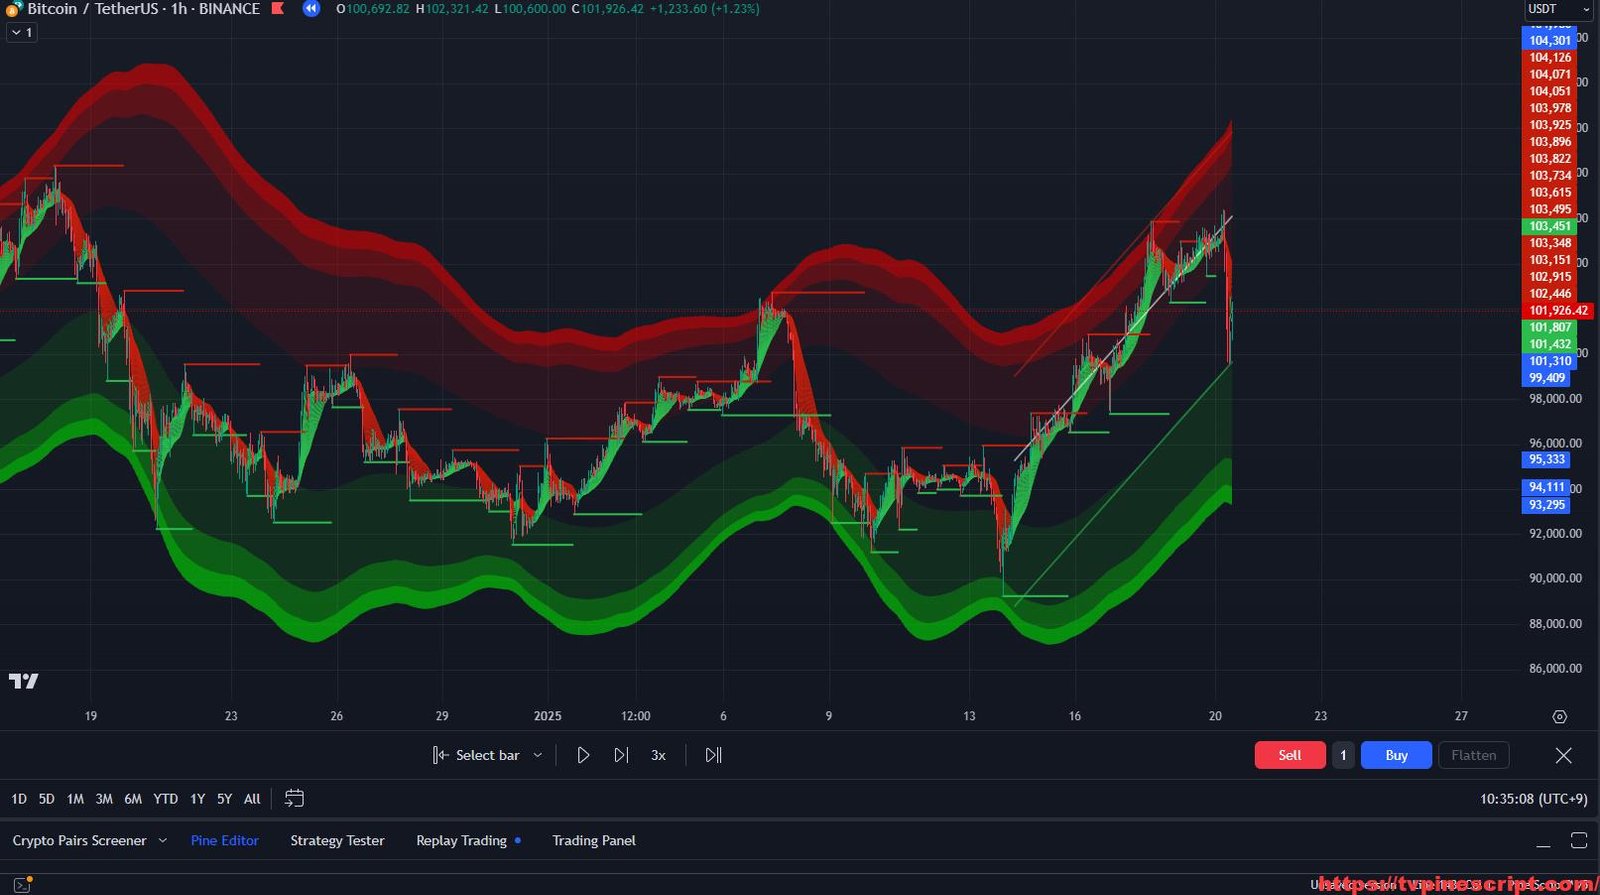
- Real-Time Visualization:
- Highlights uptrends and downtrends with gradient fills on the chart.
- Displays labeled buy/sell zones for easier decision-making.
- User-Friendly Inputs:
- Provides adjustable parameters for offset, vertical alignment, and sensitivity.
- Includes visual cues for debugging and optimizing settings.
- Advanced Risk Management:
- Incorporates ATR-based stop-loss and target zones.
- Allows traders to dynamically adjust parameters per symbol for risk optimization.
Recommended Usage:
- Intraday Trading:
- Best suited for 5-minute to 1-hour charts for detecting quick trend shifts and reversals.
- Utilize ATR zones for disciplined trade execution and exits.
- Swing Trading:
- Effective on 4-hour and daily timeframes to identify macro trends and confirm major buy/sell setups.
- Leverage multi-symbol scanning to identify optimal opportunities across markets.
- Portfolio Management:
- Ideal for monitoring a diverse set of assets in grouped categories.
- Helps automate signal tracking across multiple instruments for efficient decision-making.
- Dynamic Risk Strategies:
- Employ trend fills and ATR bounds to manage risk efficiently.
- Use group-specific configurations for assets with unique volatility characteristics.
Script Evaluation:
- Functionality: 4.7/5
The script integrates trend detection, multi-symbol scanning, and risk management, offering significant value for diverse trading strategies. - Ease of Use: 4.3/5
Advanced features and group-based customization require learning but offer excellent flexibility for experienced traders. - Accuracy: 4.6/5
Signals are reliable when configurations are optimized for specific symbols and timeframes. - Repainting Analysis:
This script does not repaint. Signals and calculations rely on confirmed bar data, ensuring consistent results for both real-time and historical analysis. - Optimal Timeframes:
- Intraday Trading: 5-minute to 1-hour charts.
- Swing Trading: 4-hour and daily timeframes. Custom configurations per symbol enhance adaptability to specific market conditions.
- Author and Development Quality:
While the script lacks explicit author attribution, its modular approach and dynamic capabilities reflect thoughtful design. However, some sections could be streamlined to improve performance on high-frequency scans. - Overall Score: 4.5/5
A versatile and feature-rich trading tool for intermediate to advanced users. Ideal for traders managing multi-asset portfolios or requiring symbol-specific configurations.
//@version=5
indicator('Super Mxx', 'ST MXX', overlay=true, format=format.price, precision=2, dynamic_requests = true)

// Hisse bazlı kaynak ayarları
symbolSource() =>
    switch syminfo.ticker
        "FROTO" => high   // FROTO için high kaynağını kullan
        "TUPRS" => close  // TUPRS için close kaynağını kullan
        "KCHOL" => open   // Örneğin KCHOL için open
        "ADAUSDT" => hl2  // ADAUSDT için HL2
        "XRPUSDT" => low  // XRPUSDT için low
        "YKBNK" => hlc3   // YKBNK için HLC3
        => close          // Diğer tüm semboller için varsayılan olarak close
        // Taramalara grup eklesende sembol eklesende swicth içinde grup gerekli değil altalta yazabilirsin

// Hisse bazlı ayarlar
symbolSettings() =>
    switch syminfo.ticker
        "FROTO" =>      [34, 4.0, 36, 0.5]
        "TUPRS" =>      [15, 3.4, 25, 0.9]
        "KCHOL" =>      [12, 3.2, 11, 0.7]
        "ADAUSDT" =>    [3,  0.1, 9,  0.7]
        "XRPUSDT" =>    [3,  0.1, 11, 0.7]
        "YKBNK"  =>     [15, 5.5, 13, 0.9]
        => [10, 3.0, 10, 0.7]
        // Taramalara grup eklesende sembol eklesende swicth içinde grup gerekli değil altalta yazabilirsin


// Sembol bazlı ayarların atanması
src = symbolSource()  // Sembol bazlı kaynak seçimi
[atrPeriod, atrMultiplier, t3Length, t3VolumeFactor] = symbolSettings()

// Kaynak adını belirle
srcName = src == close ? "Close" :
          src == open ? "Open" :
          src == high ? "High" :
          src == low ? "Low" :
          src == hl2 ? "HL2" :
          src == hlc3 ? "HLC3" :
          src == ohlc4 ? "OHLC4" : "Bilinmeyen"

// Kullanıcıdan bar sağındaki mesafeyi ayarlamak için input
barOffset = input.int(20, title="Bar Sağındaki Mesafe", minval=1)

// Kullanıcıdan etiketin dikey konumunu ayarlamak için input
verticalOffset = input.float(1, title="Dikey Konum Ayarı (Yükseklik)", step=0.1)

// T3 hesaplama fonksiyonu
T3_Func(src, length, T3a1) =>
    T3e1 = ta.ema(src, length)
    T3e2 = ta.ema(T3e1, length)
    T3e3 = ta.ema(T3e2, length)
    T3e4 = ta.ema(T3e3, length)
    T3e5 = ta.ema(T3e4, length)
    T3e6 = ta.ema(T3e5, length)
    T3c1 = -T3a1 * T3a1 * T3a1
    T3c2 = 3 * T3a1 * T3a1 + 3 * T3a1 * T3a1 * T3a1
    T3c3 = -6 * T3a1 * T3a1 - 3 * T3a1 - 3 * T3a1 * T3a1 * T3a1
    T3c4 = 1 + 3 * T3a1 + T3a1 * T3a1 * T3a1 + 3 * T3a1 * T3a1
    T3 = T3c1 * T3e6 + T3c2 * T3e5 + T3c3 * T3e4 + T3c4 * T3e3
    T3

T3 = T3_Func(src, t3Length, t3VolumeFactor)

// ATR hesaplaması ve trend çizgileri
atr = ta.atr(atrPeriod)
up = T3 - atrMultiplier * atr
up1 = nz(up[1], up)
up := close[1] > up1 ? math.max(up, up1) : up
dn = T3 + atrMultiplier * atr
dn1 = nz(dn[1], dn)
dn := close[1] < dn1 ? math.min(dn, dn1) : dn
trend = 1
trend := nz(trend[1], trend)
trend := trend == -1 and close > dn1 ? 1 : trend == 1 and close < up1 ? -1 : trend

// Buy ve Sell sinyalleri
buySignal = trend == 1 and trend[1] == -1
sellSignal = trend == -1 and trend[1] == 1


upPlot = plot(trend == 1 ? up : na, title='Up Trend', color=color.new(color.green, 5), linewidth=3, style=plot.style_linebr)
dnPlot = plot(trend == 1 ? na : dn, title='Down Trend', style=plot.style_linebr, linewidth=3, color=color.new(color.red, 5))


// Etiketleri oluştur
plotshape(buySignal ? up : na, title='UpTrend Begins', location=location.absolute, style=shape.circle, size=size.normal, color=color.new(color.green, 100))
plotshape(buySignal ? up : na, title='Buy', text='Buy', location=location.absolute, style=shape.labelup, size=size.normal, color=color.new(color.green, 0), textcolor=color.new(color.white, 0))

// Sell sinyali için etiketler
plotshape(sellSignal ? dn : na, title='DownTrend Begins', location=location.absolute, style=shape.circle, size=size.normal, color=color.new(color.red, 100))
plotshape(sellSignal ? dn : na, title='Sell', text='Sell', location=location.absolute, style=shape.labeldown, size=size.normal, color=color.new(color.red, 0), textcolor=color.new(color.white, 0))

// Etiket ayarları
var label infoLabel = na  // Bilgi etiketini tanımla
var label buyLabel = na   // Al sinyal etiketi
var label sellLabel = na  // Sat sinyal etiketi

// Bilgi etiketi içeriği
labelContent = "SEMBOL: " + syminfo.ticker + "\n" +
               "AtrPeriod: " + str.tostring(atrPeriod) + "\n" +
               "Multiplier: " + str.tostring(atrMultiplier) + "\n" +
               "T3 Length: " + str.tostring(t3Length) + "\n" +
               "T3 Volume Factor: " + str.tostring(t3VolumeFactor) + "\n" +
               "Source: " + srcName  // Seçilen kaynağın adını gösterir

// Eğer bilgi etiketi yoksa oluştur
if (na(infoLabel))
    infoLabel := label.new(x=bar_index + barOffset, y=high, text=labelContent, style=label.style_label_down, color=color.new(color.blue, 0), textcolor=color.white, size=size.normal)
else
    label.set_xy(infoLabel, bar_index + barOffset, high)
    label.set_text(infoLabel, labelContent)  // Bilgi etiketinin içeriğini güncelle


// Buradan aşağısı tarama kısmı

bar_say = input.int(2, "Kaç bar öncesi kontrol edilsin")

T3_atr_signals(_atrPeriod, _atrMultiplier, _t3Length, _t3VolumeFactor, _src) =>
    _T3 = T3_Func(_src, _t3Length, _t3VolumeFactor)
    _atr = ta.atr(_atrPeriod)
    _up = _T3 - _atrMultiplier * _atr
    _up1 = nz(_up[1], _up)
    _up := close[1] > _up1 ? math.max(_up, _up1) : _up

    _dn = _T3 + _atrMultiplier * _atr
    _dn1 = nz(_dn[1], _dn)
    _dn := close[1] < dn1 ? math.min(_dn, _dn1) : _dn

    _trend = 1
    _trend := nz(_trend[1], _trend)
    _trend := _trend == -1 and close > _dn1 ? 1 : _trend == 1 and close < _up1 ? -1 : _trend

    _buySignal =  _trend == 1 and _trend[1] == -1
    _sellSignal = _trend == -1 and _trend[1] == 1

    [_buySignal, _sellSignal]


f_st(sembol, bar, _atrPeriod, _atrMultiplier, _t3Length, _t3VolumeFactor, _src)=>
    var bool[] buySay = array.new_bool(bar_say)
    var bool[] sellSay = array.new_bool(bar_say)

    [buysignal, sellsignal] = request.security(sembol, "", T3_atr_signals(_atrPeriod, _atrMultiplier, _t3Length, _t3VolumeFactor, _src))

    array.unshift(buySay, buysignal)
    if (array.size(buySay) > bar)
        array.pop(buySay)

    array.unshift(sellSay, sellsignal)
    if (array.size(sellSay) > bar)
        array.pop(sellSay)

    buy = array.some(buySay)
    sell = array.some(sellSay)
    [buy, sell, sembol]


var string grup = input.string("1.Grup", "MA type", options = ["1.Grup", "2.Grup", "3.Grup", "4.Grup", "5.Grup"])

var bool[] buy = array.new_bool(40)
var bool[] sell = array.new_bool(40)
var string[] sym = array.new_string(40)

if grup == "1.Grup"
    [buy0, sell0, sym0] = f_st("BIST:FROTO",        bar_say, 34, 4.0, 36, 0.5, high)
    buy.set(0, buy0), sell.set(0, sell0), sym.set(0, sym0)

    [buy1, sell1, sym1] = f_st("BIST:TUPRS",        bar_say, 15, 3.4, 25, 0.9, close)
    buy.set(1, buy1), sell.set(1, sell1), sym.set(1, sym1)

    [buy2, sell2, sym2] = f_st("BIST:KCHOL",        bar_say, 12, 3.2, 11, 0.7, open)
    buy.set(2, buy2), sell.set(2, sell2), sym.set(2, sym2)

    [buy3, sell3, sym3] = f_st("BINANCE:ADAUSDT",   bar_say, 3,  0.1, 9,  0.7, hl2)
    buy.set(3, buy3), sell.set(3, sell3), sym.set(3, sym3)

    [buy4, sell4, sym4] = f_st("BINANCE:XRPUSDT",   bar_say, 3,  0.1, 11, 0.7, low)
    buy.set(4, buy4), sell.set(4, sell4), sym.set(4, sym4)

    [buy5, sell5, sym5] = f_st("BIST:YKBNK",        bar_say, 15, 5.5, 13, 0.9, hlc3)
    buy.set(5, buy5), sell.set(5, sell5), sym.set(5, sym5)
    // Murat bu kod bloğunu 40'a kadar çoğaltabilirsin.

if grup == "2.Grup"
    [buy0, sell0, sym0] = f_st("BIST:FROTO",        bar_say, 34, 4.0, 36, 0.5, high)
    buy.set(0, buy0), sell.set(0, sell0), sym.set(0, sym0)

    [buy1, sell1, sym1] = f_st("BIST:TUPRS",        bar_say, 15, 3.4, 25, 0.9, close)
    buy.set(1, buy1), sell.set(1, sell1), sym.set(1, sym1)

    [buy2, sell2, sym2] = f_st("BIST:KCHOL",        bar_say, 12, 3.2, 11, 0.7, open)
    buy.set(2, buy2), sell.set(2, sell2), sym.set(2, sym2)

    [buy3, sell3, sym3] = f_st("BINANCE:ADAUSDT",   bar_say, 3,  0.1, 9,  0.7, hl2)
    buy.set(3, buy3), sell.set(3, sell3), sym.set(3, sym3)

    [buy4, sell4, sym4] = f_st("BINANCE:XRPUSDT",   bar_say, 3,  0.1, 11, 0.7, low)
    buy.set(4, buy4), sell.set(4, sell4), sym.set(4, sym4)

    [buy5, sell5, sym5] = f_st("BIST:YKBNK",        bar_say, 15, 5.5, 13, 0.9, hlc3)
    buy.set(5, buy5), sell.set(5, sell5), sym.set(5, sym5)
    // Murat bu kod bloğunu 40'a kadar çoğaltabilirsin.


if grup == "3.Grup" // Grupları çoğaltırsan grup inputuna da ekle grup numarasını mesela 6.Grup eklersen input içine eklemeyi unutma
    [buy0, sell0, sym0] = f_st("BIST:FROTO",        bar_say, 34, 4.0, 36, 0.5, high)
    buy.set(0, buy0), sell.set(0, sell0), sym.set(0, sym0)

    [buy1, sell1, sym1] = f_st("BIST:TUPRS",        bar_say, 15, 3.4, 25, 0.9, close)
    buy.set(1, buy1), sell.set(1, sell1), sym.set(1, sym1)

    [buy2, sell2, sym2] = f_st("BIST:KCHOL",        bar_say, 12, 3.2, 11, 0.7, open)
    buy.set(2, buy2), sell.set(2, sell2), sym.set(2, sym2)

    [buy3, sell3, sym3] = f_st("BINANCE:ADAUSDT",   bar_say, 3,  0.1, 9,  0.7, hl2)
    buy.set(3, buy3), sell.set(3, sell3), sym.set(3, sym3)

    [buy4, sell4, sym4] = f_st("BINANCE:XRPUSDT",   bar_say, 3,  0.1, 11, 0.7, low)
    buy.set(4, buy4), sell.set(4, sell4), sym.set(4, sym4)

    [buy5, sell5, sym5] = f_st("BIST:YKBNK",        bar_say, 15, 5.5, 13, 0.9, hlc3)
    buy.set(5, buy5), sell.set(5, sell5), sym.set(5, sym5)
    // Murat bu kod bloğunu 40'a kadar çoğaltabilirsin.

// Al sinyali etiketi içeriği
buyText = "AL Sinyal:\n"  // Başlangıçta yeni satır ekliyoruz

for i = 0 to 40 - 1
    if buy.get(i)
        buyText := buyText + sym.get(i) + "\n"

// Bu for göngüsü grubu değiştirsende doğru çalışır.

// Eğer Al sinyal etiketi yoksa oluştur
if (na(buyLabel))
    buyLabel := label.new(x=bar_index + barOffset + 20, y=high, text=buyText, style=label.style_label_down, color=color.new(color.green, 0), textcolor=color.white, size=size.normal)  // Dikey konuma -2 ekledik
else
    label.set_xy(buyLabel, bar_index + barOffset + 20, high)  // Dikey konuma -2 ekledik
    label.set_text(buyLabel, buyText)  // Al sinyal etiketinin içeriğini güncelle


// Sat sinyali etiketi içeriği
sellText = "SAT Sinyal:\n"  // Başlangıçta yeni satır ekliyoruz

for i = 0 to 40 - 1
    if sell.get(i)
        sellText := sellText + sym.get(i) + "\n"


// Eğer Sat sinyal etiketi yoksa oluştur
if (na(sellLabel))
    sellLabel := label.new(x=bar_index + barOffset + 40, y=high, text=sellText, style=label.style_label_down, color=color.new(color.red, 0), textcolor=color.white, size=size.normal)  // Dikey konuma -4 ekledik
else
    label.set_xy(sellLabel, bar_index + barOffset + 40, high)  // Dikey konuma -4 ekledik
    label.set_text(sellLabel, sellText)  // Sat sinyal etiketinin içeriğini güncelle

// Trend vurgulama
mPlot = plot(ohlc4, title='', style=plot.style_circles, linewidth=1)
longFillColor = trend == 1 ? color.new(color.green, 60) : na
shortFillColor = trend == -1 ? color.new(color.red, 60) : na
fill(mPlot, upPlot, title='UpTrend Highlighter', color=longFillColor)
fill(mPlot, dnPlot, title='DownTrend Highlighter', color=shortFillColor)

// Alarm koşulları
alertcondition(buySignal, title='Buy Signal', message='Buy Signal!')
alertcondition(sellSignal, title='Sell Signal', message='Sell Signal!')
How to Apply Pine Script in TradingView:
- Open TradingView and log in.
- Navigate to the Pine Script Editor at the bottom of the screen.
- Copy the provided Pine Script code.
- Paste it into the editor and click Save.
- Name the script, e.g., “Super Mxx.”
- Click Add to Chart to apply the script.
- Customize settings to align with your trading style via the indicator panel.
Final Verdict:
The Super Mxx script is a sophisticated tool designed for traders requiring precision and adaptability across multiple assets. Its non-repainting nature ensures dependable outputs, while the ability to configure individual symbols enhances its versatility. Although its complexity may require an initial learning curve, its robust features make it a valuable asset for advanced trading strategies and portfolio management.
RELATED POSTS
View all
Comprehensive Market Analysis with Indian SnR + ICT HTF Candles + FVG + VWAP by Kuldeep Singh Negi
January 3, 2025 | by admin
COCO+ Indicator: Advanced Moving Averages and Volume Analysis for Precision Trading
January 3, 2025 | by admin
RoyalPrince Indicator Pt.2: Comprehensive Market Trend and Support/Resistance Tool
January 21, 2025 | by admin