Render Token (RNDR) 2025 Price Analysis: A Comprehensive Forecast
January 28, 2025 | by admin
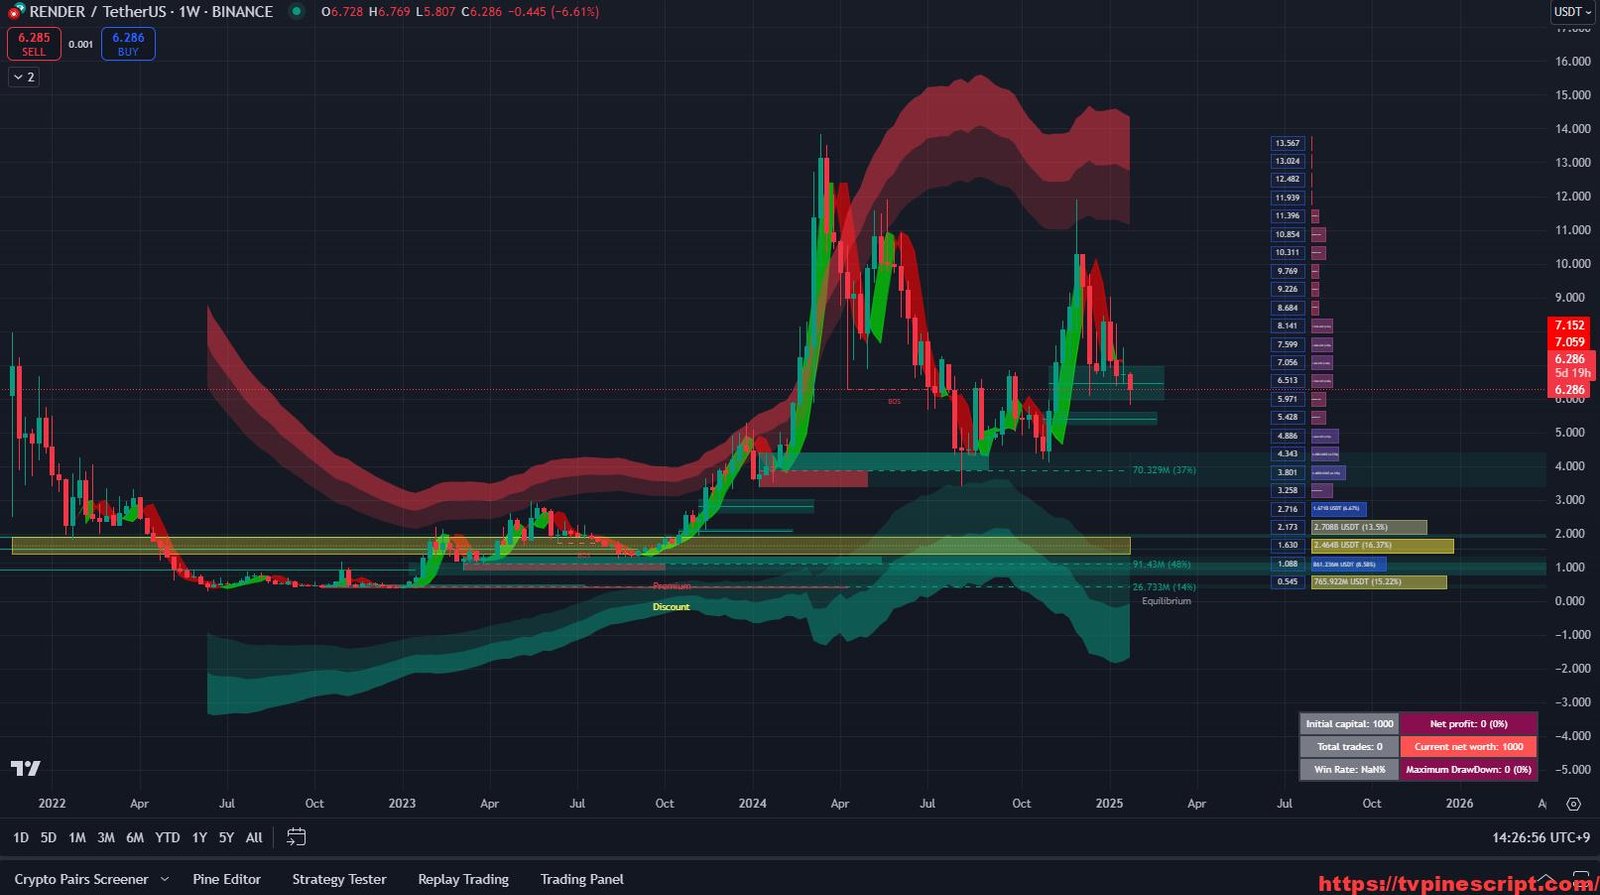
Render Token (RNDR) is a blockchain-based distributed GPU rendering network that enables decentralized computing power for visual rendering. The project has gained popularity in the artificial intelligence (AI) and 3D content industries. As of January 28, 2025, RNDR is trading at $6.286, showing a recent bearish trend. In this analysis, we will explore key support and resistance levels, technical indicators, trend forecasts, and recent news impacting RNDR’s future price action.
Current Market Overview
- Current Price: $6.286
- Market Sentiment: Neutral to bearish, with recent selling pressure.
- Trend Strength: Medium-term bullish, but currently in correction.
- Key Observations:
- The price is consolidating after a strong bullish move in late 2024.
- Support at $5.00 – $5.50 is being tested.
- Resistance at $7.50 – $9.00 could slow upside movements.
Technical Analysis
1. Key Resistance and Support Levels
| Zone | Price Range (USD) | Significance |
|---|---|---|
| Premium Zone | $9.00 – $13.50 | Strong resistance; profit-taking area. |
| Equilibrium | $6.00 – $7.50 | Neutral trading range; potential breakout level. |
| Discount Zone | $3.00 – $5.00 | Major support; strong accumulation potential. |
- Premium Zone:
- If RNDR surpasses $9.00, it could attempt a move towards $13.50.
- This area represents heavy historical resistance and strong seller activity.
- Equilibrium Zone:
- The $6.00 – $7.50 range is where price is consolidating.
- A breakout above $7.50 could trigger a rally, while failure to hold $6.00 may lead to further declines.
- Discount Zone:
- The $3.00 – $5.00 area has historically been an accumulation zone.
- If bearish sentiment continues, buyers may look to enter at these lower levels.
2. Indicators Observed
- Relative Strength Index (RSI):
- Currently hovering around 40, indicating neutral-to-bearish momentum.
- A drop below 30 would suggest oversold conditions and a potential reversal.
- Moving Averages (MA):
- The 50-day MA is currently above the 200-day MA, which is a bullish sign.
- However, if a death cross occurs (where the 50-day MA crosses below the 200-day MA), it could indicate further downside potential.
- Bollinger Bands:
- RNDR is trading near the lower Bollinger Band, which suggests it may soon find support or a short-term reversal.
- Volume Profile:
- Trading volume has decreased, signaling reduced buying interest.
- A breakout requires higher volume confirmation to sustain upward movement.
3. Trend Analysis
- Bullish Scenario:
- If RNDR holds above $6.00 and breaks above $7.50, we could see a move towards $9.00 – $10.00 in the coming weeks.
- Long-term, a breakout above $13.50 could push RNDR to new highs.
- Bearish Scenario:
- If RNDR fails to hold support at $6.00, the next key area of support is around $4.00 – $5.00.
- A breakdown below $3.00 would indicate a prolonged bearish trend.
2025 Price Projections
| Scenario | Target Price (USD) | Probability | Key Drivers |
|---|---|---|---|
| Bullish | $10 – $15 | 40% | Growing demand for AI and GPU rendering. |
| Neutral | $6 – $9 | 50% | Market consolidation and macroeconomic factors. |
| Bearish | Below $4 | 10% | Further market correction or weak adoption. |
Recent News and Developments
- Render Network Expansion into AI Computing:
- The Render Network has announced plans to expand its services into AI computing, allowing users to leverage GPU power for artificial intelligence tasks.
- This move could significantly boost demand for RNDR tokens. (Source)
- Strategic Partnership with NVIDIA:
- RNDR has formed a collaboration with NVIDIA, enabling GPU-intensive workloads on the network.
- This partnership positions RNDR as a leader in decentralized computing. (Source)
- Upcoming Tokenomics Upgrade in Q2 2025:
- Render Network is planning a supply reduction event, which may increase token scarcity and long-term value. (Source)
Investment Perspective: Buy, Sell, or Hold?
Buy Considerations
- Investors looking for long-term exposure may consider accumulating RNDR in the $4.00 – $5.50 range, where demand has historically been strong.
- A confirmed breakout above $7.50 with high volume could provide a momentum-based buying opportunity.
Sell Considerations
- Traders may look to take profits around $9.00 – $10.00, where resistance is likely.
- If RNDR breaks below $3.50, it could indicate prolonged bearish movement, warranting a stop-loss strategy.
Final Thoughts and Disclaimer
Render Token (RNDR) remains one of the most promising projects in decentralized GPU computing and AI rendering. However, its recent price action suggests a period of market consolidation, with potential for both upside and downside movement in the coming months.
⚠️ Disclaimer:
This analysis is not financial advice. Cryptocurrency investments carry significant risks, and price movements can be unpredictable. Always conduct your own research and consult with a financial professional before making investment decisions. Trade responsibly.
RELATED POSTS
View all
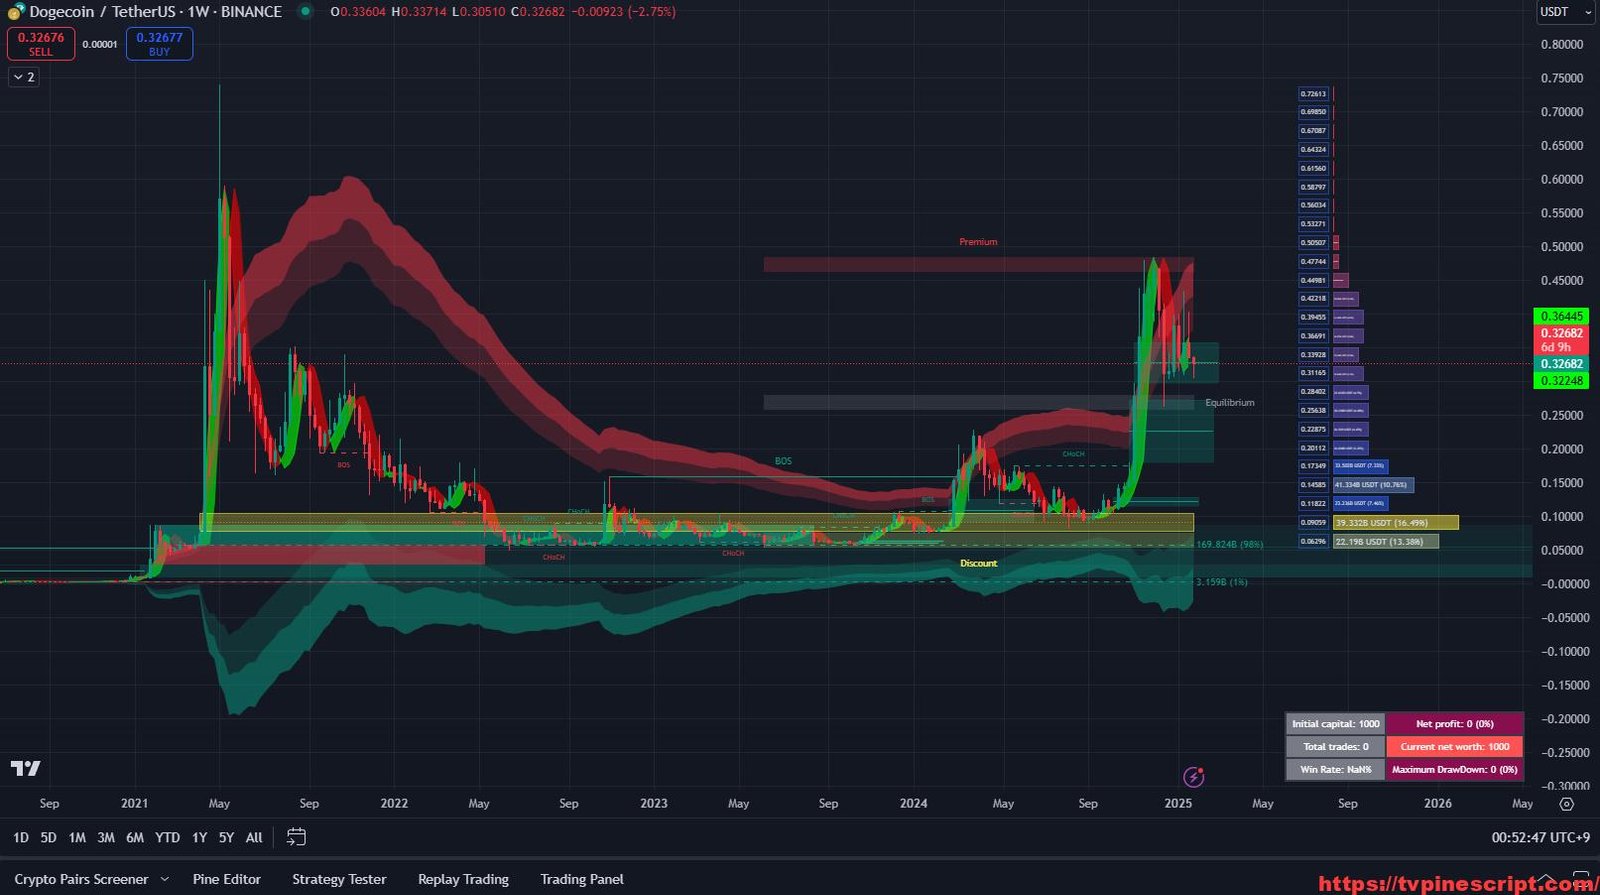
Dogecoin (DOGE) 2025 Price Analysis: A Comprehensive Market Outlook
January 27, 2025 | by admin
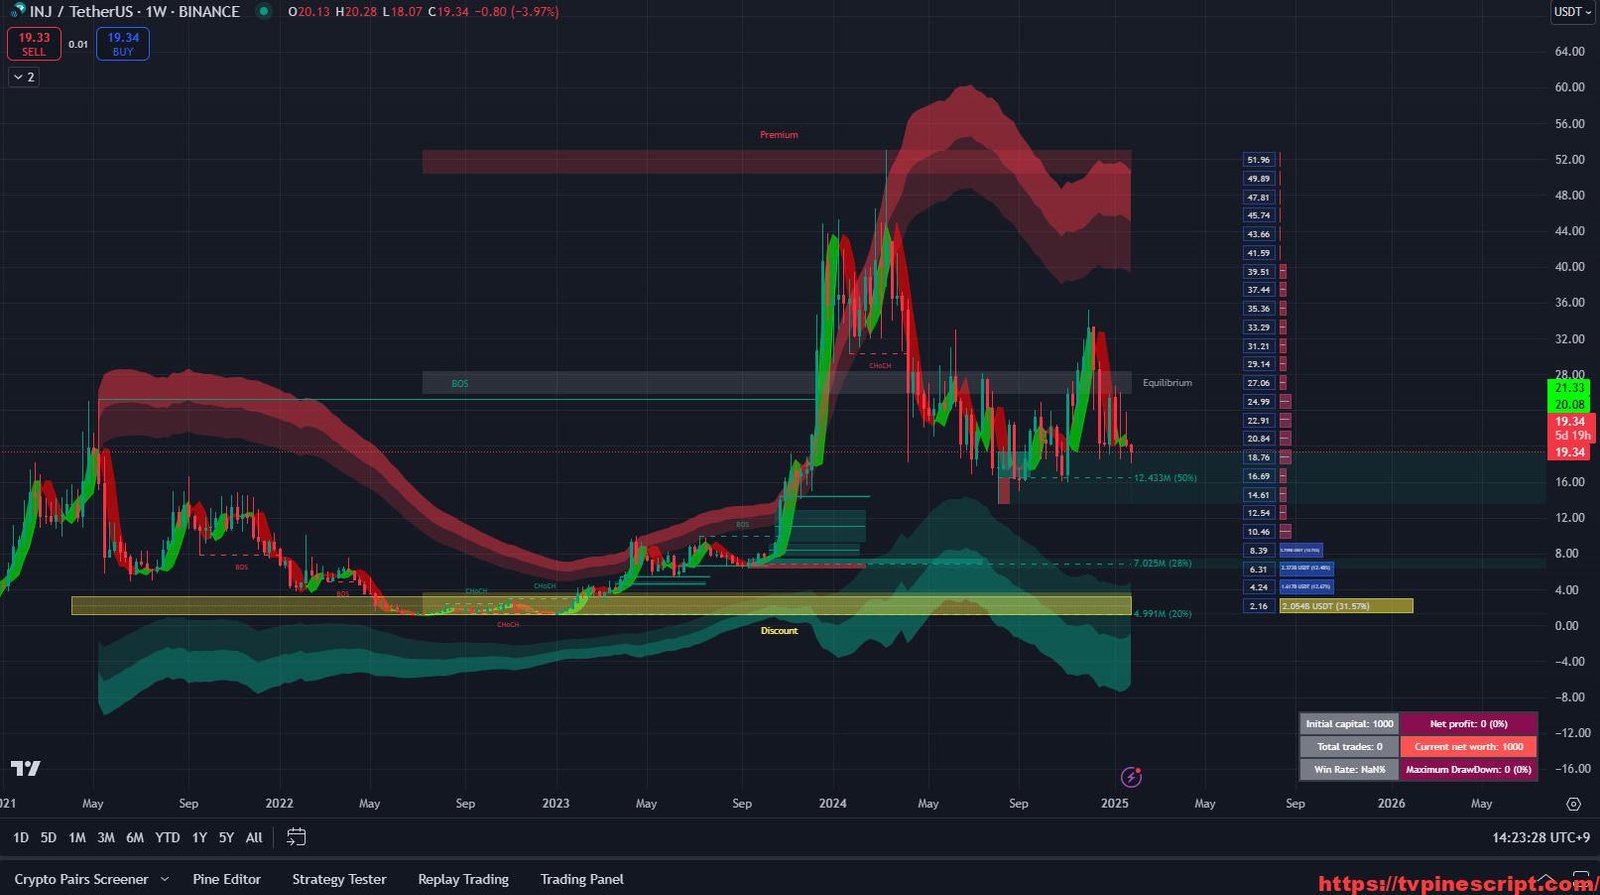
Injective (INJ) 2025 Price Analysis: A Comprehensive Insight
January 28, 2025 | by admin
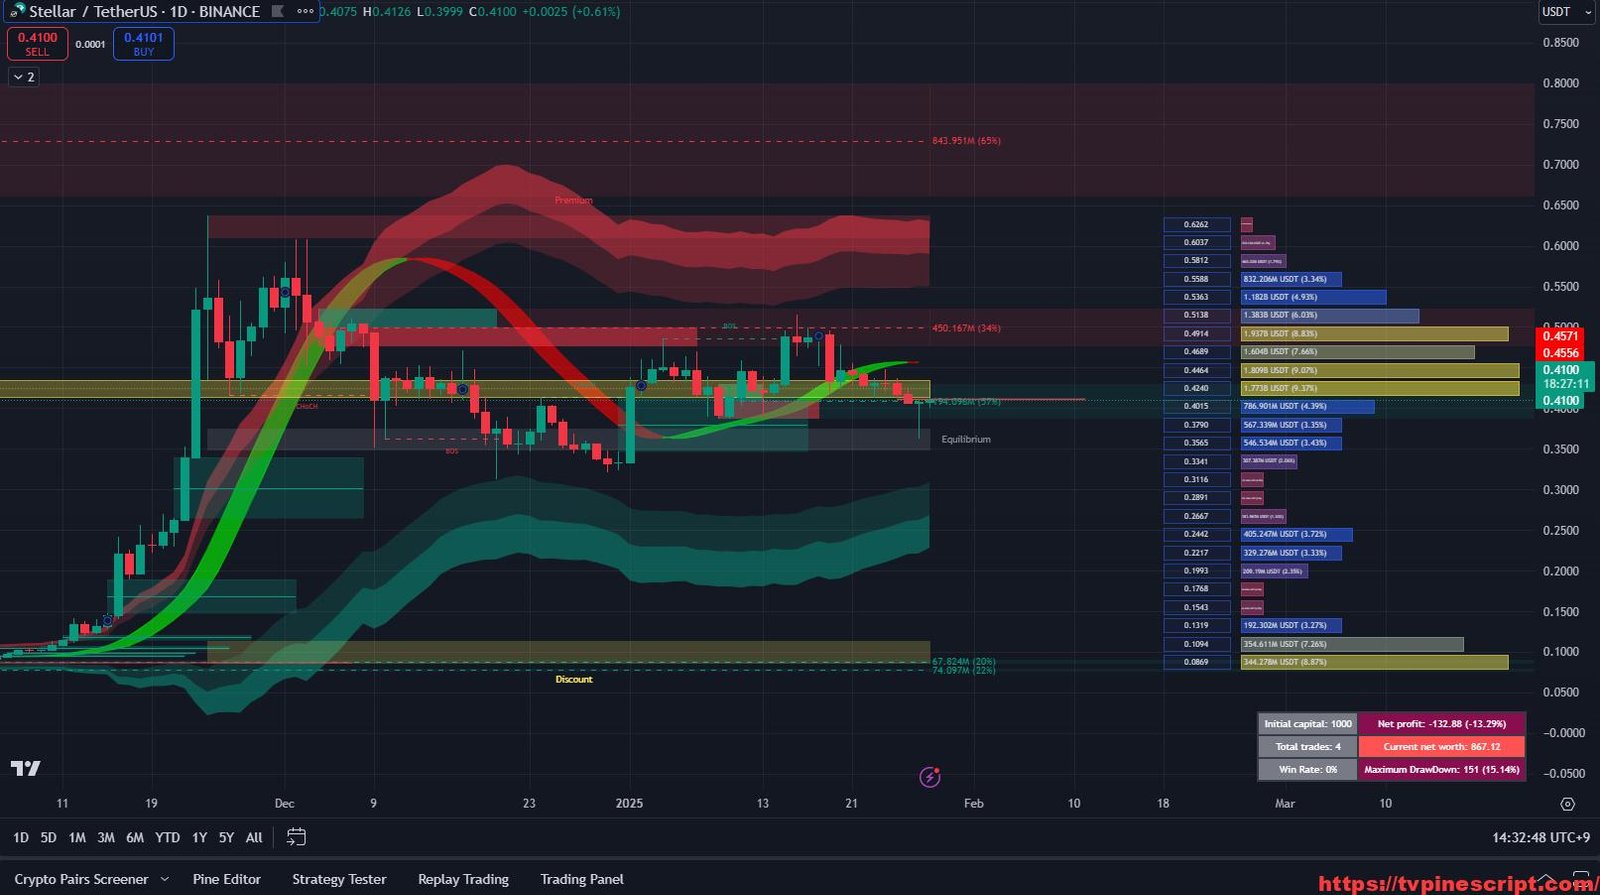
Stellar (XLM) Price Analysis and Market Forecast (2025)
January 28, 2025 | by admin