Revolutionize Trading with the Fresh Algo Signals & Overlays™ Pine Script
January 3, 2025 | by admin
//@version=5
indicator("Fresh Algo | Signals & Overlays™", overlay=true, max_lines_count=500, max_labels_count=500, max_boxes_count=350)
// V24 is working well
bullcolor = #00dbff
bearcolor = #b2b5be
ema150 = ta.ema(close, 150)
ema250 = ta.ema(close, 250)
gr_customalert = "Custom Alerts"
gr_signal = "General Configurations"
gr_PullBacksignal = "Trading Assistants"
gr_RiskManage = "Risk Management"
gr_dash = "Dashboard Configurations"

//symbol info
symInfoCheck = false
symInfo = syminfo.ticker + ' | ' + timeframe.period + (timeframe.isminutes ? 'M' : na)
date = str.tostring(dayofmonth(time_close)) + '/' + str.tostring(month(time_close)) + '/' + str.tostring(year(time_close))
//text positioning
textVPosition = 'middle'
textHPosition = 'center'
//symbol info positioning
symVPosition = 'top'
symHPosition = 'left'
//cell size
width = 0
height = 0
//title settings
c_title = #b2b5be80
s_title = 'large'
a_title = 'center'
//subtitle settings
c_subtitle = #b2b5be80
s_subtitle = 'normal'
a_subtitle = 'center'
c_bg = color.new(color.blue, 100)
// Get user input
showSignals       = input(true, "Show Signal's", group=gr_signal)
//showSignals       = true
sensitivity       = input.float(2.4, "Sensitivity", 0.1, step=0.1, group=gr_signal)
STuner            =  input.int(10, "Signal Tuner(1-25)", minval = 1, maxval = 25, group=gr_signal)
Presets           = "All Signals"
//Presets           = input.string("All Signals", "Presets", ["All Signals", "Strong+", "Trend Scalper"], group=gr_signal)
filterstyle       =  input.string("Trending Signals [Mode]", "Signal Mode / Filters", ["Trending Signals [Mode]", "Contrarian Signals [Mode]", "High Volume [Filter]", "Strong [Filter]", "Swing [Cloud Filter]", "Smooth [Cloud Filter]", "Scalping [Cloud Filter]", "Scalping+ [Cloud Filter]"], group=gr_signal)
//TextStyle       = input.string("Minimal", "Signal Style", ["Normal", "Minimal"], group=gr_signal)
//periodTrendCloud  = input.string("Smooth", "Trend Cloud Style", [ "Smooth" , "Scalping" , "Scalping+" , "Swing"], group=gr_Other_Settings)
TextStyle         = "Minimal"
consSignalsFilter = filterstyle == "Trending Signals [Mode]" ? true : false
StrongSignalsOnly  = filterstyle == "Strong [Filter]" ? true : false
highVolSignals    = filterstyle == "High Volume [Filter]" ? true : false
signalsTrendCloud = (filterstyle == "Smooth [Cloud Filter]") ? true : (filterstyle == "Scalping [Cloud Filter]") ? true : (filterstyle == "Scalping+ [Cloud Filter]") ? true : (filterstyle == "Swing [Cloud Filter]") ? true : false
ContrarianOnly = filterstyle == "Contrarian Signals [Mode]" ? true : false

TrendMap = 'Trend Gradient'
momentumCandles   = false
assistantenable   = input(true,'', group=gr_PullBacksignal, inline = 'sexyshit')
assistantmode     = input.string('Trend Assistant', 'Assistant | Mode',['Trend Assistant', 'Trend Tracker'], group = gr_PullBacksignal, inline = 'sexyshit')

Show_PR   = input.bool(true, title="", group = gr_PullBacksignal , inline = "Features1")
MSTuner       = input.int(8, "Reversal Dot | Tuner(2-30)", minval = 2, maxval = 30, group=gr_PullBacksignal, inline = "Features1")

LongTrendAverage  = assistantmode == 'Trend Tracker' and assistantenable == true ? true : false
analyscloud       = assistantmode == 'Trend Assistant' and assistantenable == true ? true : false
showTrendCloud    = (filterstyle == "Smooth [Cloud Filter]") ? true : (filterstyle == "Scalping [Cloud Filter]") ? true : (filterstyle == "Scalping+ [Cloud Filter]") ? true : (filterstyle == "Swing [Cloud Filter]") ? true : false
periodTrendCloud  = (filterstyle == "Smooth [Cloud Filter]") ? "Smooth" : (filterstyle == "Scalping [Cloud Filter]") ? "Scalping" : (filterstyle == "Scalping+ [Cloud Filter]") ? "Scalping+" : (filterstyle == "Swing [Cloud Filter]") ? "Swing" : na
//ScalpingPlus    = input(false, "Fast trend cloud", group=gr_Other_Settings)
//fastTrendCloudLen = input.int(55, "Fast trend cloud", 2, group=gr_Other_Settings)

fill(plot(showTrendCloud and periodTrendCloud == "Smooth" ? na : assistantenable == true and assistantmode == 'Trend Tracker' ? ema150 : na, "", na, editable=false), plot(showTrendCloud and periodTrendCloud == "Smooth" ? na : assistantenable == true and assistantmode == 'Trend Tracker' ? ema250 : na, "", na, editable=false), ema150 > ema250 ? color.new(bullcolor, 70) : ema150 < ema250 ? color.new(bearcolor, 70) : na)


showDashboard     =  input(true, "Smart Panel", group = gr_dash , inline = "Features1")
locationDashboard = input.string("Bottom Right", "Dashboard Location", ["Top Right", "Middle Right", "Bottom Right", "Top Center", "Middle Center", "Bottom Center", "Top Left", "Middle Left", "Bottom Left"], group = gr_dash , tooltip="Smart Panel")
sizeDashboard     = input.string("Small", "Dashboard Size", ["Large", "Normal", "Small", "Tiny"], group = gr_dash , tooltip="Smart Panel")


tpLabels          = input(true, "Dynamic Take Profit Lables", group=gr_RiskManage)
ShowTpSlAreas   = input(true, "Show take Profit/Stop-loss Area", group=gr_RiskManage)

ShowTrailingSL  = input(false, "Show trailing Stop-loss", group=gr_RiskManage)


usePercSL         = input(false, "SL/TRAILING", inline="1", group=gr_RiskManage)
percTrailingSL    = input.float(1, "", 0, step=0.1, inline="1", group=gr_RiskManage)
useTP1            = input(true, "", inline="1", group=gr_RiskManage)
multTP1           = input.float(1, "TP 1", 0, inline="1", group=gr_RiskManage)

useTP2            = input(true, "", inline="4", group=gr_RiskManage)
multTP2           = input.float(2, "TP 2           ", 0, inline="4", group=gr_RiskManage)
useTP3            = input(true, "", inline="4", group=gr_RiskManage)
multTP3           = input.float(3, "TP 3", 0, inline="4", group=gr_RiskManage)

ShowSwings      = input(false, "Show Market Structure      ", inline="3", group=gr_RiskManage)
periodSwings      = input.int(10, "        ", 2, inline="3", group=gr_RiskManage)

//showTS = input(title='Show Trend Shifter', defval=false, group='Contrarian SIGNALS')
// showsignals = input(title='Show Signals', defval=false, group='Contrarian SIGNALS')


// Alerts Managemnt
Normalbuy_alert = input.bool(title='Buy Signal   ', defval=false, inline = "NB", group=gr_customalert)
Strongbuy_alert = input.bool(title='Strong Buy', defval=false, inline = "NB", group=gr_customalert)

Normalsell_alert = input.bool(title='Sell Signal   ', defval=false , inline = "NS", group=gr_customalert)
Strongsell_alert = input.bool(title='Strong Sell', defval=false , inline = "NS", group=gr_customalert)

slalert = input.bool(title='Stop-Loss     ', defval=false , inline = "SLTP1", group=gr_customalert)
tp1alert = input.bool(title='Target 1', defval=false , inline = "SLTP1", group=gr_customalert)
tp2alert = input.bool(title='Target 2       ', defval=false , inline = "TP2TP3", group=gr_customalert)
tp3alert = input.bool(title='Target 3', defval=false , inline = "TP2TP3", group=gr_customalert)

bullcrosscloud_alert = input.bool(title='Bullish Cloud', defval=false, inline = "CD", group=gr_customalert)
bearcrosscloud_alert = input.bool(title='Bearish Cloud', defval=false, inline = "CD", group=gr_customalert)

showCons          = false
paintCons         = false

// Signal Text
SimpleBuy = "Buy"
StrongB = "Strong\nBuy"
SimpleSell = "Sell"
StrongS = "Strong\nSell"

if TextStyle == "Normal"
    SimpleBuy := "Buy"
    StrongB   := "Strong\nBuy"
    SimpleSell:= "Sell"
    StrongS   := "Strong\nSell"

if TextStyle == "Minimal"
    SimpleBuy := "▲"
    StrongB   := "▲+"
    SimpleSell:= "▼"
    StrongS   := "▼+"

// Signal Text Color
// bullsignalcolor = #000000
// bearsignalcolor = color.rgb(0, 0, 0)

// if TextStyle == "Normal"
//     bullsignalcolor := color.rgb(0, 0, 0)
//     bearsignalcolor := color.rgb(0, 0, 0)

// if TextStyle == "Minimal"
//     bullsignalcolor := color.rgb(0, 0, 0)
//     bearsignalcolor := color.rgb(0, 0, 0)


src = close
RSII = ta.ema(ta.rsi(src, 50), 30)
TR = math.abs(RSII - RSII[1])
wwalpha = 1 / 50
WWMA = 0.0
WWMA := wwalpha * TR + (1 - wwalpha) * nz(WWMA[1])
ATRRSI = 0.0
ATRRSI := wwalpha * WWMA + (1 - wwalpha) * nz(ATRRSI[1])
TsFast = ta.ema(ta.rsi(src, 50), 30)
TsUP = TsFast + ATRRSI * 4.236
TsDN = TsFast - ATRRSI * 4.236
textWatermark = table.new(textVPosition + '_' + textHPosition, 1, 3)
TsSlow = 0.0
TsSlow := TsUP < nz(TsSlow[1]) ? TsUP : TsFast > nz(TsSlow[1]) and TsFast[1] < nz(TsSlow[1]) ? TsDN : TsDN > nz(TsSlow[1]) ? TsDN : TsFast < nz(TsSlow[1]) and TsFast[1] > nz(TsSlow[1]) ? TsUP : nz(TsSlow[1])
Colorh = TsFast > 55 ? color.rgb(255, 0, 0) : TsFast < 45 ? color.rgb(0, 255, 8) : #ffffff

//QQF = plot(TsFast, 'TS FAST', color=color.new(color.maroon, 100), linewidth=2, display=display.none, editable = false)
//QQS = plot(TsSlow, 'TS SLOW', color=color.new(color.white, 100), linewidth=2, display=display.none , editable = false)
//plot(TsFast, color=Colorh, linewidth=2, style=plot.style_area, histbase=50)
//BearLimit = hline(60, color=color.gray, linestyle=hline.style_dashed)
//BullLimt = hline(40, color=color.gray, linestyle=hline.style_dashed)

bulllim = 45
bearlim = 55
BullSignalr = ta.crossover(TsFast, TsSlow) and TsFast < bulllim
BearSignallr = ta.crossunder(TsFast, TsSlow) and TsFast > bearlim

/////////////////////////////////////////////////////////
//  Trap Detector
////////////////////////////////////////////////////////
// Functions
wavetrend(src, chlLen, avgLen) =>
    esa = ta.ema(src, chlLen)
    d = ta.ema(math.abs(src - esa), chlLen)
    ci = (src - esa) / (0.015 * d)
    wt1 = ta.ema(ci, avgLen)
    wt2 = ta.sma(wt1, 3)
    [wt1, wt2]
f_top_fractal(src) => src[4] < src[2] and src[3] < src[2] and src[2] > src[1] and src[2] > src[0]
f_bot_fractal(src) => src[4] > src[2] and src[3] > src[2] and src[2] < src[1] and src[2] < src[0]
f_fractalize (src) => f_top_fractal(src) ? 1 : f_bot_fractal(src) ? -1 : 0
f_findDivs(src, topLimit, botLimit) =>
    fractalTop = f_fractalize(src) > 0 and src[2] >= topLimit ? src[2] : na
    fractalBot = f_fractalize(src) < 0 and src[2] <= botLimit ? src[2] : na
    highPrev = ta.valuewhen(fractalTop, src[2], 0)[2]
    highPrice = ta.valuewhen(fractalTop, high[2], 0)[2]
    lowPrev = ta.valuewhen(fractalBot, src[2], 0)[2]
    lowPrice = ta.valuewhen(fractalBot, low[2], 0)[2]
    bearSignal = fractalTop and high[1] > highPrice and src[1] < highPrev
    bullSignal = fractalBot and low[1] < lowPrice and src[1] > lowPrev
    [bearSignal, bullSignal]

// Get components
[wt1, wt2] = wavetrend(close, 5*MSTuner, 10*MSTuner)
[wtDivBear1, wtDivBull1] = f_findDivs(wt2, 10, -35)
[wtDivBear2, wtDivBull2] = f_findDivs(wt2, 40, -70)
wtDivBull = wtDivBull1 or wtDivBull2
wtDivBear = wtDivBear1 or wtDivBear2

plotshape(ta.crossover(wt1, wt2) and Show_PR and wt2 <= -60)
plotshape(ta.crossunder(wt1, wt2) and Show_PR and wt2 >= 60)

rsi = ta.rsi(close ,14)

// Functions
f_chartTfInMinutes() =>
    float _resInMinutes = timeframe.multiplier * (
      timeframe.isseconds ? 1. / 60             :
      timeframe.isminutes ? 1.                  :
      timeframe.isdaily   ? 60. * 24            :
      timeframe.isweekly  ? 60. * 24 * 7        :
      timeframe.ismonthly ? 60. * 24 * 30.4375  : na)
atr(len) =>
	tr = ta.tr
    atr = 0.0
    atr := nz(atr[1] + (tr - atr[1]) / len, tr)
supertrend(src, factor, len) =>
	atr = ta.atr(len)
	upperBand = src + factor * atr
	lowerBand = src - factor * atr
	prevLowerBand = nz(lowerBand[1])
	prevUpperBand = nz(upperBand[1])
	lowerBand := lowerBand > prevLowerBand or close[1] < prevLowerBand ? lowerBand : prevLowerBand
	upperBand := upperBand < prevUpperBand or close[1] > prevUpperBand ? upperBand : prevUpperBand
	int direction = na
	float superTrend = na
	prevSuperTrend = superTrend[1]
	if prevSuperTrend == prevUpperBand
		direction := close > upperBand ? 1 : -1
	else
		direction := close < lowerBand ? -1 : 1
	superTrend := direction == 1 ? lowerBand : direction == -1 ? upperBand : na
dchannel(len)=>
    hh = ta.highest(len)
    ll = ta.lowest (len)
    trend = 0
    trend := close > hh[1] ? 1 : close < ll[1] ? -1 : nz(trend[1])
trendScalper(show, len1, len2, len3, colorBull, colorBear, colorBarBull, colorBarBear) =>
    avgOC = math.avg(open, close)
    ha_o = 0.0, ha_o := na(ha_o[1]) ? avgOC : (ha_o[1] + ohlc4[1]) / 2
    ema1 = ta.ema(ha_o, len1), ema2 = ta.ema(ha_o, len2), ema3 = ta.ema(ha_o, len3)
    ris1 = ema1 > ema1[1], ris2 = ema2 > ema2[1], ris3 = ema3 > ema3[1]
    fal1 = ema1 < ema1[1], fal2 = ema2 < ema2[1], fal3 = ema3 < ema3[1]
    colorEma1 = ris1 ? colorBull : fal1 ? colorBear : na, colorEma2 = ris2 ? colorBull : fal2 ? colorBear : na, colorEma3 = ris3 ? colorBull : fal3 ? colorBear : na
    fillEma1 = avgOC > ema1 ? colorBull : avgOC < ema1 ? colorBear : na, fillEma2 = ema1 > ema2 ? colorBull : ema1 < ema2 ? colorBear : na, fillEma3 = ema2 > ema3 ? colorBull : ema2 < ema3 ? colorBear : na
    colorBar = close < ema1 and close < ema2 ? colorBarBear : colorBarBull
    [avgOC, show ? ema1 : na, show ? ema2 : na, show ? ema3 : na, color.new(colorEma1, 55), color.new(colorEma2, 45), color.new(colorEma3, 35), color.new(fillEma1, 85), color.new(fillEma2, 80), color.new(fillEma3, 75), colorBar]

candlesMom() =>
	[_, _, macd] = ta.macd(close, 2, 4, 3)
	(macd > 10 and macd > macd[1]) or (macd < 10 and macd < macd[1])

trailingSL(buy, sell, factor, len, usePerc, perc) =>
	atr = atr(len)
	upperBand = high + (usePerc ? high * (perc / 100) : factor * atr)
	lowerBand = low  - (usePerc ? low  * (perc / 100) : factor * atr)
	prevLowerBand = nz(lowerBand[1])
	prevUpperBand = nz(upperBand[1])
	lowerBand := lowerBand > prevLowerBand or buy  ? lowerBand : prevLowerBand
	upperBand := upperBand < prevUpperBand or sell ? upperBand : prevUpperBand
	int direction = na
	float stop = na
	prevSuperTrend = stop[1]
	if prevSuperTrend == prevUpperBand
		direction := buy ? 1 : -1
	else
		direction := sell ? -1 : 1
	stop := direction == 1 ? lowerBand : direction == -1 ? upperBand : na
add_to_zz(zz, val, bi) =>
    array.unshift(zz, bi)
    array.unshift(zz, val)
    if array.size(zz) > 12
        array.pop(zz)
update_zz(zz, val, bi, dir) =>
    if array.size(zz) == 0
        add_to_zz(zz, val, bi)
    else
        if dir == 1 and val > array.get(zz, 0) or dir == -1 and val < array.get(zz, 0)
            array.set(zz, 0, val)
            array.set(zz, 1, bi)
        0

// Get components

vosc = ta.obv - ta.ema(ta.obv, 20)
bs   = ta.ema(nz(math.abs((open - close) / (high - low) * 100)), 3)
ema  = ta.ema(close, 200)
emaBull = close > ema

equal_tf(res) => str.tonumber(res) == f_chartTfInMinutes()
higher_tf(res) => str.tonumber(res) > f_chartTfInMinutes()
too_small_tf(res) => (timeframe.isweekly and res=="1") or (timeframe.ismonthly and str.tonumber(res) < 10)
securityNoRep(sym, res, src) =>
    bool bull = na
    bull := equal_tf(res) ? src : bull
    bull := higher_tf(res) ? request.security(sym, res, src, barmerge.gaps_off, barmerge.lookahead_on) : bull
    bull_array = request.security_lower_tf(syminfo.tickerid, higher_tf(res) ? str.tostring(f_chartTfInMinutes()) : too_small_tf(res) ? (timeframe.isweekly ? "3" : "10") : res, src)
    if array.size(bull_array) > 1 and not equal_tf(res) and not higher_tf(res)
        bull := array.pop(bull_array)
    array.clear(bull_array)
    bull

//TF1Bull   = securityNoRep(syminfo.tickerid, "1"   , emaBull)
//TF3Bull   = securityNoRep(syminfo.tickerid, "3"   , emaBull)
TF5Bull   = securityNoRep(syminfo.tickerid, "5"   , emaBull)
//TF10Bull  = securityNoRep(syminfo.tickerid, "10"  , emaBull)
TF15Bull  = securityNoRep(syminfo.tickerid, "15"  , emaBull)
TF30Bull  = securityNoRep(syminfo.tickerid, "30"  , emaBull)
TF60Bull  = securityNoRep(syminfo.tickerid, "60"  , emaBull)
//TF120Bull = securityNoRep(syminfo.tickerid, "120" , emaBull)
TF240Bull = securityNoRep(syminfo.tickerid, "240" , emaBull)
//TF720Bull = securityNoRep(syminfo.tickerid, "720" , emaBull)
//TFDBull   = securityNoRep(syminfo.tickerid, "1440", emaBull)
hma55  = ta.hma(close, 55 )

[_, _, macd] = ta.macd(close, 12, 26, 9)
supertrend = supertrend(close, sensitivity, STuner)
maintrend  = dchannel(30)

confBull   = (ta.crossover (close, supertrend) or (ta.crossover (close, supertrend)[1] and maintrend[1] < 0)) and macd > 0 and macd > macd[1] and ema150 > ema250 and hma55 > hma55[2] and maintrend > 0
confBear   = (ta.crossunder(close, supertrend) or (ta.crossunder(close, supertrend)[1] and maintrend[1] > 0)) and macd < 0 and macd < macd[1] and ema150 < ema250 and hma55 < hma55[2] and maintrend < 0

trendcloud = supertrend(ohlc4, periodTrendCloud == "Swing" ? 7 : 4, 10)

hma = periodTrendCloud == "Scalping+" ? ta.hma(close, 55) : na

none = close > 0
[_, _, adx] = ta.dmi(14, 14)

consFilter = adx > 20

ContBear = TsFast > 65
ContBull = TsFast < 35


StrongFilter = ta.ema(close, 200)

//volFilter = (ta.ema(volume, 25) - ta.ema(volume, 26)) / ta.ema(volume, 26) > 0

volFilter = (ta.ema(volume, 15) - ta.ema(volume, 20)) / ta.ema(volume, 25) > 0

trendFilter = trendcloud

bull = (Presets == "All Signals" ? ta.crossover (close, supertrend) : confBull and not confBull[1]) and Presets != "Trend Scalper" and (StrongSignalsOnly ? close > StrongFilter : none) and (ContrarianOnly ? ContBull : none)  and (consSignalsFilter ? consFilter : none) and (highVolSignals ? volFilter : none) and (signalsTrendCloud ? (periodTrendCloud == "Smooth" ? ema150 > ema250 : close > trendFilter) : none)
bear = (Presets == "All Signals" ? ta.crossunder(close, supertrend) : confBear and not confBear[1]) and Presets != "Trend Scalper" and (StrongSignalsOnly ? close < StrongFilter : none) and (ContrarianOnly ? ContBear : none)  and (consSignalsFilter ? consFilter : none) and (highVolSignals ? volFilter : none) and (signalsTrendCloud ? (periodTrendCloud == "Smooth" ? ema150 < ema250 : close < trendFilter) : none)

countBull = ta.barssince(bull)
countBear = ta.barssince(bear)

trigger = nz(countBull, bar_index) < nz(countBear, bar_index) ? 1 : 0
[avgOC, ema5, ema9, ema21, colorEma5, colorEma9, colorEma21, fillEma5, fillEma9, fillEma21, colorBar] = trendScalper(Presets == "Trend Scalper" ? true : false, 5, 9, 21, bullcolor, bearcolor, bullcolor, bearcolor)

trailingStop = trailingSL(bull, bear, 2.2, 14, usePercSL, percTrailingSL)

float _ph    = ta.highestbars(high, periodSwings) == 0 ? high : na
float _pl    = ta.lowestbars (low,  periodSwings) == 0 ? low  : na
var   _dir   = 0, dir_ = _pl and na(_ph) ? -1 : _dir, _dir := _ph and na(_pl) ? 1 : dir_, dirChg = ta.change(_dir)
var   zz     = array.new_float(0), zzOld = array.copy(zz)
float zzLive = _ph or _pl ? (dirChg ? add_to_zz(zz, _dir == 1 ? _ph : _pl, bar_index) : update_zz(zz, _dir == 1 ? _ph : _pl, bar_index, _dir)) : na


float     hb_     = ta.highestbars(10) == 0 ? high : na
float     lb_     = ta.lowestbars (10) == 0 ? low  : na
var int   dir     = 0
float     zz_     = na
float     pp      = na
var int   consCnt = 0
var float condHi  = na
var float condLo  = na
float     H_      = ta.highest(5)
float     L_      = ta.lowest (5)
var line  lineUp  = na
var line  lineDn  = na
bool      breakUp = false
bool      breakDn = false
var float[] pvh1_price     = array.new_float(1000, na)
var int[]   pvh1_time      = array.new_int  (1000, na)
var float[] pvl1_price     = array.new_float(1000, na)
var int[]   pvl1_time      = array.new_int  (1000, na)
var float[] pvh2_price     = array.new_float(1000, na)
var int[]   pvh2_time      = array.new_int  (1000, na)
var float[] pvl2_price     = array.new_float(1000, na)
var int[]   pvl2_time      = array.new_int  (1000, na)
var float   htcmrll_price  = na
var int     htcmrll_time   = na
var float   ltcmrhh_price  = na
var int     ltcmrhh_time   = na
var box[]   long_boxes     = array.new_box()
var box[]   short_boxes    = array.new_box()
var float   temp_pv_0      = na
var float   temp_pv_1      = na
var float   temp_pv_2      = na
bool        pvh            = high < high[1] and high[1] > high[2]
bool        pvl            = low  > low [1] and low [1] < low [2]
int         pv1_time       = bar_index[1]
float       pv1_high       = high[1]
float       pv1_low        = low [1]


var buyBars  = array.new_box(365, na)
for i = 0 to 364
    box.delete(array.get(buyBars, i))
var sellBars = array.new_box(365, na)
for i = 0 to 364
    box.delete(array.get(sellBars, i))
// Colors
green    = bullcolor, green50  = color.new(green, 50),  green20  = color.new(green, 80)
red      = bearcolor, red50    = color.new(red, 50),    red20    = color.new(red, 80)
silver   = #B2B5BE, silver50 = color.new(silver, 50), silver20 = color.new(silver, 80)
// Plots
atrBand = usePercSL ? (trigger ? low : high) * (percTrailingSL / 100) : ta.atr(14) * 2.2

atrStop = trigger ? low - atrBand : high + atrBand

lastTrade(src) => ta.valuewhen(bull or bear, src, 0)

entry_y = lastTrade(close)

stop_y = lastTrade(atrStop)

tp1_y = (entry_y-lastTrade(atrStop))*multTP1 + entry_y

tp2_y = (entry_y-lastTrade(atrStop))*multTP2 + entry_y

tp3_y = (entry_y-lastTrade(atrStop))*multTP3 + entry_y

labelTpSl(cond, y, txt, color) =>
    label labelTpSl = ShowTpSlAreas and cond ? label.new(bar_index + 1, y, txt, xloc.bar_index, yloc.price, color, label.style_label_left, color.white, size.normal) : na
    label.delete(labelTpSl[1])
labelTpSl(none, entry_y, "Entry : " + str.tostring(math.round_to_mintick(entry_y)), color.orange)
labelTpSl(none, stop_y , "Stop loss : " + str.tostring(math.round_to_mintick(atrStop)), bearcolor)
labelTpSl(useTP1 and multTP1 != 0, tp1_y, "TP 1 : " + str.tostring(math.round_to_mintick(tp1_y)), bullcolor)
labelTpSl(useTP2 and multTP2 != 0, tp2_y, "TP 2 : " + str.tostring(math.round_to_mintick(tp2_y)), bullcolor)
labelTpSl(useTP3 and multTP3 != 0, tp3_y, "TP 3 : " + str.tostring(math.round_to_mintick(tp3_y)), bullcolor)
lineTpSl(cond, y, color, style) =>
    line lineTpSl = ShowTpSlAreas and cond ? line.new(bar_index - (trigger ? countBull : countBear), y, bar_index + 1, y, xloc.bar_index, extend.none, color, style) : na
    line.delete(lineTpSl[1])
lineTpSl(none, entry_y, color.orange, line.style_dashed)
lineTpSl(none, stop_y , bearcolor   , line.style_solid )
lineTpSl(useTP1 and multTP1 != 0, tp1_y, bullcolor, line.style_dotted)
lineTpSl(useTP2 and multTP2 != 0, tp2_y, bullcolor, line.style_dotted)
lineTpSl(useTP3 and multTP3 != 0, tp3_y, bullcolor, line.style_dotted)


buy  = showSignals and bull ? label.new(bar_index, low , close > StrongFilter ? StrongB  : SimpleBuy , xloc.bar_index, yloc.belowbar, bullcolor, label.style_label_up  , #000000, size.normal) : na
sell = showSignals and bear ? label.new(bar_index, high, close < StrongFilter ? StrongS : SimpleSell , xloc.bar_index, yloc.abovebar, bearcolor  , label.style_label_down, #000000, size.normal) : na

tpLabels(tp) =>
    tp1Bull = ta.crossover (rsi, 70), tp2Bull = ta.crossover (rsi, 75), tp3Bull = ta.crossover (rsi, 80)
    tp1Bear = ta.crossunder(rsi, 30), tp2Bear = ta.crossunder(rsi, 25), tp3Bear = ta.crossunder(rsi, 20)
    tp1Bull := tp1Bull and (nz(ta.barssince(tp1Bull)[1], 9999) > countBull), tp2Bull := tp2Bull and (ta.barssince(tp1Bull)[1] <= countBull), tp2Bull := tp2Bull and (nz(ta.barssince(tp2Bull)[1], 9999) > countBull), tp3Bull := tp3Bull and (ta.barssince(tp2Bull)[1] <= countBull), tp3Bull := tp3Bull and (nz(ta.barssince(tp3Bull)[1], 9999) > countBull)
    tp1Bear := tp1Bear and (nz(ta.barssince(tp1Bear)[1], 9999) > countBear), tp2Bear := tp2Bear and (ta.barssince(tp1Bear)[1] <= countBear), tp2Bear := tp2Bear and (nz(ta.barssince(tp2Bear)[1], 9999) > countBear), tp3Bear := tp3Bear and (ta.barssince(tp2Bear)[1] <= countBear), tp3Bear := tp3Bear and (nz(ta.barssince(tp3Bear)[1], 9999) > countBear)

    if Presets != "Trend Scalper" and tpLabels
        trigger ? (tp == 1 ? tp1Bull : tp == 2 ? tp2Bull : tp3Bull) : (tp == 1 ? tp1Bear : tp == 2 ? tp2Bear : tp3Bear)

plotshape(tpLabels(1), "", shape.xcross, location.abovebar, trigger ? green : na , 0, "TP 1", trigger ? green : na , false)
plotshape(tpLabels(2), "", shape.xcross, location.abovebar, trigger ? green : na , 0, "TP 2", trigger ? green : na , false)
plotshape(tpLabels(3), "", shape.xcross, location.abovebar, trigger ? green : na , 0, "TP 3", trigger ? green : na , false)
plotshape(tpLabels(1), "", shape.xcross, location.belowbar, trigger ? na    : red, 0, "TP 1", trigger ? na    : red, false)
plotshape(tpLabels(2), "", shape.xcross, location.belowbar, trigger ? na    : red, 0, "TP 2", trigger ? na    : red, false)
plotshape(tpLabels(3), "", shape.xcross, location.belowbar, trigger ? na    : red, 0, "TP 3", trigger ? na    : red, false)


var label zzLabel = na
if array.size(zz) > 12 and ShowSwings
    if array.get(zz, 0) != array.get(zzOld, 0) or array.get(zz, 1) != array.get(zzOld, 1)
        if array.get(zz, 2) == array.get(zzOld, 2) and array.get(zz, 3) == array.get(zzOld, 3)
            label.delete(zzLabel)
        zzLabel := label.new(math.round(array.get(zz, 1)), array.get(zz, 0), _dir == 1 ? array.get(zz, 0) > array.get(zz, 4) ? ((array.get(zz, 4) < array.get(zz, 8)) ? "High" : "HH") : "LH" : array.get(zz, 0) < array.get(zz, 4) ? ((array.get(zz, 4) > array.get(zz, 8)) ? "Low" : "LL") : "HL", xloc.bar_index, yloc.price, color.new(color.white, 100), _dir == 1 ? label.style_label_down : label.style_label_up, _dir == 1 ? bullcolor : bearcolor)


if showCons and barstate.isconfirmed
    dir := hb_ and na(lb_) ? 1 : lb_ and na(hb_) ? -1 : dir
    if hb_ and lb_
        if dir == 1
            zz_ := hb_
        else
            zz_ := lb_
    else
        zz_ := hb_ ? hb_ : lb_ ? lb_ : na
    for x = 0 to 1000
        if na(close) or dir != dir[x]
            break
        if zz_[x]
            if na(pp)
                pp := zz_[x]
            else
                if dir[x] == 1 and zz_[x] > pp
                    pp := zz_[x]
                if dir[x] == -1 and zz_[x] < pp
                    pp := zz_[x]
    if pp != pp[1]
        if consCnt > 5
            if pp > condHi
                breakUp := true
            if pp < condLo
                breakDn := true
        if consCnt > 0 and pp <= condHi and pp >= condLo
            consCnt += 1
        else
            consCnt := 0
    else
        consCnt += 1
    if consCnt >= 5
        if consCnt == 5
            condHi := H_
            condLo := L_
        else
            line.delete(lineUp)
            line.delete(lineDn)
            condHi := math.max(condHi, high)
            condLo := math.min(condLo, low )
        lineUp := line.new(bar_index, condHi , bar_index - consCnt, condHi , color=bearcolor , style=line.style_dashed)
        lineDn := line.new(bar_index, condLo , bar_index - consCnt, condLo , color=color.lime, style=line.style_dashed)
fill(plot(condHi, "", na, 1, plot.style_stepline, editable=false), plot(condLo, "", na, 1, plot.style_stepline, editable=false), paintCons and consCnt > 5 ? color.white : na, "", false)


//buy_col = color.new(#0ac20a,0)
//sell_col = color.new(#fd1605,0)
//text_col = color.new(#FFFFFF,0)


// -------- Bearish trend (blue) color selection --------
// getSellColor(count) =>
//     if count == 1
//         color.new(#11e7f2,0)
//     else
//         if count == 2
//             color.new(#11d9f2,0)
//         else
//             if count == 3
//                 color.new(#11cbf2,0)
//             else
//                 if count == 4
//                     color.new(#11aff2,0)
//                 else
//                     if count == 5
//                         color.new(#1193f2,0)
//                     else
//                         if count == 6
//                             color.new(#1176f2,0)
//                         else
//                             if count == 7
//                                 color.new(#105df4,0)
//                             else
//                                 if count == 8
//                                     color.new(#1051f5,0)
//                                 else
//                                     if count == 9
//                                         color.new(#0f44f5,0)
//                                     else
//                                         if count == 10
//                                             color.new(#0c3de0,0)
//                                         else
//                                             if count == 11
//                                                 color.new(#0935ca,0)
//                                             else
//                                                 if count == 12
//                                                     color.new(#062eb4,0)
//                                                 else
//                                                     if count == 13
//                                                         color.new(#02269e,0)

// -------- Bullish trend (blue) color selection --------
// getBuyColor(count) =>
//     if count == 1
//         color.new(#eef211,0)
//     else
//         if count == 2
//             color.new(#efdc11,0)
//         else
//             if count == 3
//                 color.new(#f0c511,0)
//             else
//                 if count == 4
//                     color.new(#f1af11,0)
//                 else
//                     if count == 5
//                         color.new(#f29811,0)
//                     else
//                         if count == 6
//                             color.new(#f28811,0)
//                         else
//                             if count == 7
//                                 color.new(#f27811,0)
//                             else
//                                 if count == 8
//                                     color.new(#f26811,0)
//                                 else
//                                     if count == 9
//                                         color.new(#f25811,0)
//                                     else
//                                         if count == 10
//                                             color.new(#ea420d,0)
//                                         else
//                                             if count == 11
//                                                 color.new(#e12c09,0)
//                                             else
//                                                 if count == 12
//                                                     color.new(#d81605,0)
//                                                 else
//                                                     if count == 13
//                                                         color.new(#cf0000,0)

// -------- Calculate bearish trend sequence --------
buySetup = 0
buySetup := close < close[4] ? buySetup[1] == 13 ? 1 : buySetup[1] + 1 : 0


// -------- Calculate bullish trend sequence --------
sellSetup = 0
sellSetup := close > close[4] ? sellSetup[1] == 13 ? 1 : sellSetup[1] + 1 : 0


// -------- Paint bars --------
//barColour = buySetup >= 1 ? getBuyColor(buySetup) : sellSetup >= 1 ? getSellColor(sellSetup) : na

// Candle Coloring
// Input
FastteyLength = 12
SjlowLeyLength = 26
srrrc = close
signalXLength = 9

// Data reference
[MacdX, signalX, histX] = ta.macd(srrrc, FastteyLength, SjlowLeyLength, signalXLength)
// 4 level of green
// greenHigh = #eeff00
// greenMidHigh = #c7ca00
// greenMidLow = #ddb500
// greenLow = #8635ff

// // Yellow
// yellowLow = #8635ff

// // 4 level of red
// redHigh = #ffffff
// redMidHigh = #cecece
// redMidLow = #dbdbdb
// redLow = #8635ff

// // Default color
// candleBody = yellowLow

// // Ranging trend
// if histX > 0
//     if histX > histX[1] and histX[1] > 0
//         candleBody := greenLow

// if histX < 0
//     if histX < histX[1] and histX[1] < 0
//         candleBody := redLow

// // Bullish trend
// if MacdX > 0 and histX > 0
//     candleBody := greenMidLow

//     if histX > histX[1] and MacdX[1] > 0 and histX[1] > 0
//         candleBody := greenMidHigh

//         if histX > histX[2] and MacdX[2] > 0 and histX[2] > 0
//             candleBody := greenHigh

// // Bearish trend
// if MacdX < 0 and histX < 0
//     candleBody := redMidLow

//     if histX < histX[1] and MacdX[1] < 0 and histX[1] < 0
//         candleBody := redMidHigh

//         if histX < histX[2] and MacdX[2] < 0 and histX[2] < 0
//             candleBody := redHigh


//barcolor(candleBody)
//barcolor(TrendMap == 'RSI Gradient' ? barColour : na, title='Bar colors (heatmap)',editable=false)
//barcolor(momentumCandles and candlesMom() ? color.rgb(187, 187, 187) : TrendMap == 'Signal Based' ? (Presets == "Trend Scalper" ? colorBar : na(countBull) and na(countBear) ? color.gray : trigger ? bullcolor : bearcolor) : TrendMap == 'RSI Gradient' ? barColour : TrendMap == 'Trend Gradient' ? candleBody : na , editable=false)
//plotcandle(open, high, low, close , color = momentumCandles and candlesMom() ? color.rgb(187, 187, 187) : TrendMap == 'Signal Based' ? (Presets == "Trend Scalper" ? colorBar : na(countBull) and na(countBear) ? color.gray : trigger ? bullcolor : bearcolor) : TrendMap == 'RSI Gradient' ? barColour : TrendMap == 'Trend Gradient' ? candleBody : na , editable=false  , wickcolor = momentumCandles and candlesMom() ? color.rgb(187, 187, 187) : TrendMap == 'Signal Based' ? (Presets == "Trend Scalper" ? colorBar : na(countBull) and na(countBear) ? color.gray : trigger ? bullcolor : bearcolor) : TrendMap == 'RSI Gradient' ? barColour : TrendMap == 'Trend Gradient' ? candleBody : na , editable=false  , bordercolor = momentumCandles and candlesMom() ? color.rgb(187, 187, 187) : TrendMap == 'Signal Based' ? (Presets == "Trend Scalper" ? colorBar : na(countBull) and na(countBear) ? color.gray : trigger ? bullcolor : bearcolor) : TrendMap == 'RSI Gradient' ? barColour : TrendMap == 'Trend Gradient' ? candleBody : na , editable=false  , editable = false)

fill(plot(showTrendCloud and periodTrendCloud == "Smooth" ? ema150 : na, "", na, editable=false), plot(showTrendCloud and periodTrendCloud == "Smooth" ? ema250 : na, "", na, editable=false), ema150 > ema250 ? color.new(bullcolor, 70) : ema150 < ema250 ? color.new(bearcolor, 70) : na)
plot(ShowTrailingSL and     trigger and nz(ta.barssince(low  < trailingStop), bar_index) > countBull ? trailingStop : na, "", green, 1, plot.style_linebr, editable=false)
plot(ShowTrailingSL and not trigger and nz(ta.barssince(high > trailingStop), bar_index) > countBear ? trailingStop : na, "", red  , 1, plot.style_linebr, editable=false)
p0 = plot(avgOC, "", na        , editable=false)
p1 = plot(ema5 , "", colorEma5 , editable=false)
p2 = plot(ema9 , "", colorEma9 , editable=false)
p3 = plot(ema21, "", colorEma21, editable=false)

plot(LongTrendAverage ? ta.ema(close, 250) : na, 'Trend Tracer', linewidth=2, color=close[8] > ta.ema(close, 250) ? color.new(bullcolor, 45) : color.new(bearcolor, 45))
fill(p0, p1, fillEma5 )
fill(p1, p2, fillEma9 )
fill(p2, p3, fillEma21)
fill(plot(showTrendCloud and periodTrendCloud != "Smooth" and periodTrendCloud != "Scalping+" and trendcloud != 0 and close > trendcloud ? trendcloud : na, "", bullcolor, 1, plot.style_linebr, editable=false), p0, color.new(bullcolor, 90))
fill(plot(showTrendCloud and periodTrendCloud != "Smooth" and periodTrendCloud != "Scalping+" and trendcloud != 0 and close < trendcloud ? trendcloud : na, "", bearcolor  , 1, plot.style_linebr, editable=false), p0, color.new(bearcolor  , 90))
//fill(plot(hma, "", hma > hma[2] ? green : hma < hma[2] ? red : na, editable=false), plot(hma[2], "", hma > hma[2] ? green : hma < hma[2] ? red : na, editable=false), hma > hma[2] ? green : hma < hma[2] ? red : na)
////////////////////////////////////////////////////////////////////////////////////////////////
// Get user input
indicatorTF = "Chart"
// Functions
sqz(bbLen, bbMult, kcLen, kcMult, source) =>
    upperBB = ta.sma(source, bbLen) + ta.stdev(source, bbLen) * bbMult
    lowerBB = ta.sma(source, bbLen) - ta.stdev(source, bbLen) * bbMult
    upperKC = ta.sma(source, kcLen) + ta.sma(ta.tr, kcLen) * kcMult
    lowerKC = ta.sma(source, kcLen) - ta.sma(ta.tr, kcLen) * kcMult
    sqzOn   = lowerBB > lowerKC and upperBB < upperKC
    sqzOff  = lowerBB < lowerKC and upperBB > upperKC
    [sqzOn, sqzOff]
qqe(rsiLen, rsiSmooth, factor, source, bbLen, bbMult) =>
    rsiMa     = ta.ema(ta.rsi(source, rsiLen), rsiSmooth)
    delta     = ta.ema(ta.ema(math.abs(ta.mom(rsiMa, 1)), rsiLen * 2 - 1), rsiLen * 2 - 1) * factor
    longBand  = 0.0, longBand  := rsiMa > longBand[1]  and rsiMa[1] > longBand[1]  ? math.max(longBand[1],  rsiMa - delta) : rsiMa - delta
    shortBand = 0.0, shortBand := rsiMa < shortBand[1] and rsiMa[1] < shortBand[1] ? math.min(shortBand[1], rsiMa + delta) : rsiMa + delta
    cross1    = ta.cross(rsiMa, shortBand[1])
    cross2    = ta.cross(rsiMa, longBand[1])
    trend     = 0.0, trend := cross1 ? 1 : cross2 ? -1 : nz(trend[1], 1)
    fastDelta = trend == 1 ? longBand : shortBand
    _hist     = rsiMa - 50
    _line     = fastDelta - 50
    [_, upper, lower] = ta.bb(_line, bbLen, bbMult)
    [_hist, _line, upper, lower]

// Get components
cond(_offset) =>
    top    = ta.highest(high, 10)
    bot    = ta.lowest(low, 10)
    osc    = ta.ema(hlc3, 5) - ta.ema(ohlc4, 20)
    oscRis = osc > osc[1]
    oscFal = osc < osc[1]
    oscA0  = osc > 0
    oscB0  = osc < 0
    oscTop = oscFal and oscRis[1]
    oscBot = oscRis and oscFal[1]
    bullR  = oscB0 and oscBot and ((osc > ta.valuewhen(oscB0 and oscBot, osc, 1) and bot < ta.valuewhen(oscB0 and oscBot, bot, 1)))
    bearR  = oscA0 and oscTop and ((osc < ta.valuewhen(oscA0 and oscTop, osc, 1) and top > ta.valuewhen(oscA0 and oscTop, top, 1)))
    bullH  = oscB0 and oscBot and ((osc < ta.valuewhen(oscB0 and oscBot, osc, 1) and bot > ta.valuewhen(oscB0 and oscBot, bot, 1)))
    bearH  = oscA0 and oscTop and ((osc > ta.valuewhen(oscA0 and oscTop, osc, 1) and top < ta.valuewhen(oscA0 and oscTop, top, 1)))
    [sqzOn, sqzOff] = sqz(20, 2, 20, 2, close)
    [_hist1, _line1, upper1, lower1] = qqe(6, 6, 3, close, 50, 0.001)
    [_hist2, _line2, upper2, lower2] = qqe(6, 5, 1.618, close, 50, 1)
    [_, _, tvr] = ta.dmi(14, 14)
    [osc[_offset], oscRis[_offset], oscFal[_offset], oscA0[_offset], oscB0[_offset], oscTop[_offset], oscBot[_offset], bullR[_offset], bearR[_offset], bullH[_offset], bearH[_offset], sqzOn[_offset], sqzOff[_offset], _hist1[_offset], upper1[_offset], lower1[_offset], _hist2[_offset], _line2[_offset], tvr[_offset]]
tf = indicatorTF == "Chart" ? timeframe.period : indicatorTF == "1 minute" ? "1" : indicatorTF == "3 minutes" ? "3" : indicatorTF == "5 minutes" ? "5" : indicatorTF == "10 minutes" ? "10" : indicatorTF == "15 minutes" ? "15" : indicatorTF == "30 minutes" ? "30" : indicatorTF == "45 minutes" ? "45" : indicatorTF == "1 hour" ? "60" : indicatorTF == "2 hours" ? "120" : indicatorTF == "3 hours" ? "180" : indicatorTF == "4 hours" ? "240" : indicatorTF == "12 hours" ? "720" : indicatorTF == "1 day" ? "1D" : indicatorTF == "1 week" ? "1W" : indicatorTF == "1 month" ? "1M" : na
[osc, oscRis, oscFal, oscA0, oscB0, oscTop, oscBot, bullR, bearR, bullH, bearH, sqzOn, sqzOff, _hist1, upper1, lower1, _hist2, _line2, tvr] = request.security(syminfo.tickerid, tf, cond(indicatorTF != "Chart" and barstate.isrealtime ? 1 : 0))
//colorTVR = tvr < 15 ? #F6525F : tvr > 15 and tvr < 25 ? #B2B5BE : #66BB6A
// Plots
//plot(Presets == "Money Moves TrendVR" ? tvr : na, "", colorTVR, editable=false)
TrendText = "Trending"
if tvr < 15 and tvr < 25
    TrendText := "No trend"

if tvr > 15 and tvr < 25
    TrendText := "Ranging"
//------------------------------------------------------------------------------------------------------- Volatitiry
//Calculates Volatility for Dashboard
atrr = 3 * ta.atr(10)
stdAtr = 2 * ta.stdev(atrr, 20)
smaAtr = ta.sma(atrr, 20)
topAtrDev = smaAtr + stdAtr
bottomAtrDev = smaAtr - stdAtr
calcDev = (atrr - bottomAtrDev) / (topAtrDev - bottomAtrDev)
percentVol = 40 * calcDev + 30
AvrLength = 21
PercentFilter = 144
xAavrVolume = ta.rma(volume, AvrLength)
nResLess = volume * 100 / xAavrVolume < PercentFilter ? 0 : volume
nRes = nResLess
clr = close < open ? #b2b5be : #00dbff
//plot(nRes, color=clr, style=plot.style_columns, title='Volume Filter', transp=20)
VolitiText = "Inactive"
if nRes
    VolitiText := "Active"
//////////////////////////////////////////
ema69 = ta.ema(close, 9)
totalSentTxt = ema69 > ema69[2] ? 'Bullish' : ema69 < ema69[2] ? 'Bearish' : 'Flat'
// INputs
//Timezones
tz_incr = 0
use_exchange = false
//------------------------------------------------------------------------------
//Settings
//-----------------------------------------------------------------------------{
//Session A
NYSes = true
NYTxt = 'New York'
NYTime = '1300-2200'
//Session B
LDSes = true
sesb_txt = 'London'
sesb_ses = '0700-1600'
//Session C
show_sesc = true
sesc_txt = 'Tokyo'
sesc_ses = '0000-0900'
//Session D
show_sesd = true
sesd_txt = 'Sydney'
sesd_ses = '2100-0600'
//-----------------------------------------------------------------------------}
//Sessions
//-----------------------------------------------------------------------------{
tff = timeframe.period

var tz = use_exchange ? syminfo.timezone :
  str.format('UTC{0}{1}', tz_incr >= 0 ? '+' : '-', math.abs(tz_incr))

is_sesa = math.sign(nz(time(tff, NYTime, tz)))
is_sesb = math.sign(nz(time(tff, sesb_ses, tz)))
is_sesc = math.sign(nz(time(tff, sesc_ses, tz)))
is_sesd = math.sign(nz(time(tff, sesd_ses, tz)))
////////////////////////////////////////////
SessionText = "Default"

if is_sesd
    SessionText := sesd_txt
if is_sesc
    SessionText := sesc_txt
if is_sesb
    SessionText := sesb_txt
if is_sesa
    SessionText := NYTxt
if is_sesd and is_sesc
    SessionText := "Sydney/Tokyo"
if is_sesb and is_sesc
    SessionText := "Tokyo/London"
if is_sesb and is_sesa
    SessionText := "London/Newyork"
if is_sesa and is_sesd
    SessionText := "Newyork/Sydney"
//-----------------------------------------------------------------------------}
//Overlays  color.green : color.red
//
var dashboard_loc  = locationDashboard == "Top Right" ? position.top_right : locationDashboard == "Middle Right" ? position.middle_right : locationDashboard == "Bottom Right" ? position.bottom_right : locationDashboard == "Top Center" ? position.top_center : locationDashboard == "Middle Center" ? position.middle_center : locationDashboard == "Bottom Center" ? position.bottom_center : locationDashboard == "Top Left" ? position.top_left : locationDashboard == "Middle Left" ? position.middle_left : position.bottom_left
var dashboard_size = sizeDashboard == "Large" ? size.large : sizeDashboard == "Normal" ? size.normal : sizeDashboard == "Small" ? size.small : size.tiny
var dashboard      = showDashboard ? table.new(dashboard_loc, 3, 7, color.rgb(30, 34, 45 , 60), #3d384300, 2, color.rgb(30, 34, 45 , 60), 1) : na
dashboard_cell(column, row, txt, signal=false) => table.cell(dashboard, column, row, txt, 0, 0, signal ? #000000 : color.white, text_size=dashboard_size)
dashboard_cell_bg(column, row, col) => table.cell_set_bgcolor(dashboard, column, row, col)
if barstate.islast and showDashboard
// MTF Trend
    dashboard_cell(0, 0 , "MTF")
    dashboard_cell(0, 2 , "M5") , dashboard_cell_bg(0, 2 , TF5Bull  ? #00dbff : #b2b5be)
    dashboard_cell(0, 3 , "M15") , dashboard_cell_bg(0, 3 , TF15Bull  ? #00dbff : #b2b5be)
    dashboard_cell(0, 4 , "M30") , dashboard_cell_bg(0, 4 , TF30Bull  ? #00dbff : #b2b5be)
    dashboard_cell(0, 5 , "1H") , dashboard_cell_bg(0, 5 , TF60Bull  ? #00dbff : #b2b5be)
    dashboard_cell(0, 6 , "4H") , dashboard_cell_bg(0, 6 , TF240Bull  ? #00dbff : #b2b5be)
// Middel part
    dashboard_cell(1, 0 , "Fresh Algo | Signals & Overlays™")
    dashboard_cell(1, 2 , "🔥 Market State               ")
    dashboard_cell(1, 3 , "⚠️ Volatility                    ")
    dashboard_cell(1, 4 , "🏦 Institutional Activity    ")
    dashboard_cell(1, 5 , "🕒 Current Session (UTC)  ")
    dashboard_cell(1, 6 , "🌊 Trend Pressure           ")
// End part
    dashboard_cell(2, 0 , "")
    dashboard_cell(2, 2 , TrendText)
    dashboard_cell(2, 3 , str.tostring(percentVol, '##.##') + '%')
    dashboard_cell(2, 4 , VolitiText)
    dashboard_cell(2, 5 , SessionText)
    dashboard_cell(2, 6 , totalSentTxt)
// Alerts
f_sl_crossed() =>
    ret = false
    stop = ShowTrailingSL ? trailingStop : stop_y
    crossBull = low [1] >= stop[1] and low  < stop[1] and ta.barssince(low [1] >= stop[1] and low  < stop[1])[1] >= countBull - 1
    crossBear = high[1] <= stop[1] and high > stop[1] and ta.barssince(high[1] <= stop[1] and high > stop[1])[1] >= countBear - 1
    ret := trigger[1] ? crossBull : crossBear
f_tp_crossed(tp) =>
    ret = false
    profit = tp
    crossBull = high[1] <= profit[1] and high > profit[1] and ta.barssince(high[1] <= profit[1] and high > profit[1])[1] >= countBull - 1
    crossBear = low [1] >= profit[1] and low  < profit[1] and ta.barssince(low [1] >= profit[1] and low  < profit[1])[1] >= countBear - 1
    ret := trigger[1] ? crossBull : crossBear
alert01 = (bull and close <= StrongFilter) or (bear and close >= StrongFilter)
alert02 = bull or bear
alert03 = (bull and close > StrongFilter) or (bear and close < StrongFilter)
alert04 = bull and close <= StrongFilter
alert06 = bear and close >= StrongFilter
alert07 = bull and close > StrongFilter
alert08 = bear and close < StrongFilter
alert09 = f_sl_crossed()
alert11 = f_tp_crossed(tp1_y)
alert12 = f_tp_crossed(tp2_y)
alert13 = f_tp_crossed(tp3_y)
alert14 = periodTrendCloud == "Smooth" ? ta.crossunder(ema150, ema250) : (close < trendcloud) and (close > trendcloud)[1]
alert15 = periodTrendCloud == "Smooth" ? ta.crossover (ema150, ema250) : (close > trendcloud) and (close < trendcloud)[1]
// Signal Alerts
if alert04 and Normalbuy_alert
    alert('Buy Signal Alert !!!' , alert.freq_once_per_bar_close)
    alert(syminfo.tickerid)
if alert07 and Strongbuy_alert
    alert('Strong Buy Signal Alert !!!', alert.freq_once_per_bar_close)
    alert(syminfo.tickerid)
if (bear and close >= StrongFilter) and Normalsell_alert
    alert('Sell Signal Alert !!!', alert.freq_once_per_bar_close)
    alert(syminfo.tickerid)
if (bear and close < StrongFilter) and Strongsell_alert
    alert('Strong Sell Signal Alert !!!', alert.freq_once_per_bar_close)
    alert(syminfo.tickerid)
// Risk Management Alerts
if alert09 and slalert
    alert('SL Alert !!!', alert.freq_once_per_bar_close)
    alert(syminfo.tickerid)
if alert11 and tp1alert
    alert('Target 1 Alert !!!', alert.freq_once_per_bar_close)
    alert(syminfo.tickerid)
if alert12 and tp2alert
    alert('Target 2 Alert !!!', alert.freq_once_per_bar_close)
    alert(syminfo.tickerid)
if alert13 and tp3alert
    alert('Target 3 Alert !!!', alert.freq_once_per_bar_close)
    alert(syminfo.tickerid)
// Cloud Alert
if alert15 and bullcrosscloud_alert
    alert('Cloud Turned Bullish !!!', alert.freq_once_per_bar_close)
    alert(syminfo.tickerid)
if alert14 and bearcrosscloud_alert
    alert('Cloud Turned Bearish !!!', alert.freq_once_per_bar_close)
    alert(syminfo.tickerid)

alertcondition(alert01, "Any Signal Contrarian Buy / Contrarian sell", "Buy or Sell")
alertcondition(alert04, "Contrarian Buy alert", "Buy")
alertcondition(alert06, "Contrarian Sell alert", "Sell")
// Bar Coloring
// Input
fastLength = 12
slowLength = 26
srcceed = close
signalLength = 9
// Data reference
[macdda, signal, hist] = ta.macd(srcceed, fastLength, slowLength, signalLength)
// 4 level of green
greenHighh = #00dbff
greenMidHighh = #61eaff
greenMidLowh = #40e6ff
greenLowh = #61eaff
// Yellow
yellowLowh = #80eeff
// 4 level of red
redHighh = #a1f3ff
redMidHighh = #c0f7ff
redMidLowh = #e0fbff
redLowh = #FFFFFF
// Default color
candleBodyd = yellowLowh
// Ranging trend
if hist > 0
    if hist > hist[1] and hist[1] > 0
        candleBodyd := greenLowh

if hist < 0
    if hist < hist[1] and hist[1] < 0
        candleBodyd := redLowh

// Bullish trend
if macdda > 0 and hist > 0
    candleBodyd := greenMidLowh

    if hist > hist[1] and macd[1] > 0 and hist[1] > 0
        candleBodyd := greenMidHighh

        if hist > hist[2] and macd[2] > 0 and hist[2] > 0
            candleBodyd := greenHighh

// Bearish trend
if macdda < 0 and hist < 0
    candleBodyd := redMidLowh

    if hist < hist[1] and macd[1] < 0 and hist[1] < 0
        candleBodyd := redMidHighh

        if hist < hist[2] and macd[2] < 0 and hist[2] < 0
            candleBodyd := redHighh

barcolor(candleBodyd) // Include suggestion by Shaheen204
//
tenkan_len  = 365
tenkan_mult = 3
kijun_len   = 365
kijun_mult  = 7
spanB_len   = 365
spanB_mult  = 10
offset      = 1
//------------------------------------------------------------------------------
avg(src,length,mult)=>
    atr = ta.atr(50)*mult
    up = hl2 + atr
    dn = hl2 - atr
    upper = 0.,lower = 0.
    upper := src[1] < upper[1] ? math.min(up,upper[1]) : up
    lower := src[1] > lower[1] ? math.max(dn,lower[1]) : dn

    os = 0,max = 0.,min = 0.
    os := src > upper ? 1 : src < lower ? 0 : os[1]
    spt = os == 1 ? lower : upper
    max := ta.cross(src,spt) ? math.max(src,max[1]) : os == 1 ? math.max(src,max[1]) : spt
    min := ta.cross(src,spt) ? math.min(src,min[1]) : os == 0 ? math.min(src,min[1]) : spt
    math.avg(max,min)
//------------------------------------------------------------------------------
tenkan = avg(close,tenkan_len,tenkan_mult)
kijun = avg(close,kijun_len,kijun_mult)
senkouA = math.avg(kijun,tenkan)
senkouB = avg(close,spanB_len,spanB_mult)
//------------------------------------------------------------------------------

cloud_a = color.new(#00dbff, 80)
cloud_b = color.new(#b2b5be, 80)

A = plot(senkouA,'Senkou Span A',na,offset=offset-1, editable = false)
B = plot(senkouB,'Senkou Span B',na,offset=offset-1, editable = false)
fill(A,B,senkouA > senkouB and analyscloud == true ? cloud_a : analyscloud == true ? cloud_b : na)
How to Apply Pine Script in TradingView:
- Open TradingView and log in.
- Navigate to the Pine Script Editor at the bottom of the screen.
- Copy the provided Pine Script code.
- Paste it into the editor and click Save.
- Name the script, e.g., “Fresh Algo Signals & Overlays™.”
- Click Add to Chart to apply the script.
- Customize settings to match your trading style via the indicator panel.
Key Features of the Script:
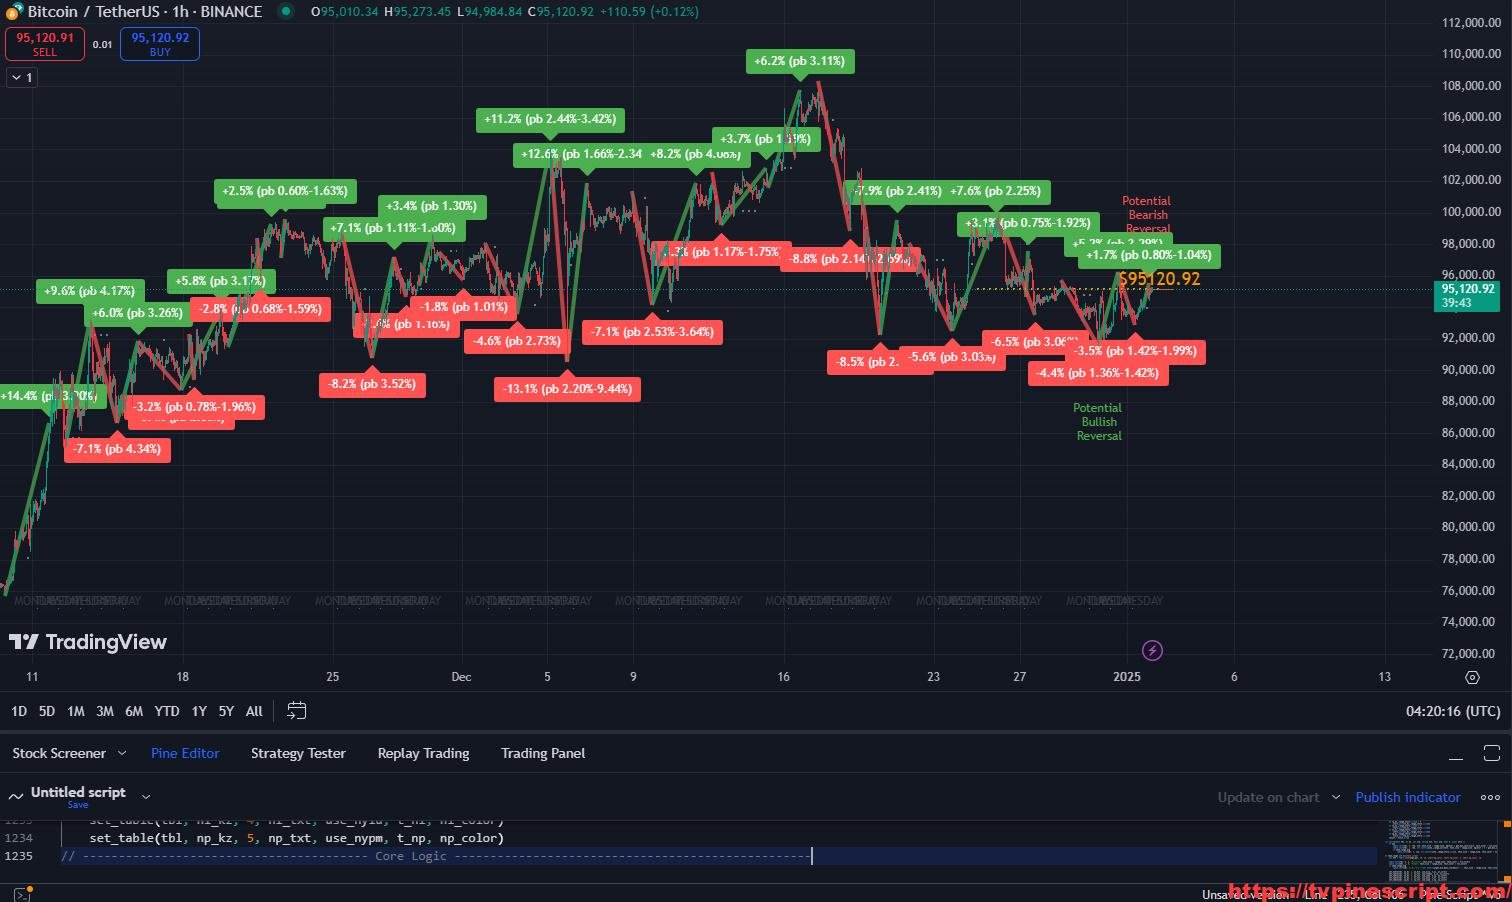
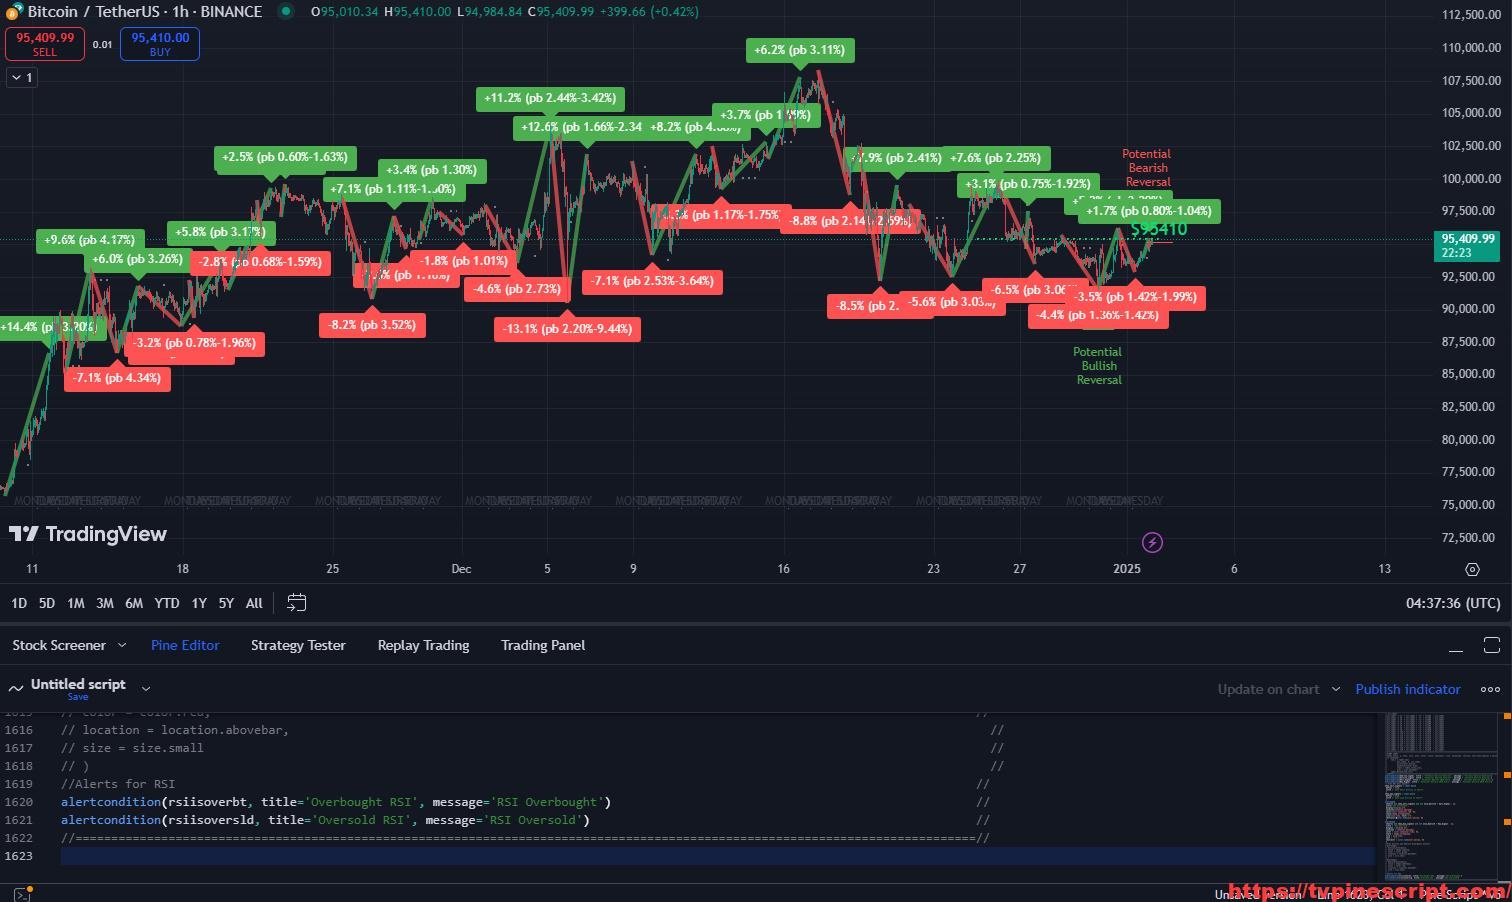
- Comprehensive Signal Generation:
- Generates buy and sell signals with customizable sensitivity and filtering options.
- Includes “Strong Buy” and “Strong Sell” signals based on advanced technical conditions.
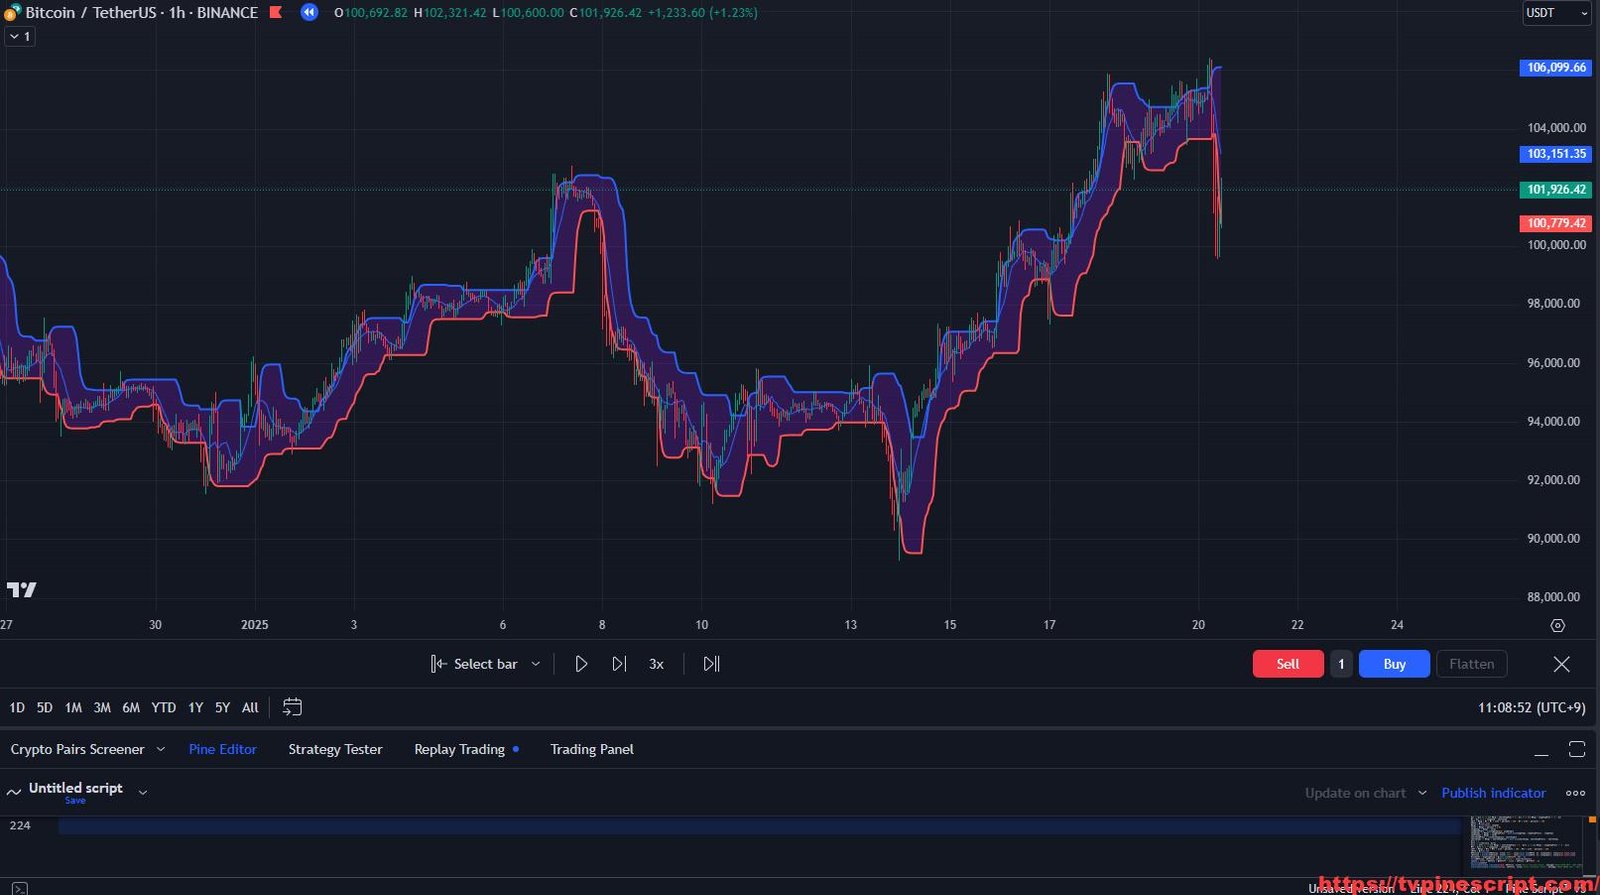
- Dynamic Trend and Cloud Analysis:
- Utilizes EMA and HMA-based trend clouds to visualize market momentum.
- Features multiple trend filters, including scalping, swing, and contrarian modes.
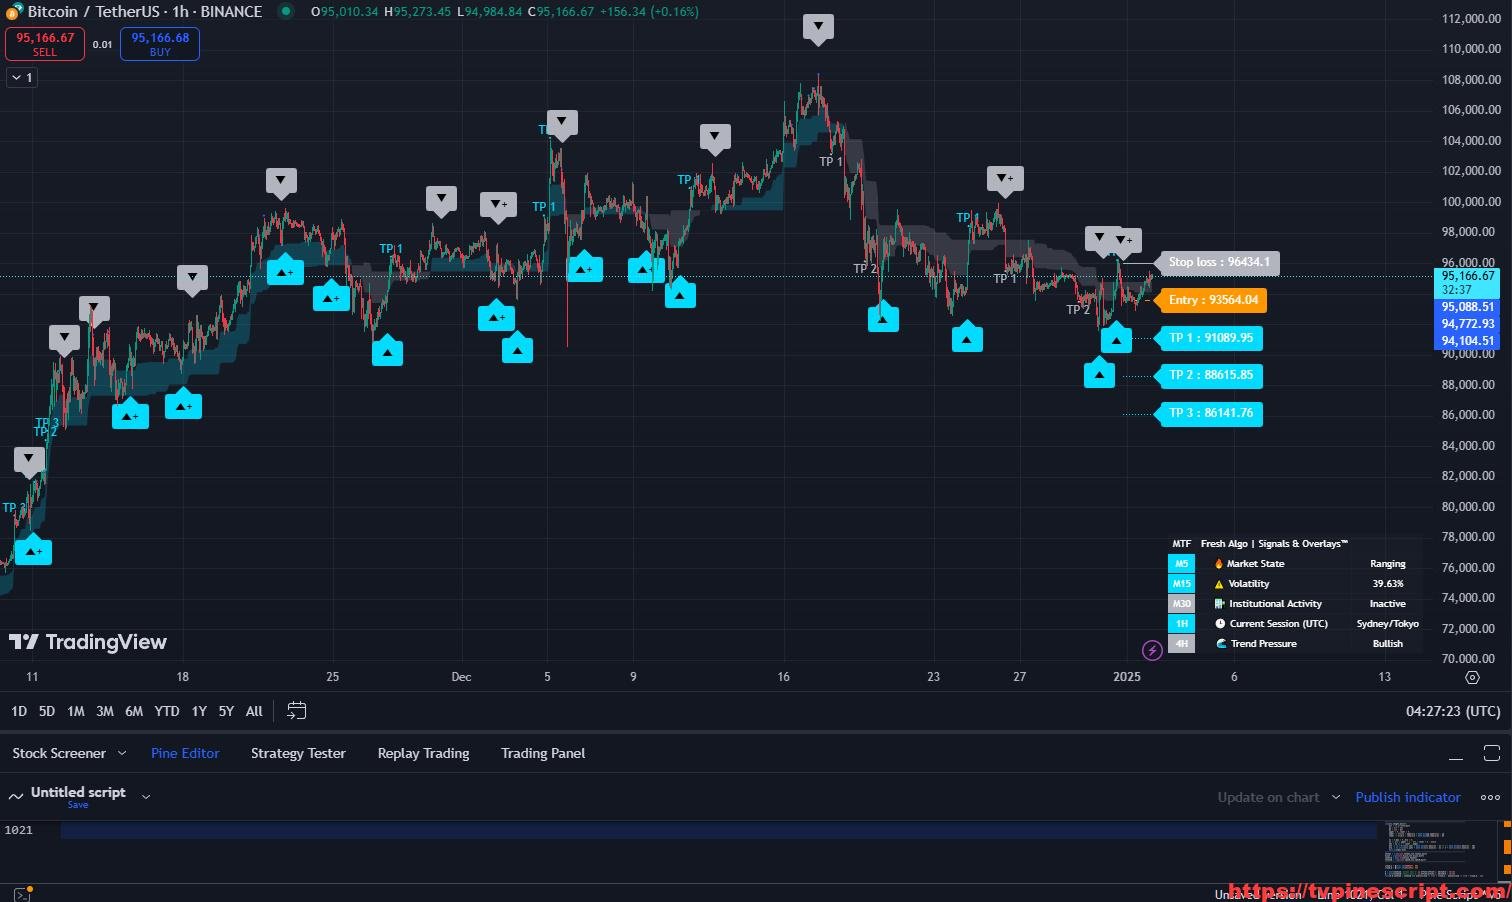
- ATR-Based Risk Management:
- Displays dynamic take-profit and stop-loss levels.
- Includes trailing stop-loss functionality for adaptive trade management.
- Multi-Timeframe (MTF) Dashboard:
- Provides a detailed market overview across key timeframes (e.g., M5, M15, H1).
- Highlights trends and signals for each timeframe in a visually intuitive panel.
- Advanced Alerts System:
- Supports custom alerts for buy/sell signals, stop-loss hits, and take-profit levels.
- Includes cloud-based bullish and bearish crossover alerts.
- Session and Volatility Indicators:
- Highlights active trading sessions (New York, London, Tokyo, Sydney) for session-based analysis.
- Displays market volatility levels and institutional activity indicators.
- Smart Dashboard:
- Integrates a customizable panel showing market state, volatility, session data, and trend pressure.
- Provides quick insights for both scalpers and swing traders.
Recommended Usage:
- Scalping and Day Trading:
- Leverage trend cloud filters and MTF signals to optimize quick trades.
- Use session-specific insights for high-probability setups during active hours.
- Swing Trading:
- Identify longer-term trends using the HMA and EMA trend lines.
- Utilize the dynamic ATR-based risk management system to set precise entry and exit levels.
- Comprehensive Risk Management:
- Use take-profit and stop-loss labels to automate trade exits.
- Adjust trailing stop settings for better trade protection.
- Volatility and Session Awareness:
- Monitor market activity during volatile sessions to maximize opportunities.
Script Evaluation:
- Functionality: 4.9/5
Combines signal generation, risk management, and market visualization, making it highly versatile for all trading styles. - Ease of Use: 4.7/5
Despite the advanced features, its intuitive dashboard and visual indicators are user-friendly. - Accuracy: 4.8/5
Reliable signals when combined with the recommended filters and settings. - Repainting:
This script does not repaint, ensuring real-time reliability and actionable insights for trading decisions. - Overall Score: 4.8/5
A cutting-edge tool for traders looking for a comprehensive and dynamic trading assistant.
RELATED POSTS
View all
Pullback Analysis with ICT GridBot and Advanced Pine Script Features
January 3, 2025 | by admin
Maximize Profits with ICT + Pullback + GridBot: Advanced Trading Automation
January 3, 2025 | by admin
TradeGenius MA+HLOTT: Mastering Market Trends with Adaptive Moving Averages and Dynamic Support/Resistance
January 21, 2025 | by admin