Key Features of the Script:
- VWAP-Based Trend Analysis:
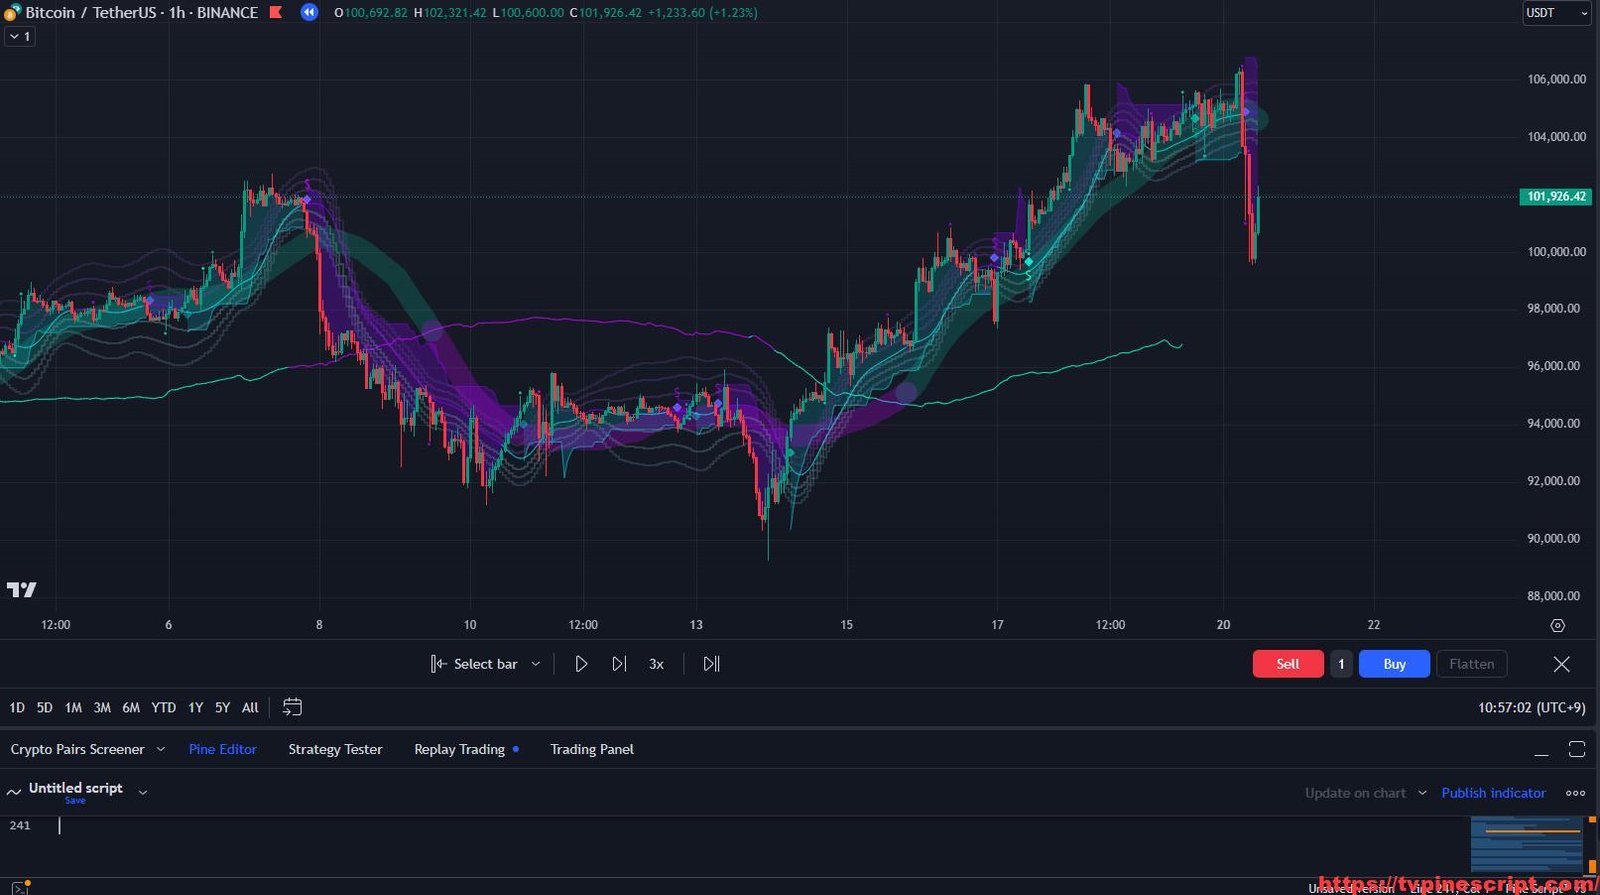
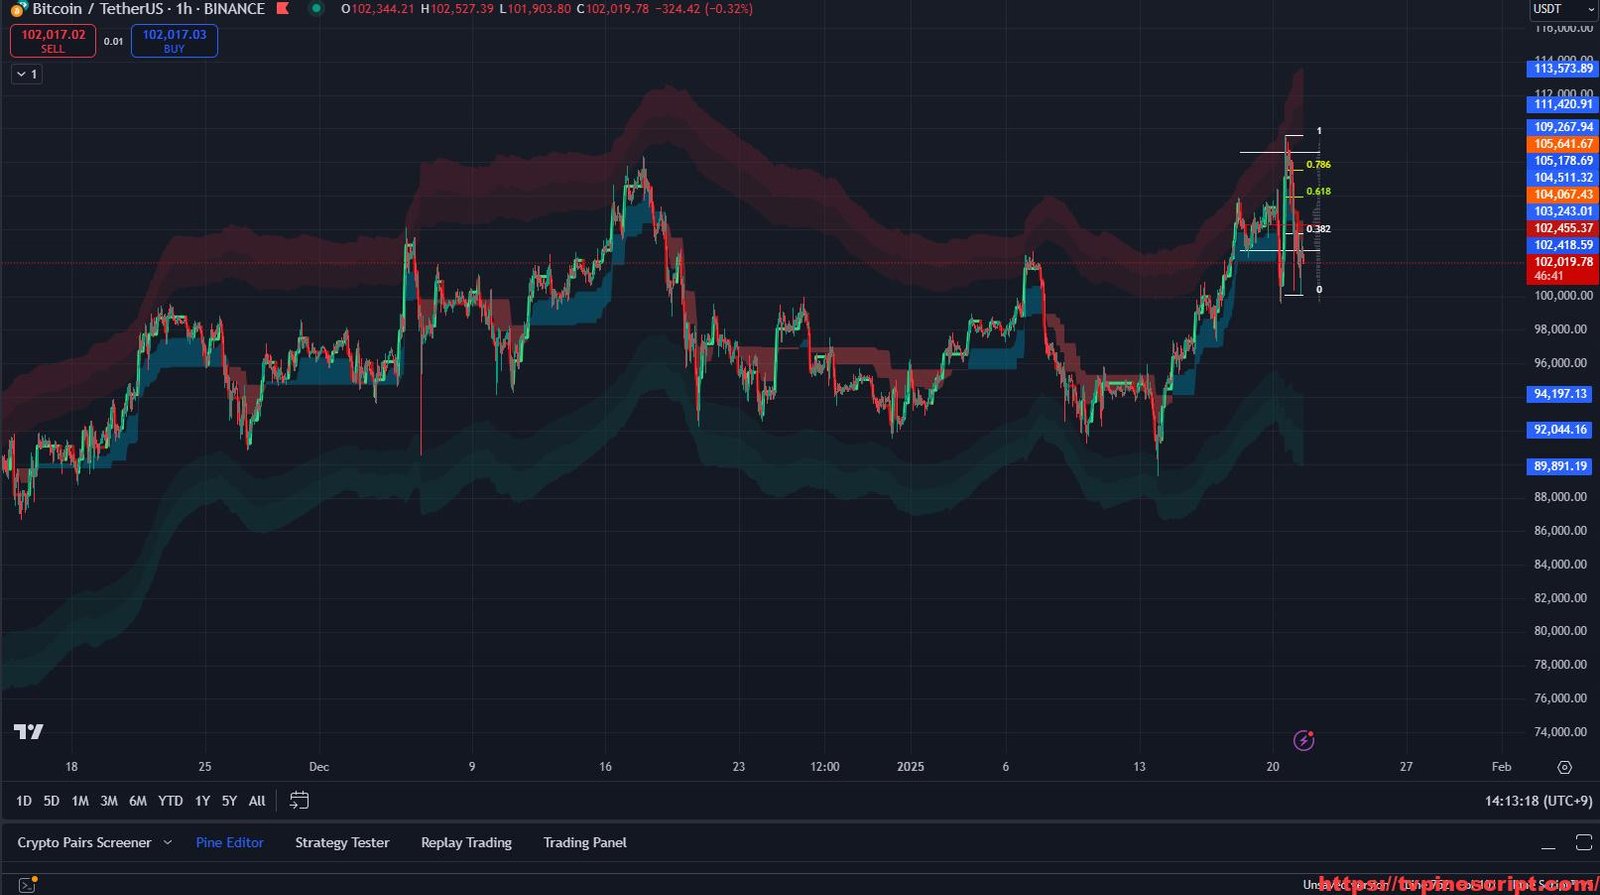
- Implements a sophisticated Volume-Weighted Average Price (VWAP) system with multiple standard deviation bands.
- Customizable VWAP length and smoothing factors for different market conditions.
- Includes options to display or hide standard deviation bands for better chart clarity.
- Volume-Based Candle Coloring:
- Enhances traditional candlestick visualization with volume-weighted coloring, helping traders identify high-volume movements.
- Detects bullish and bearish volume spikes based on deviation from the VWAP moving average.
- Zero Lag Predictive Moving Average (ZLPMA):
- Incorporates a predictive moving average calculation to anticipate potential future price movements.
- Helps traders stay ahead of market trends by reducing lag.
- High-Timeframe Integration:
- Supports analysis across multiple timeframes, allowing traders to compare short-term and long-term trends.
- Includes a smoothing feature to reduce noise when using higher timeframes.
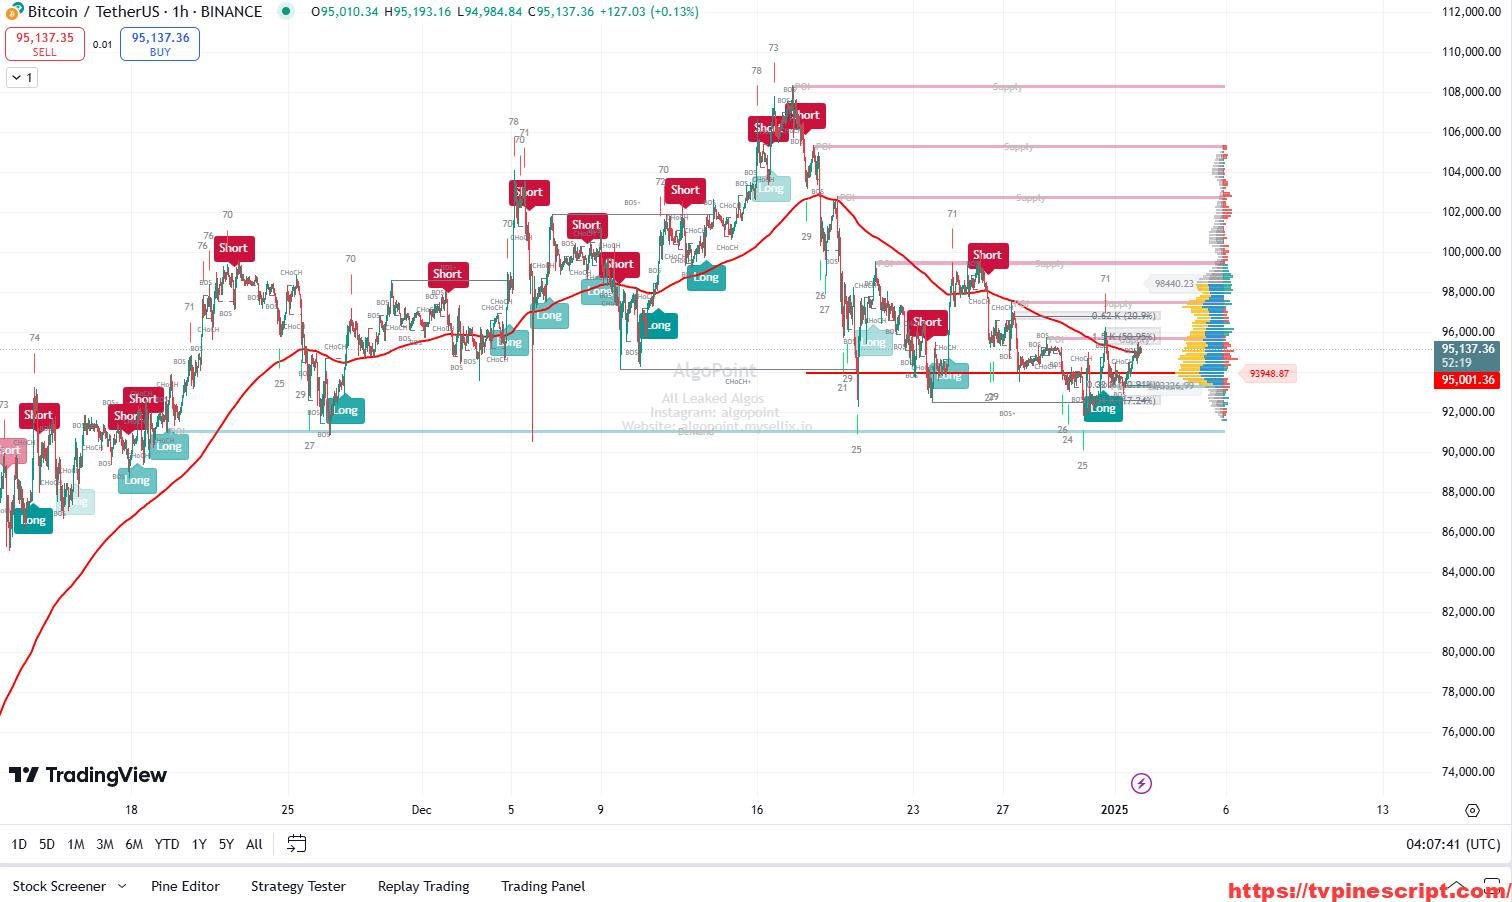
- Smart Risk Management System:
- ATR-based dynamic stop-loss levels (long and short stops) for improved trade management.
- Uses Pi multipliers for setting precise risk thresholds.
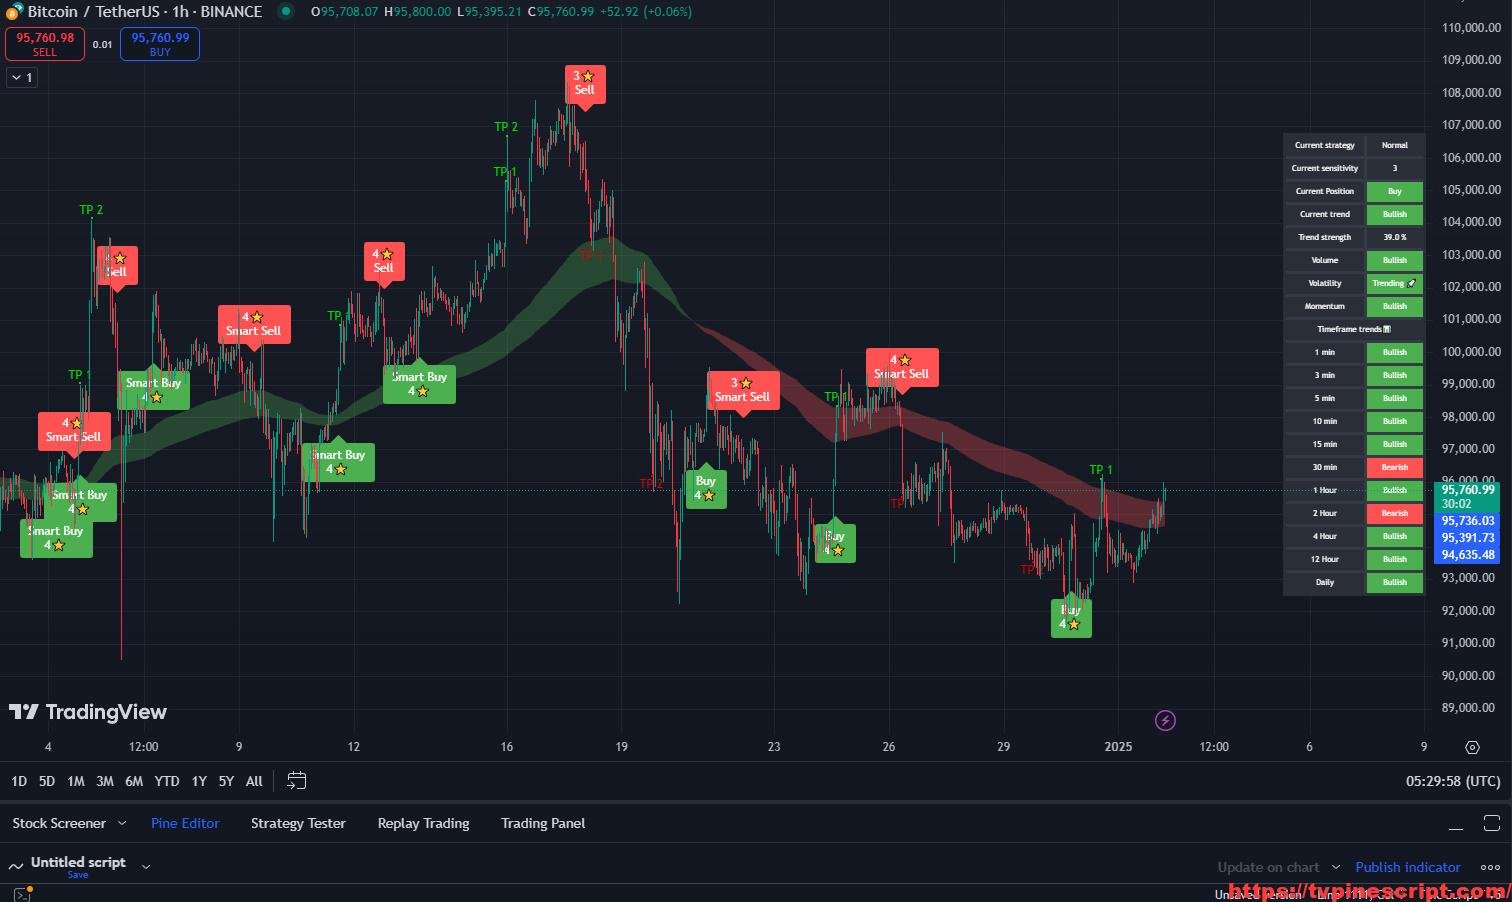
- Momentum and Breakout Detection:
- Detects volume-driven breakout and breakdown events with visual markers for easy identification.
- “Pump Up” and “Pump Down” signals alert traders to significant momentum shifts.
- Custom Alerts and Notifications:
- Built-in alert system for trade entries and exits.
- Alerts for volume surges, trend changes, and breakout confirmations.
- Enhanced Visuals and User-Friendly Options:
- Customizable labels, trendline colors, and VWAP deviations.
- Includes an option to highlight market conditions with color-coded bars.
Recommended Usage:
- Scalping:
- Best suited for 5-minute to 15-minute charts.
- Use VWAP bands and volume-based signals for quick entry and exit decisions.
- Swing Trading:
- Effective on 1-hour to 4-hour charts.
- Combine zero-lag moving averages and ATR-based stops for medium-term trades.
- Intraday Trading:
- Recommended for 30-minute to 1-hour charts.
- Utilize VWAP deviation bands and momentum breakouts for precision trade entries.
- Risk Management:
- Leverage ATR-based stop-loss levels and take-profit targets to optimize risk/reward ratios.
- Apply dynamic VWAP positioning to track institutional activity zones.
Script Evaluation:
- Functionality: 4.8/5
The script offers a versatile trading solution that combines trend detection, risk management, and volume-based market insights. - Ease of Use: 4.3/5
While feature-rich, traders may require time to fully explore and configure the available options. - Accuracy: 4.7/5
Provides reliable signals when used with the recommended settings and timeframes. - Repainting Analysis:
This script does not repaint.
All calculations rely on confirmed bar data, making it reliable for both backtesting and live trading. - Optimal Timeframes:
- Scalping: 5-minute to 15-minute charts.
- Swing Trading: 1-hour to 4-hour charts.
- Day Trading: 30-minute to 1-hour charts.
- Author and Development Quality:
The script appears to be developed by a professional, but the author remains unnamed. It shows a solid understanding of VWAP-based trading strategies with an emphasis on precision trading. - Overall Score: 4.7/5
A powerful trading tool, ideal for both beginners and experienced traders looking to enhance their market insights with VWAP-based strategies.
//@version=5
indicator("S.A.M.M.I 🤖 VWAP SB[ɅI]", overlay=true, max_labels_count = 500, max_lines_count = 500, max_boxes_count = 500, max_bars_back = 5000, timeframe='')

string GROUP_PLS                     = 'Labels'
bool showLabelsPriceScaleInput          = input.bool(false, 'Show Labels on Price Scale.', tooltip="", group=GROUP_PLS)
// options
labelDisplay = showLabelsPriceScaleInput ? display.all : display.pane // , editable = false, display=labelDisplay)

// Simple Vector Candles
vlength = input.int(9, 'Vector Candle Volume Lookback', minval=3)
avrg = ta.vwma(volume, vlength)
vold0 = volume > avrg * 1.88 and close < open
vold1 = volume > avrg * 1.44 and volume <= avrg * 1.87 and close < open
vold2 = volume > avrg * 1.22 and volume <= avrg * 1.43 and close < open
vold3 = volume >= avrg * 0.90 and volume <= avrg * 1.21 and close < open
vold4 = volume < avrg * 0.60 and volume <= avrg * 0.89 and close < open
vold5 = volume < avrg * 0.30 and close < open

volu0 = volume > avrg * 1.88 and close > open,
volu1 = volume > avrg * 1.44 and volume <= avrg * 1.87 and close > open
volu2 = volume > avrg * 1.44 and volume <= avrg * 1.43 and close > open
volu3 = volume >= avrg * 0.90 and volume <= avrg * 1.21 and close > open
volu4 = volume < avrg * 0.60 and volume <= avrg * 0.89 and close > open
volu5 = volume < avrg * 0.30 and close < open

cold0 = color.rgb(200, 0, 255, 11)
cold1 = color.rgb(180, 0, 255, 22)
cold2 = color.rgb(160, 0, 255, 33)
cold3 = color.rgb(140, 0, 255, 44)
cold4 = color.rgb(120, 0, 255, 55)
cold5 = color.rgb(100, 0, 255, 66)

colu0 = color.rgb(0, 255, 200, 11)
colu1 = color.rgb(0, 225, 160, 22)
colu2 = color.rgb(0, 205, 140, 33)
colu3 = color.rgb(0, 195, 120, 44)
colu4 = color.rgb(0, 185, 100, 55)
colu5 = color.rgb(0, 175, 100, 66)

pumpup = not volu5 and not volu4 and not volu3 and ta.crossover(close, ohlc4) and volume>avrg and barstate.isconfirmed and volume>volume[1] and (close-low)/(high-low)>0.6
pumpdown = not vold5 and not vold4 and not vold3 and ta.crossunder(close, hlcc4) and volume>avrg and barstate.isconfirmed and volume>volume[1] and (close-low)/(high-low)<0.6

color_1 = vold0 ? cold0 : vold1 ? cold1 : vold2 ? cold2 : vold3 ? cold3 : vold4 ? cold4 : vold5 ? cold5 : volu0 ? colu0 : volu1 ? colu1 : volu2 ? colu2 : volu3 ? colu3 : volu4 ? colu4 : volu5 ? colu5 : na

plotcandle(open, high, low, close, title=' Vector Candle', color=(open < close) ? color_1 : color_1, wickcolor=color_1, bordercolor=color_1, editable = false, display=labelDisplay)

// S.imple A.verage M.oving M.oney I.ndex
import TradingView/ta/7
zlength = input(title='SMA', defval=188)
z2length = ta.sma(hl2, 200)
z3length = ta.sma(hl2, 50)
mfi = ta.mfi(hl2, 188)
zoffset = input(title='Offset', defval=-1)
zsrc = hl2
lsma1 = ta.linreg(zsrc, zlength, zoffset)
lsma2 = ta.linreg(z3length, zlength, zoffset)
lsma3 = ta.linreg(z2length, zlength, zoffset)
eq1 = z3length - z2length + mfi
zerosma = z3length + eq1 * 0.11

var GRP1 = "VWAP" //VWAP INPUTS
_len = input(18, 'VWAP 18 Length', group = GRP1)
HTF = input.timeframe("15", "Resolution", group = GRP1)
showStd = input(true, 'Show Deviations', group = GRP1)
fill_bands = input(false, 'Fill Std Dev bands')
stDevMultiplier_1 = input(0.3, "StDev mult 1", group = GRP1)
stDevMultiplier_2 = input(0.6, "StDev mult 2", group = GRP1)
stDevMultiplier_3 = input(0.9, "StDev mult 2", group = GRP1)
var GRP2 = "HTF PARAMETERS"
HTF_switch = input(true, "Use HTF input", group = GRP2)
HTFRepaints = input(false, "Allow HTF Repainting", group = GRP2)
HTF_Smooth = input(true,  "Smooth Higher Timeframes", group = GRP2)
HTF_Smooth_len = input.int(3, "Smoothing Factor", minval = 1, group = GRP2)

var string calcGroup = 'Perfect Risk' // Risk Signals
length = input.int(title='Three', defval=3, group=calcGroup)
mult = input.float(title='Pi Multiplier', step=0.1, defval=3.14, group=calcGroup)
useClose = input.bool(title='Use Close Price for Extremums', defval=true, group=calcGroup)

var string visualGroup = 'Visuals'
showLabels = input.bool(title='Show $', defval=true, group=visualGroup)
highlightState = input.bool(title='Highlight State', defval=true, group=visualGroup)

var string alertGroup = 'Alerts'
awaitBarConfirmation = input.bool(title="Await Bar Confirmation", defval=false, group=alertGroup)

// Zero Lag Predictive Average Movement
LongPeriod = 188.8
ShortPeriod = 166.6
ExtraTimeForward = 3.3
// Zero Lag Predictive Moving Average Logic and Plot
p1 = 4.1 / (LongPeriod + 1.0)
p3 = 2.1 / (ShortPeriod - 1.0)
q1 = (LongPeriod - 1.0) / 2.0
q3 = (ShortPeriod + 1.0) * 2.0
t = LongPeriod / ExtraTimeForward
ma1 = hl2
ma3 = ma1
val = ma1
slope1 = ma1
predict = ma1
ExtBuffer = ma1
for i = 1 to LongPeriod by 1
    val := close[i]
    ma1 := p1 * val + (1.0 - p1) * ma1
    ma3 := p3 * val + (1.0 - p3) * ma3
    slope1 := (ma3 - ma1) / (q1 - q3)
    predict := ma3 + slope1 * t
    ExtBuffer := predict
    ExtBuffer
// zlPMA Plot
plot(ExtBuffer, color=close > ExtBuffer ? color.rgb(0, 255, 200, 11) : color.rgb(200, 0, 255, 11), offset = -24, linewidth=1, editable = false, display=labelDisplay)
// SAMMI Plot
zcolorchange = true
zColor = zcolorchange ? z2length > z3length[1] ? color.rgb(200, 0, 255, 75) : color.rgb(0, 255, 200, 85) : color.rgb(255, 255, 255, 33)
plot(zerosma, title='SAMMIzl', linewidth=22, color=zColor, editable = false, display=labelDisplay)

// Rolling VWAP Fractal
computeVWAP(src, vol, len, stDevMultiplier1, stDevMultiplier2, stDevMultiplier3) =>
    sumSrcVol = 0.001
    sumVol = 0.001
    sumSrcSrcVol = 0.001
    for i = 1 to len - 1 by 1
        sumSrcVol := vol[i] + sumSrcVol
        sumVol := vol[i] * src[i] + sumVol
        sumSrcSrcVol := vol[i] * math.pow(src[i], 2) + sumSrcSrcVol
        sumSrcSrcVol

    _vwap = sumVol / sumSrcVol
    variance = sumSrcSrcVol / sumSrcVol - math.pow(_vwap, 2)
    variance := variance < 0 ? 0 : variance
    stDev = math.sqrt(variance)

    upperBand3 = _vwap + stDev * stDevMultiplier3
    upperBand2 = _vwap + stDev * stDevMultiplier2
    upperBand1 = _vwap + stDev * stDevMultiplier1
    lowerBand1 = _vwap - stDev * stDevMultiplier1
    lowerBand2 = _vwap - stDev * stDevMultiplier2
    lowerBand3 = _vwap - stDev * stDevMultiplier3

    [_vwap, upperBand3, upperBand2, upperBand1, lowerBand1, lowerBand2, lowerBand3 ]

// ————— Converts current "timeframe.multiplier" plus the TF into minutes of type float.
f_resInMinutes() =>
    _resInMinutes = timeframe.multiplier * (
      timeframe.isseconds ? 1. / 60. :
      timeframe.isminutes ? 1.       :
      timeframe.isdaily   ? 1440.    :
      timeframe.isweekly  ? 10080.   :
      timeframe.ismonthly ? 43800.   : na)

// ————— Returns resolution of _resolution period in minutes.
f_tfResInMinutes(_res) =>
    // _res: resolution of any TF (in "timeframe.period" string format).
    request.security(syminfo.tickerid, _res, f_resInMinutes())

// Returns the theoretical numbers of current chart bars in the given target HTF resolution (note that this number maybe very different from actual number on certain symbols).
f_theoreticalDilationOf(_res) =>
    // _res: resolution of any TF (in "timeframe.period" string format).
    f_tfResInMinutes(_res) / f_resInMinutes()

//

// VWAP Logic
src = hl2
vol = ta.vwap(volume) * 0.0016
_mult = f_theoreticalDilationOf(HTF)
// ---------- RVWAP ---------- //
[rVWAP, stup3, stup2, stup1, stdn1, stdn2, stdn3] = computeVWAP(src, vol, HTF_switch ? _len : _len * _mult, stDevMultiplier_1, stDevMultiplier_2, stDevMultiplier_3)
vHtfSmoothLen = math.max(1, _len / HTF_Smooth_len)
rVWAP_out = not HTF_switch ? rVWAP : HTFRepaints ? request.security(syminfo.tickerid, HTF, rVWAP) : request.security(syminfo.tickerid, HTF, rVWAP[1], lookahead = barmerge.lookahead_on)
rVWAP_out := HTF_switch and HTF_Smooth ? ta.sma(ta.wma(ta.rma(rVWAP_out, vHtfSmoothLen), vHtfSmoothLen), vHtfSmoothLen) : rVWAP_out
stup3_out = not HTF_switch ? stup3 : HTFRepaints ? request.security(syminfo.tickerid, HTF, stup3) : request.security(syminfo.tickerid, HTF, stup3[1], lookahead = barmerge.lookahead_on)
stup3_out := HTF_switch and HTF_Smooth ? ta.sma(ta.ema(ta.ema(stup3_out, vHtfSmoothLen), vHtfSmoothLen), vHtfSmoothLen) : stup3_out
stup2_out = not HTF_switch ? stup2 : HTFRepaints ? request.security(syminfo.tickerid, HTF, stup2) : request.security(syminfo.tickerid, HTF, stup2[1], lookahead = barmerge.lookahead_on)
stup2_out := HTF_switch and HTF_Smooth ? ta.sma(ta.ema(ta.ema(stup2_out, vHtfSmoothLen), vHtfSmoothLen), vHtfSmoothLen) : stup2_out
stup1_out = not HTF_switch ? stup1 : HTFRepaints ? request.security(syminfo.tickerid, HTF, stup1) : request.security(syminfo.tickerid, HTF, stup1[1], lookahead = barmerge.lookahead_on)
stup1_out := HTF_switch and HTF_Smooth ? ta.sma(ta.ema(ta.ema(stup1_out, vHtfSmoothLen), vHtfSmoothLen), vHtfSmoothLen) : stup1_out
stdn1_out = not HTF_switch ? stdn1 : HTFRepaints ? request.security(syminfo.tickerid, HTF, stdn1) : request.security(syminfo.tickerid, HTF, stdn1[1], lookahead = barmerge.lookahead_on)
stdn1_out := HTF_switch and HTF_Smooth ? ta.sma(ta.ema(ta.ema(stdn1_out, vHtfSmoothLen), vHtfSmoothLen), vHtfSmoothLen) : stdn1_out
stdn2_out = not HTF_switch ? stdn2 : HTFRepaints ? request.security(syminfo.tickerid, HTF, stdn2) : request.security(syminfo.tickerid, HTF, stdn2[1], lookahead = barmerge.lookahead_on)
stdn2_out := HTF_switch and HTF_Smooth ? ta.sma(ta.ema(ta.ema(stdn2_out, vHtfSmoothLen), vHtfSmoothLen), vHtfSmoothLen) : stdn2_out
stdn3_out = not HTF_switch ? stdn3 : HTFRepaints ? request.security(syminfo.tickerid, HTF, stdn3) : request.security(syminfo.tickerid, HTF, stdn3[1], lookahead = barmerge.lookahead_on)
stdn3_out := HTF_switch and HTF_Smooth ? ta.sma(ta.ema(ta.ema(stdn3_out, vHtfSmoothLen), vHtfSmoothLen), vHtfSmoothLen) : stdn3_out

// ---------- VWAP Plots ---------- //
fill_colup = color.rgb(0, 0, 0, 100)
fill_colmid = color.rgb(0, 0, 0, 100)
fill_coldown = color.rgb(0, 0, 0, 100)
rVWAP_col = not HTF_switch ? hl2 > rVWAP ? color.rgb(0, 240, 255, 25) : color.rgb(140, 0, 255, 25) : hl2 > rVWAP_out ? color.rgb(0, 240, 255, 25) : color.rgb(140, 0, 255, 25)
Mid = plot(rVWAP_out, color = rVWAP_col, style=plot.style_line, linewidth=0, editable = false, display=labelDisplay)
s3up_A = plot(showStd ? stup3_out : na, title='VWAP - STDEV 3U', color=color.rgb(102, 63, 152, 75), style=plot.style_stepline, linewidth=2, editable = false, display=labelDisplay)
s2up_A = plot(showStd ? stup2_out : na, title='VWAP - STDEV 2U', color=color.rgb(102, 63, 152, 70), style=plot.style_stepline, linewidth=2, editable = false, display=labelDisplay)
s1up_A = plot(showStd ? stup1_out : na, title='VWAP - STDEV 1U', color=color.rgb(102, 63, 152, 65), style=plot.style_stepline, linewidth=2, editable = false, display=labelDisplay)
s1dn_A = plot(showStd ? stdn1_out : na, title='VWAP - STDEV 1D', color=color.rgb(102, 149, 163, 65), style=plot.style_stepline, linewidth=2, editable = false, display=labelDisplay)
s2dn_A = plot(showStd ? stdn2_out : na, title='VWAP - STDEV 2D', color=color.rgb(102, 149, 163, 70), style=plot.style_stepline, linewidth=2, editable = false, display=labelDisplay)
s3dn_A = plot(showStd ? stdn3_out : na, title='VWAP - STDEV 3D', color=color.rgb(102, 149, 163, 75), style=plot.style_stepline, linewidth=2, editable = false, display=labelDisplay)

fill(s3up_A, s1up_A, color = fill_bands ? fill_colup : na)
fill(s2up_A, s1up_A, color = fill_bands ? fill_colup : na)
fill(s1up_A, Mid, color = fill_bands ? fill_colmid : na)
fill(s1dn_A, Mid, color = fill_bands ? fill_colmid : na)
fill(s2dn_A, s1dn_A, color = fill_bands ? fill_coldown : na)
fill(s3dn_A, s1dn_A, color = fill_bands ? fill_coldown : na)
//

// Risk Signals Logic
atr = mult * ta.atr(length)
longStop = (useClose ? ta.highest(ohlc4, length) : ta.highest(length)) - atr
longStopPrev = nz(longStop[1], longStop)
longStop := not volu5 and close[1] > longStopPrev ? math.max(longStop, longStopPrev) : longStop
shortStop = (useClose ? ta.lowest(hlcc4, length) : ta.lowest(length)) + atr
shortStopPrev = nz(shortStop[1], shortStop)
shortStop := not vold5 and open[1] < shortStopPrev ? math.min(shortStop, shortStopPrev) : shortStop

var int dir = 1
dir := close > shortStopPrev ? 1 : close < longStopPrev ? -1 : dir
var color longFillColor = color.rgb(0, 240, 255, 85)
var color shortFillColor = color.rgb(140, 0, 255, 75)
midPricePlot = plot(ohlc4, title='', style=plot.style_line, linewidth=0, display=display.none, editable=false)
longStateFillColor = highlightState ? dir == 1 ? longFillColor : na : na
shortStateFillColor = highlightState ? dir == -1 ? shortFillColor : na : na

// Risk Signals Plot
longStopPlot = plot(dir == 1 ? longStop : na, title='Long Stop', style=plot.style_linebr, linewidth=1, color=color.new(longFillColor, 50), editable = false, display=labelDisplay)
buySignal = not volu5 and dir == 1 and dir[1] == -1
shortStopPlot = plot(dir == 1 ? na : shortStop, title='Short Stop', style=plot.style_linebr, linewidth=1, color=color.new(shortFillColor, 50), editable = false, display=labelDisplay)
sellSignal = not vold5 and dir == -1 and dir[1] == 1

plotshape(pumpup, title='volUP', location=location.belowbar, style=shape.circle, color=color_1)
plotshape(buySignal ? longStop : na, title='Trade Start', location=location.belowbar, style=shape.diamond, size=size.tiny, color=color_1)
plotshape(buySignal and showLabels ? longStop : na, title='Enter', text='$', location=location.belowbar, style=shape.diamond, size=size.tiny, color=color.new(longFillColor, 70), textcolor=color_1)

plotshape(pumpdown, title='volDN', location=location.abovebar, style=shape.circle, color=color_1)
plotshape(sellSignal ? shortStop : na, title='Trade Start', location=location.abovebar, style=shape.diamond, size=size.tiny, color=color_1)
plotshape(sellSignal and showLabels ? shortStop : na, title='Exit', text='$', location=location.abovebar, style=shape.diamond, size=size.tiny, color=color.new(longFillColor, 70), textcolor=color_1)

fill(midPricePlot, longStopPlot, title='Long Fill', color=longStateFillColor)
fill(midPricePlot, shortStopPlot, title='Short Fill', color=shortStateFillColor)
//
How to Apply Pine Script in TradingView:
- Open TradingView and log in.
- Navigate to the Pine Script Editor at the bottom of the screen.
- Copy the provided Pine Script code.
- Paste it into the editor and click Save.
- Name the script, e.g., “S.A.M.M.I 🤖 VWAP SB[ɅI].”
- Click Add to Chart to apply it.
- Customize the settings to match your trading preferences.
Additional Trading Tips:
- Combine with RSI for Confirmation:
Use the script alongside RSI (Relative Strength Index) to confirm overbought or oversold conditions before executing trades. - Watch for VWAP Deviation Zones:
When price interacts with outer VWAP bands, it may signal strong reversals or continuation patterns—pay close attention to price action. - Optimize for High Liquidity Periods:
Apply this script during high-volume market hours (e.g., NY or London sessions) for the best results.
Final Thoughts:
The S.A.M.M.I 🤖 VWAP SB[ɅI] script is a sophisticated tool designed for traders who rely on volume-based trading strategies and precision risk management. Its non-repainting nature ensures trustworthy signals, making it an essential tool for both scalpers and swing traders. Whether you’re looking to trade breakouts or manage risk effectively, this indicator provides a well-rounded solution.
RELATED POSTS
View all
NEOICHI Indicator: A Fusion of Ichimoku Clouds and Fibonacci for Precise Market Analysis
January 21, 2025 | by admin
Elite Algo Modded: Advanced Multi-Strategy Trading Tool for Traders
January 3, 2025 | by admin
Consolidate Your Trading Analysis with the Ultimate All-in-One AlgoPoint Script
January 3, 2025 | by admin