AI-Volume Squeeze Candle 🚀 PRO: A Smart Volume-Based Trading Indicator for Precision Entries
January 21, 2025 | by admin
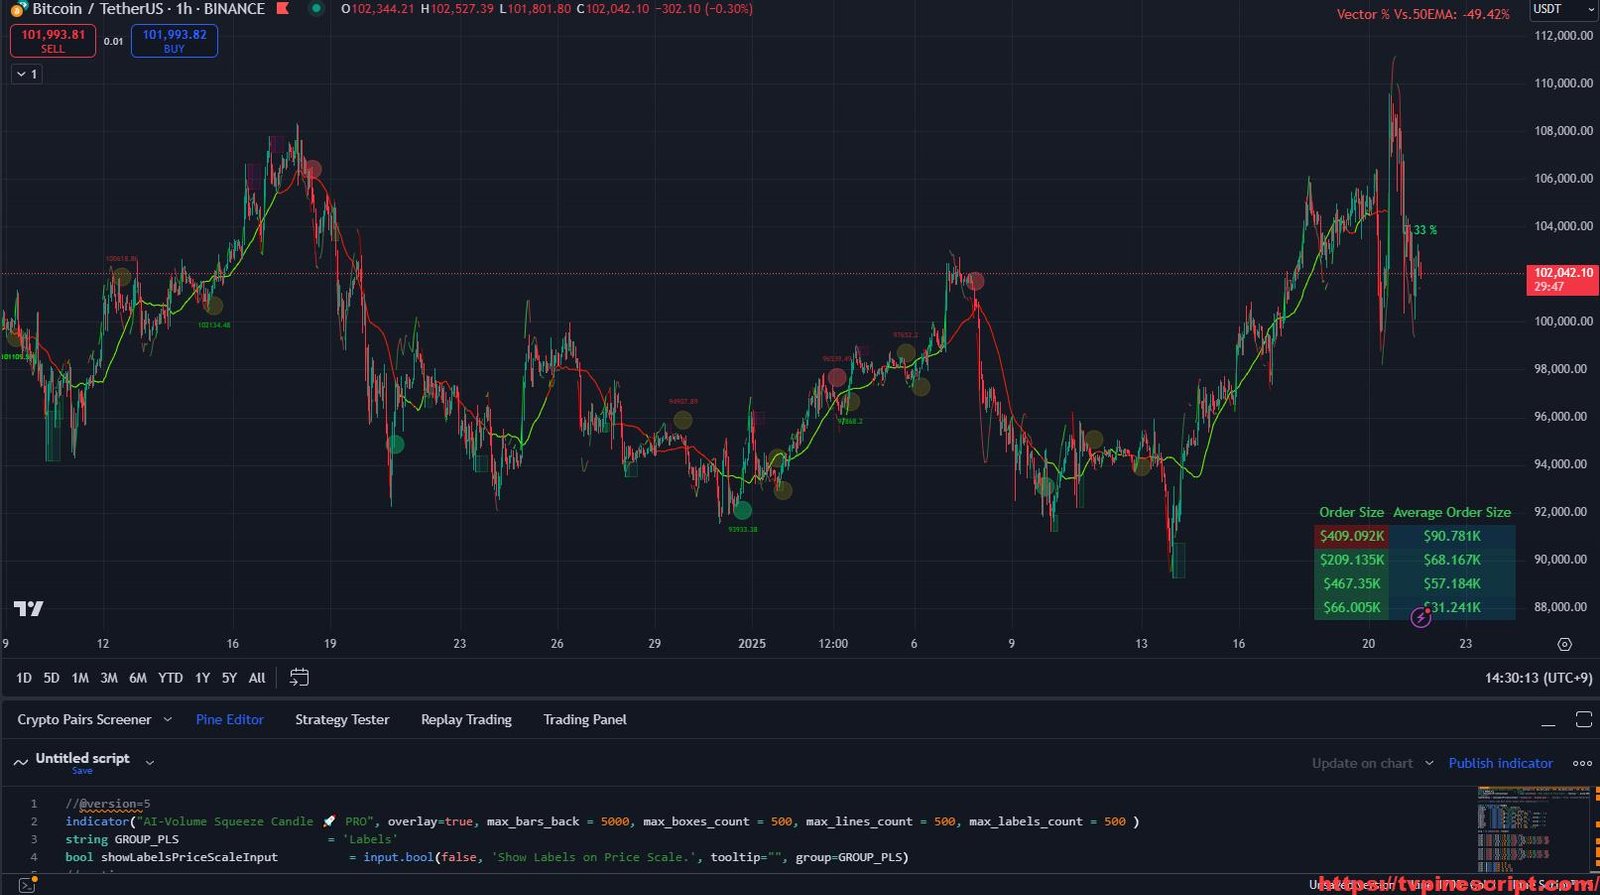
In the fast-paced world of trading, volume analysis plays a critical role in identifying market trends and potential reversals. The AI-Volume Squeeze Candle 🚀 PRO indicator leverages sophisticated algorithms to analyze volume pressure and trend strength, providing traders with actionable insights to optimize their entries and exits. Whether you’re scalping, day trading, or swing trading, this indicator offers a valuable edge in identifying key market turning points.
⚠ Disclaimer: No trading indicator guarantees profits. This tool should be used for reference and strategy development only, with proper risk management in place.
Key Features of the Script:
- Volume Squeeze Detection:
- Analyzes historical and current volume trends to identify potential price squeezes.
- Provides early alerts when volume conditions signal potential breakouts or breakdowns.
- Triple EMA Trend Filtering:
- Uses a Triple Exponential Moving Average (TEMA) to filter out false signals and confirm trend direction.
- Helps traders stay in trends longer and avoid premature exits.
- Custom Volume Levels & Alerts:
- Divides volume into different levels (Extreme, High, Average, Light) with customizable color coding.
- Alerts for significant volume spikes or drops that could indicate institutional activity.
- AI-Powered Market Pressure Analysis:
- Utilizes an RSI-based approach to detect bullish and bearish market pressure zones.
- Plots boxes highlighting critical support and resistance levels based on volume accumulation.
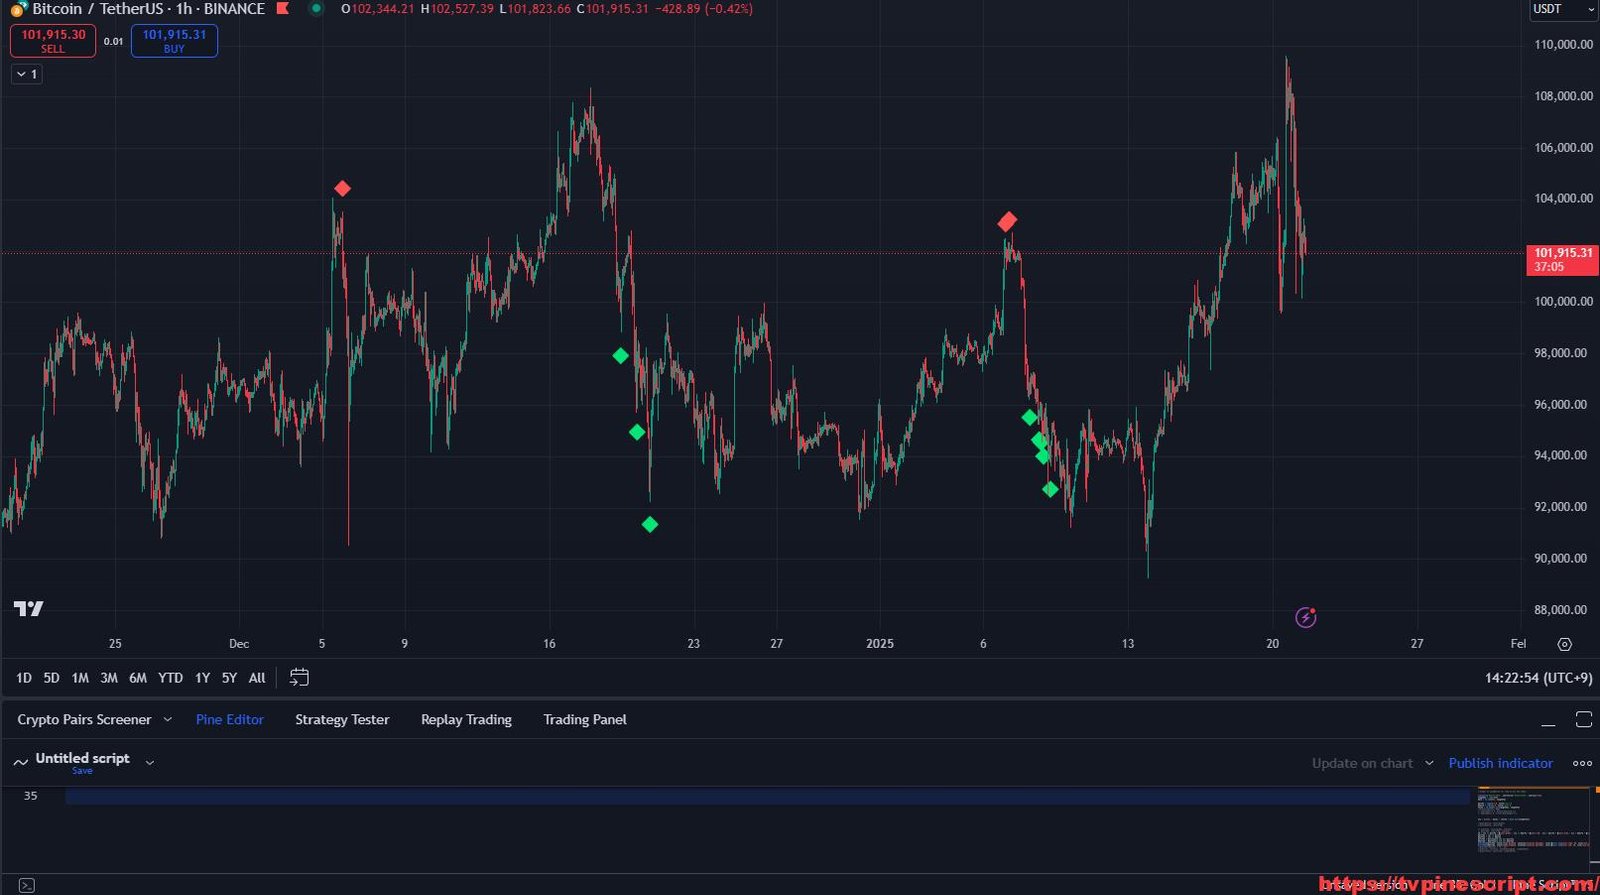
- Buy/Sell Signal Labels:
- Provides clear BUY and SELL signals, customizable for different trading styles.
- Supports both label-based and shape-based signal plotting for clean chart visualization.
- Trend Confirmation with MACD Integration:
- Built-in MACD crossover detection to strengthen entry confirmation.
- Ensures that trades align with broader market trends.
- Dynamic Candle Coloring:
- Candles are color-coded based on volume strength and trend direction, making it easy to interpret market sentiment at a glance.
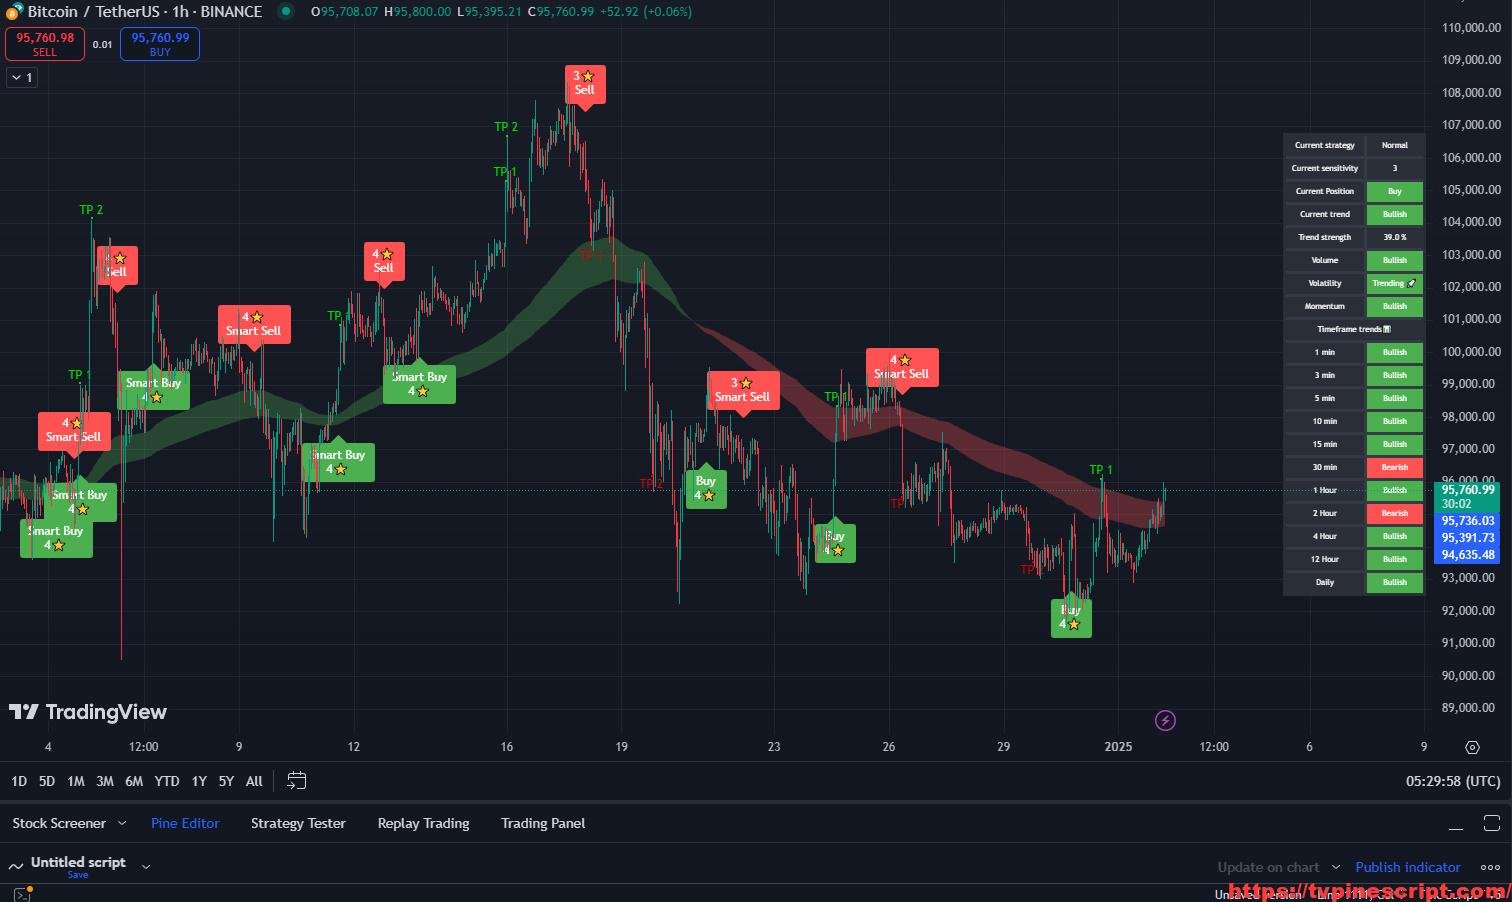
- Multi-Timeframe Analysis (MTA):
- Allows traders to analyze multiple timeframes simultaneously, providing a macro and micro perspective of the market.
- Customizable Noise Filter:
- Helps reduce market noise by smoothing signals with advanced filtering techniques.
- Useful for volatile market conditions where false signals are common.
- Session Volume Analysis:
- Tracks session-wise volume distribution and provides insights into how volume evolves throughout the trading day.
Recommended Usage:
- Scalping:
- Recommended for 1-minute to 5-minute charts.
- Focus on high volume areas and quick entry/exit strategies using TEMA for confirmation.
- Day Trading:
- Best suited for 15-minute to 1-hour charts.
- Utilize volume pressure analysis to align trades with the day’s dominant trend.
- Swing Trading:
- Ideal for 4-hour to daily charts.
- Use volume spikes and trend confirmation for long-term trade positioning.
- Risk Management Strategy:
- Always combine volume signals with stop-loss and take-profit strategies to manage risks.
- Use session volume insights to avoid trading in low-liquidity periods.
Script Evaluation:
- Functionality: 4.8/5
Combines multiple volume and trend indicators into one comprehensive tool. - Ease of Use: 4.2/5
Offers extensive customization, but beginners might need time to understand all features. - Accuracy: 4.6/5
Reliable volume-based signals, but should be used with additional market context. - Repainting Analysis:
This script does not repaint.
All calculations are based on confirmed price data, ensuring signals remain consistent in live trading. - Optimal Timeframes:
- Scalping: 1-minute to 5-minute charts.
- Day Trading: 15-minute to 1-hour charts.
- Swing Trading: 4-hour to daily charts.
- Author and Development Quality:
The script is well-coded with detailed volume analysis, and references industry-standard indicators. - Overall Score: 4.7/5
A powerful tool for traders looking to leverage volume insights for precise market entries.
//@version=5
indicator("AI-Volume Squeeze Candle 🚀 PRO", overlay=true, max_bars_back = 5000, max_boxes_count = 500, max_lines_count = 500, max_labels_count = 500 )
string GROUP_PLS = 'Labels'
bool showLabelsPriceScaleInput = input.bool(false, 'Show Labels on Price Scale.', tooltip="", group=GROUP_PLS)
// options
labelDisplay = showLabelsPriceScaleInput ? display.all : display.pane // , editable = false, display=labelDisplay)
//----------Daily Look Back Vector Candle Color Compression----------//
import TradingView/ta/6
vlength = input.int(9, 'length', minval=1)
lookback = input.int(3, 'Lookback Days')
extLev = input.int(188, 'Extreme', inline = '1')
extCol = input.color(color.rgb(0, 0, 0, 100), '', inline = '1')
highLev = input.int(144, 'High', inline = '2')
highCol = input.color(color.rgb(0, 0, 0, 80), '', inline = '2')
avgLev = input.int(88, 'Average', inline = '3')
avgCol = input.color(color.rgb(0, 0, 0, 50), '', inline = '3')
lightLev = input.int(44, 'Light', inline = '4')
lightCol = input.color(color.rgb(0, 0, 0, 80), '', inline = '4')
dryCol = input.color(color.rgb(0, 0, 0, 100), 'Dry')
avrg = ta.vwma(volume, vlength)
vold0 = volume > avrg * 1.88 and close < open
vold1 = volume > avrg * 1.44 and volume <= avrg * 1.87 and close < open
vold2 = volume > avrg * 1.22 and volume <= avrg * 1.43 and close < open
vold3 = volume >= avrg * 0.90 and volume <= avrg * 1.21 and close < open
vold4 = volume < avrg * 0.60 and volume <= avrg * 0.89 and close < open
vold5 = volume < avrg * 0.30 and close < open
volu0 = volume > avrg * 1.88 and close > open
volu1 = volume > avrg * 1.44 and volume <= avrg * 1.87 and close > open
volu2 = volume > avrg * 1.44 and volume <= avrg * 1.43 and close > open
volu3 = volume >= avrg * 0.90 and volume <= avrg * 1.21 and close > open
volu4 = volume < avrg * 0.60 and volume <= avrg * 0.89 and close > open
volu5 = volume < avrg * 0.30 and close < open
cold0 = color.rgb(255, 0, 0)
cold1 = color.rgb(200, 0, 0, 11)
cold2 = color.rgb(200, 0, 0, 22)
cold3 = color.rgb(255, 45, 45, 33)
cold4 = color.rgb(255, 80, 80, 44)
cold5 = color.rgb(169, 89, 89, 55)
colu0 = color.rgb(4, 255, 0)
colu1 = color.rgb(3, 200, 0, 11)
colu2 = color.rgb(3, 200, 0, 22)
colu3 = color.rgb(75, 255, 75, 33)
colu4 = color.rgb(75, 175, 75, 44)
colu5 = color.rgb(66, 120, 66, 55)
color_1 = vold0 ? cold0 : vold1 ? cold1 : vold2 ? cold2 : vold3 ? cold3 : vold4 ? cold4 : vold5 ? cold5 : volu0 ? colu0 : volu1 ? colu1 : volu2 ? colu2 : volu3 ? colu3 : volu4 ? colu4 : volu5 ? colu5 : na
plotcandle(open, high, low, close, title=' Vector Candle', color=(open < close) ? color_1 : color_1, wickcolor=color_1, bordercolor=color_1, editable = false, display=labelDisplay)
//----------VCLB data----------//
[currentVolume, pastVolume, ratio] = ta.relativeVolume(lookback, 'D', true)
ratio := math.round(ratio*100,0)
//----------VCLB conditions----------//
ratioCol = ratio >= extLev ? extCol : ratio >= highLev ? highCol : ratio >= avgLev ? avgCol : ratio >= lightLev ? lightCol : dryCol
ratioWickCol = ratio >= ratio[1] ? color.green : color.red
//----------VCLB plots----------//
plotcandle(open,high,low,close,color=ratioCol,wickcolor=ratioWickCol, bordercolor=ratioCol, editable = false, display=labelDisplay)
//Vector Scalper//
shc = input(true, title='Plot TEMA?') // Plot Triple EMA
cc = input(true, title='Green/redshift on/off?') // Trend color change?
showtext = input(true, title='Show ATTACK?') // Show buy & sell signals?
uselabel = input(true, title='Use labels? (max 50)') // Use labels or plotshape?
showperc = input(true, title='Show % change since last buy/sell')
nfilter = input(true, title='Noise filter on/off?')
useCurrentRes = input(true, title='Use Current Chart Resolution for filter?')
resCustom = input.timeframe(title='Use Different Timeframe for filter? Uncheck Box Above', defval='60')
len = 6
FfastLength = 13
FslowLength = 26
FsignalLength = 9
// Zero Lag Predictive Moving Average
LongPeriod = 48.8
ShortPeriod = 36.6
ExtraTimeForward = 3.3
// Zero Lag Predictive Moving Average Logic and Plot
p1 = 4.1 / (LongPeriod + 1.0)
p3 = 2.1 / (ShortPeriod - 1.0)
q1 = (LongPeriod - 1.0) / 2.0
q3 = (ShortPeriod + 1.0) * 2.0
t = LongPeriod / ExtraTimeForward
ma1 = hl2
ma3 = ma1
val = ma1
slope1 = ma1
predict = ma1
ExtBuffer = ma1
for i = 1 to LongPeriod by 1
val := close[i]
ma1 := p1 * val + (1.0 - p1) * ma1
ma3 := p3 * val + (1.0 - p3) * ma3
slope1 := (ma3 - ma1) / (q1 - q3)
predict := ma3 + slope1 * t
ExtBuffer := predict
ExtBuffer
plot(ExtBuffer, color=close > ExtBuffer ? color.rgb(115, 255, 0) : color.rgb(255, 30, 0), offset = -24, linewidth=1, editable = false, display=labelDisplay)
//
//Get real Open/Close price
t_id = ticker.new(syminfo.prefix, syminfo.ticker)
realO = request.security(t_id, timeframe.period, open)
t_idc = ticker.new(syminfo.prefix, syminfo.ticker)
realC = request.security(t_idc, timeframe.period, close)
//
//Set persistent variables (buy price, sell price, last transaction type)
buyprice = 0.0
buyprice := nz(buyprice[1])
sellprice = 0.0
sellprice := nz(sellprice[1])
last_tran = false
last_tran := nz(last_tran[1])
//
//Truncate function used for rounding variables
truncate(number, decimals) =>
factor = math.pow(10, decimals)
int(number * factor) / factor
//
//Triple EMA definition
ema1 = ta.ema(realC, len)
ema2 = ta.ema(ema1, FfastLength)
ema3 = ta.ema(ema2, FslowLength)
//
//Triple EMA trend calculation
avg = 3 * (ema1 - ema2) + ema3
out = avg
out1 = request.security(t_id, timeframe.period, out)
ma_up = not volu5 and out1 >= out1[2]
ma_down = not vold5 and out1 < out1[2]
col = cc ? ma_up ? color.rgb(0, 230, 118, 25) : ma_down ? color.rgb(255, 82, 82, 25) : color.rgb(0, 255, 225, 25) : color.rgb(117, 0, 212, 25)
t_UP = ma_up[1] and not volu4
t_DOWN = ma_down[1] and not vold4
t_NON = t_UP == t_DOWN
//
//Filter formula
Fsource = hl2
macd_colorChange = true
Fres = useCurrentRes ? timeframe.period : resCustom
FfastMA = ta.ema(Fsource, FfastLength)
FslowMA = ta.ema(Fsource, FslowLength)
Fmacd = FfastMA - FslowMA
Fsignal = ta.sma(Fmacd, FsignalLength)
outMacD = request.security(syminfo.tickerid, Fres, Fmacd)
outSignal = request.security(syminfo.tickerid, Fres, Fsignal)
Fbuy = t_UP and outMacD >= outSignal or not nfilter
Fsell = t_DOWN and outMacD < outSignal or not nfilter
mee_rsi = ta.rsi(realC, 6) //Wick Pressure 1 & 2
box_length = 3
atr_mult = 0.6
rsi_ob = 66
rsi_os = 44
bull_color = input(defval=color.rgb(0, 255, 0, 85), title="Bull Pressure1", inline="box_color")
bear_color = input(defval=color.rgb(255, 0, 0, 85), title="Bear Pressure1", inline="box_color")
mee_rsi1 = ta.rsi(realC, 9)
box_length1 = 9
atr_1mult =0.6
rsi_ob1 = 77
rsi_os1 = 33
bull_color1 = input(defval=color.rgb(0, 255, 0, 85), title="Bull Pressure2", inline="box_color")
bear_color1 = input(defval=color.rgb(255, 0, 0, 85), title="Bear Pressure2", inline="box_color")
rsi_bullish_cond = mee_rsi < rsi_os or mee_rsi[1] < rsi_os or mee_rsi[2] < rsi_os //Wick Pressure 1 //fast bull wick pressure
ll3 = ta.lowest(low, 3)
lc3 = math.min(ta.lowest(close, 3), ta.lowest(open, 3))
ApisBull1 = low<=lc3 and low[1]<=lc3 and low[2]<=lc3 and open>=lc3 and open[1]>=lc3 and open[2]>=lc3 and lc3-ll3>(atr_mult*ta.atr(6)) and rsi_bullish_cond and close>open
if ApisBull1
box.new(bar_index, lc3, bar_index+box_length, ll3, border_color=bull_color, bgcolor=color.rgb(0, 255, 225, 95))
//
rsi_bearish_cond = mee_rsi > rsi_ob or mee_rsi[1] > rsi_ob or mee_rsi[2] > rsi_ob //fast bear wick pressure
hh3 = ta.highest(high, 3)
hc3 = math.max(ta.highest(close, 3), ta.highest(open, 3))
GrizzlyBear1 = high>=hc3 and high[1]>=hc3 and high[2]>=hc3 and open<=hc3 and open[1]<=hc3 and open[2]<=hc3 and hh3-hc3>(atr_mult*ta.atr(6)) and rsi_bearish_cond and close<open
if GrizzlyBear1
box.new(bar_index, hh3, bar_index+box_length, hc3, border_color=bear_color, bgcolor=color.rgb(255, 0, 255, 95))
//
rsi_bullish_cond1 = mee_rsi1 < rsi_os1 or mee_rsi1[1] < rsi_os1 or mee_rsi1[2] < rsi_os1 // Wick Pressure Level 2 // slow bull wick pressure
ll4 = ta.lowest(low, 3)
lc4 = math.min(ta.lowest(close, 3), ta.lowest(open, 3))
ApisBull2 = low<=lc4 and low[1]<=lc4 and low[2]<=lc4 and open>=lc4 and open[1]>=lc4 and open[2]>=lc4 and lc4-ll4>(atr_1mult*ta.atr(13)) and rsi_bullish_cond1 and close>open
if ApisBull2
box.new(bar_index, lc4, bar_index+box_length1, ll4, border_color=bull_color1, bgcolor=color.rgb(0, 255, 225, 95))
//
rsi_bearish_cond1 = mee_rsi1 > rsi_ob1 or mee_rsi1[1] > rsi_ob1 or mee_rsi1[2] > rsi_ob1 // slowbear wick pressure
hh4 = ta.highest(high, 3)
hc4 = math.max(ta.highest(close, 3), ta.highest(open, 3))
GrizzlyBear2 = high>=hc4 and high[1]>=hc4 and high[2]>=hc4 and open<=hc4 and open[1]<=hc4 and open[2]<=hc4 and hh4-hc4>(atr_1mult*ta.atr(13)) and rsi_bearish_cond1 and close<open
if GrizzlyBear2
box.new(bar_index, hh4, bar_index+box_length1, hc4, border_color=bear_color1, bgcolor=color.rgb(255, 0, 255, 95))
//
// Vector Arc vs 50 EMA
var testTable = table.new(position=position.top_right, columns=1, rows=1, bgcolor=color.rgb(0, 0, 0, 99), border_width=1)
timeRemaining = time_close - timenow
dayinsec = 24 * 3600 * 1000 * 4
DailyTimeClose = time_close('D')
DailyTime = time('D')
WeeklyTimeClose = syminfo.type == 'Weekly' ? time_close : time_close('D') + dayinsec
PercentTimeUsedIntraday = (timenow - time) / (time_close - time) * 100
PercentTimeUsedDaily = (timenow - DailyTime) / (DailyTimeClose - DailyTime) * 100
PercentTimeUsedDaily := PercentTimeUsedDaily > 100 ? 100 : PercentTimeUsedDaily
PercentTimeUsedWeekly = (timenow - DailyTime) / (WeeklyTimeClose - DailyTime) * 100
PercentTimeUsed = timeframe.period == 'W' ? PercentTimeUsedWeekly : timeframe.period == 'D' ? PercentTimeUsedDaily : PercentTimeUsedIntraday
eodvol = barstate.islast and timeRemaining > 0 ? volume / PercentTimeUsed * 100 : volume
IntradaySMALenght = 50 // Indraday 50EMA
volsmalenght = timeframe.period == 'M' ? 6 : timeframe.period == 'W' ? 10 : timeframe.period == 'D' ? 50 : IntradaySMALenght
volsma = ta.ema(eodvol, volsmalenght)
distanceVS50MA = (eodvol - volsma) / volsma * 100
labelcolor = distanceVS50MA > 0 ? color.rgb(76, 175, 80) : color.rgb(255, 82, 82)
day_in_ms = 60 * 60 * 1000
xval = timeframe.isdwm ? timenow + day_in_ms * 24 : timenow
DownVolume = realC < close[1] ? eodvol : 0
UpVolume = realC > close[1] ? eodvol : 0
HighestDownVolume = ta.highest(DownVolume, 3)
HighestUpVolume = ta.highest(UpVolume, 3)
HighestVolume = ta.highest(eodvol, 3)
IsVolumeGreaterHighestDownVolume = eodvol > HighestDownVolume ? 1 : 0
IsVolumeGreaterHighestUpVolume = eodvol > HighestUpVolume ? 1 : 0
IsVolumeGreaterHighestVolume = eodvol >= HighestVolume ? 1 : 0
Vbuy = t_UP and distanceVS50MA > 0 and not HighestDownVolume
Vsell = t_DOWN and distanceVS50MA < 0 and not HighestUpVolume
if barstate.islast
table.cell(table_id=testTable, text_color=labelcolor, column=0, row=0, text='Vector % Vs.50EMA: ' + str.tostring(distanceVS50MA, '#.##') + '%', bgcolor=color.rgb(0, 0, 0, 99))
//
//Triple EMA plot
plot(out1, title='TEMA', style=plot.style_line, linewidth=1, color=color_1, editable = false, display=labelDisplay)
//
//Entry & exit conditions
long = Vbuy and Fbuy and not last_tran and not t_NON and barstate.isconfirmed
short = Vsell and Fsell and last_tran and not t_NON and barstate.isconfirmed
//
if long
buyprice := realC //Set buyprice
last_tran := true //Set long condition
last_tran
if short
sellprice := realC //Set sellprice
last_tran := false //Set short condition
last_tran
//
PercVal = last_tran ? 100 * (realC - buyprice) / buyprice : 100 * (realC - sellprice) / sellprice //Percent change since last buy/sell
PercCol = PercVal >= 0 ? color.lime : color.red //Color of percent text
//
//Plot percent label
if showperc
var label percLab = na
label.delete(percLab)
percLab := label.new(x=bar_index, y=high, yloc=yloc.abovebar, color=color.rgb(100, 100, 100), textcolor=PercCol, style=label.style_none)
label.set_text(id=percLab, text=str.tostring(truncate(PercVal, 2)) + ' %')
//
goodlong = long and buyprice <= sellprice // Buying with a profit?
goodshort = short and sellprice > buyprice // Selling with a profit?
txtlight_b = goodlong ? color.rgb(0, 230, 118, 65) : color.rgb(255, 230, 0, 85) // Buy signal change color depending on profitable or not.
txtlight_s = goodshort ? color.rgb(255, 82, 82, 65) : color.rgb(255, 230, 0, 85) // Sell signal change color depending on profitable or not.
buytxt = str.tostring(truncate(buyprice, 3))
selltxt = str.tostring(truncate(sellprice, 3))
// Alternative 1: Plot buy/sell signals as labels with price indication. Max 50 labels visible.
if uselabel and long and showtext
label.new(bar_index, high, buytxt, yloc=yloc.belowbar, color=txtlight_b, textcolor=color_1, style=label.style_circle, size=size.tiny)
if uselabel and short and showtext
label.new(bar_index, high, selltxt, yloc=yloc.abovebar, color=txtlight_s, textcolor=color_1, style=label.style_circle, size=size.tiny)
// Alternative 2: Plot buy/sell signals as plotshape without price indication. No max.
plotshape(not uselabel and long and showtext, title='Alert', color=color.new(txtlight_b, 0), style=shape.circle, size=size.tiny, location=location.belowbar, editable = false, display=labelDisplay)
plotshape(not uselabel and short and showtext, title='Alert', color=txtlight_s, style=shape.circle, size=size.tiny, location=location.abovebar, editable = false, display=labelDisplay)
//
// Chart Prime Volume Logic
type properties
string volume_style
int candle_average_length
bool enable_average_daily
int daily_volume_average_length
int daily_volume_location_offset
bool enable_table
string location
int window_size
int length
bool enable_time
bool enable_time_delta
bool enable_order_size
bool enable_volume
bool enable_price_change
bool enable_price
bool enable_speed_of_tape
bool enable_average_order_size
bool enable_average_volume
bool enable_volume_ratio
bool enable_average_price_change
bool enable_sensitivity
bool enable_scaled_sensitivity
color bullish_candle_color
color neutral_candle_color
color bearish_candle_color
color sum_candle_avg_color
color bullish_candle_avg_color
color bearish_candle_avg_color
color bullish_table_color
color neutral_table_color
color bearish_table_color
color table_grad_bullish_up
color table_grad_bullish_down
color table_grad_bearish_down
color talbe_grad_bearish_up
color label_neutral_color
color label_bullish_color
color table_color
color text_color
volume_style = input.string(
"Disabled"
, "Volume Style"
, [
"Ratio Columns"
, "Polar"
, "Disabled"
]
, group = "Volume"
)
candle_average_length = input.int(
18
, "Volume Average Length"
, minval = 1
, group = "Volume"
)
enable_average_daily = input.bool(
false
, "Enable Session Volume"
, group = "Session Volume"
)
daily_volume_average_length = input.int(
18
, "Average Session Volume Length"
, minval = 1
, group = "Session Volume"
)
daily_volume_location_offset = input.int(
11
, "Session Volume Location Offset"
, group = "Session Volume"
)
enable_table = input.bool(
true
, "Enable Table"
, group = "Table"
)
location = input.string(
"Bottom Right"
, "Position"
, [
"Bottom Left"
, "Bottom Middle"
, "Bottom Right"
, "Middle Left"
, "Middle Center"
, "Middle Right"
, "Top Left"
, "Top Middle"
, "Top Right"
]
, group = "Table"
)
window_size = input.int(
3
, "Tape Window Size"
, minval = 1
, group = "Table"
)
length = input.int(
18
, "Average Length"
, minval = 1
, group = "Table"
)
enable_time = input.bool(
false
, "Enable Time"
, tooltip = "Time of tick"
, group = "Table"
)
enable_time_delta = input.bool(
false
, "Enable Time Delta"
, tooltip = "Time between ticks"
, group = "Table"
)
enable_order_size = input.bool(
true
, "Enable Order Size"
, tooltip = "Price ✕ Volume"
, group = "Table"
)
enable_volume = input.bool(
false
, "Enable Volume"
, tooltip = "Volume change between ticks"
, group = "Table"
)
enable_price_change = input.bool(
false
, "Enable Price Change"
, tooltip = "Price change between ticks"
, group = "Table"
)
enable_price = input.bool(
false
, "Enable Price"
, tooltip = "Price at tick"
, group = "Table"
)
enable_speed_of_tape = input.bool(
false
, "Enable Speed of Tape"
, tooltip = "Average time delta"
, group = "Table"
)
enable_average_order_size = input.bool(
true
, "Enable Average Order Size"
, tooltip = "Average Volume"
, group = "Table"
)
enable_average_volume = input.bool(
false
, "Enable Average Volume"
, tooltip = "Average tick volume"
, group = "Table"
)
enable_volume_ratio = input.bool(
false
, "Enable Volume Ratio"
, tooltip = "100% is completely bullish, -100% is completely bearish, 0% is completely neutral. (Up Volume ÷ Total Volume - 0.5) ✕ 200."
, group = "Table"
)
enable_average_price_change = input.bool(
false
, "Enable Average Price Change"
, tooltip = "Average absolute price move"
, group = "Table"
)
enable_sensitivity = input.bool(
false
, "Enable Sensitivity"
, tooltip = "This metric aims to provide a scale for how much the price can move for one unit of volume. |Price Change| ÷ Volume Change."
, group = "Table"
)
enable_scaled_sensitivity = input.bool(
false
, "Enable Relative Sensitivity"
, tooltip = "This metric aims to provide a standardized price movement size for the average volume. Sensitivity ✕ Average Volume."
, group = "Table"
)
bullish_candle_color = input.color(
color.rgb(0, 255, 221, 65)
, "Plot Colors"
, inline = "Plot"
, group = "Colors"
)
neutral_candle_color = input.color(
color.rgb(128, 128, 128, 65)
, ""
, inline = "Plot"
, group = "Colors"
)
bearish_candle_color = input.color(
color.rgb(190, 38, 255, 65)
, ""
, inline = "Plot"
, group = "Colors"
)
sum_candle_avg_color = input.color(
color.rgb(121, 121, 121, 65)
, "Column Ratio Average"
, group = "Colors"
)
bullish_candle_avg_color = input.color(
color.rgb(62, 232, 255, 85)
, "Polar Bullish Average"
, group = "Colors"
)
bearish_candle_avg_color = input.color(
color.rgb(166, 63, 255, 85)
, "Polar Bearish Average"
, group = "Colors"
)
bullish_table_color = input.color(
color.rgb(29, 160, 95, 65)
, "Table Polarity"
, inline = "Table"
, group = "Colors"
)
neutral_table_color = input.color(
color.rgb(121, 121, 121, 65)
, ""
, inline = "Table"
, group = "Colors"
)
bearish_table_color = input.color(
color.rgb(212, 15, 15, 65)
, ""
, inline = "Table"
, group = "Colors"
)
table_grad_bullish_up = input.color(
color.rgb(0, 255, 225, 85)
, "Table Bullish Gradient"
, inline = "Bullish Table"
, group = "Colors"
)
table_grad_bullish_down = input.color(
color.rgb(0, 119, 255, 85)
, ""
, inline = "Bullish Table"
, group = "Colors"
)
table_grad_bearish_down = input.color(
color.rgb(255, 0, 0, 85)
, "Table Bearish Gradient"
, inline = "Bearish Table"
, group = "Colors"
)
talbe_grad_bearish_up = input.color(
color.rgb(166, 0, 255, 85)
, ""
, inline = "Bearish Table"
, group = "Colors"
)
label_bullish_color = input.color(
color.rgb(0, 255, 21, 65)
, "Session Volume"
, inline = "Session Color"
, group = "Colors"
)
label_neutral_color = input.color(
color.rgb(121, 121, 121, 65)
, ""
, inline = "Session Color"
, group = "Colors"
)
table_color = input.color(
color.rgb(0, 0, 0, 100)
, "Table Color"
, group = "Colors"
)
text_color = input.color(
color.rgb(73, 253, 106, 25)
, "Table Text"
, group = "Colors"
)
settings = properties.new(
volume_style
, candle_average_length
, enable_average_daily
, daily_volume_average_length
, daily_volume_location_offset
, enable_table
, location
, window_size
, length
, enable_time
, enable_time_delta
, enable_order_size
, enable_volume
, enable_price_change
, enable_price
, enable_speed_of_tape
, enable_average_order_size
, enable_average_volume
, enable_volume_ratio
, enable_average_price_change
, enable_sensitivity
, enable_scaled_sensitivity
, bullish_candle_color
, neutral_candle_color
, bearish_candle_color
, sum_candle_avg_color
, bullish_candle_avg_color
, bearish_candle_avg_color
, bullish_table_color
, neutral_table_color
, bearish_table_color
, table_grad_bullish_up
, table_grad_bullish_down
, table_grad_bearish_down
, talbe_grad_bearish_up
, label_neutral_color
, label_bullish_color
, table_color
, text_color
)
type vec2
float x = 0
float y = 0
type vec3
float x = 0
float y = 0
float z = 0
type tick_data
float price = na
float price_delta = na
float vol = na
bool polarity = na
string t = na
int t_delta = na
string state = na
type volume_data
float bullish = 0
float bearish = 0
float neutral = 0
int bullish_count = 0
int bearish_count = 0
int neutral_count = 0
int total_count = 0
type tape_average
float[] avg
float[] ratio
color[] col
location(location)=>
switch location
"Bottom Left" => position.bottom_left
"Bottom Middle" => position.bottom_center
"Bottom Right" => position.bottom_right
"Middle Left" => position.middle_left
"Middle Center" => position.middle_center
"Middle Right" => position.middle_right
"Top Left" => position.top_left
"Top Middle" => position.top_center
"Top Right" => position.top_right
historical_volume()=>
direction = close > open
rng = high - low
top_body = math.max(open, close)
bottom_body = math.min(open, close)
top_wick_length = high - top_body
bottom_wick_length = bottom_body - low
body_length = top_body - bottom_body
weighted_top_wick_normal_length = top_wick_length * 0.444
weighted_bottom_wick_normal_length = bottom_wick_length * 0.444
weighted_top_wick_neutral_length = top_wick_length * 0.133
weighted_bottom_wick_neutral_length = bottom_wick_length * 0.133
weighted_body_length = body_length * 2
adjusted_rng = weighted_top_wick_normal_length + weighted_bottom_wick_normal_length + weighted_body_length + weighted_top_wick_neutral_length + weighted_bottom_wick_neutral_length
top_wick_neutral = weighted_top_wick_neutral_length / adjusted_rng
bottom_wick_neutral = weighted_bottom_wick_neutral_length / adjusted_rng
top_wick_normal = weighted_top_wick_normal_length / adjusted_rng
bottom_wick_normal = weighted_bottom_wick_normal_length / adjusted_rng
body = weighted_body_length / adjusted_rng
bullish = (direction ? body + bottom_wick_normal : bottom_wick_normal) * volume
bearish = (direction ? top_wick_normal : body + top_wick_normal) * volume
neutral = (top_wick_neutral + bottom_wick_neutral) * volume
vec3.new(bullish, bearish, neutral)
window_avg(float source, int length, bool flag)=>
var average = array.new<float>()
var count = 0
if flag
if count < length
average.push(source)
count += 1
else
average.push(source)
average.shift()
average.avg()
daily_volume(properties settings)=>
var float daily_volume = 0
if session.isfirstbar
daily_volume := 0
daily_volume += volume
flag = session.islastbar and barstate.isconfirmed
avg_daily_volume = window_avg(daily_volume, length, flag)
vec2.new(daily_volume, avg_daily_volume)
method round(float self, int place = 2)=>
math.round(self, place)
method round_to_first_significant(float self)=>
float out = 0
if self < 0.01 and self > -0.01
exponent = math.floor(math.log10(math.abs(self)))
out := math.round(self / math.pow(10, exponent - 1)) * math.pow(10, exponent - 1)
else
out := self.round(2)
nz(out, 0)
method round_to_mintick(float self)=>
math.round_to_mintick(self)
method to_string(float self)=>
str.tostring(self)
method to_string(int self)=>
str.tostring(self)
method format_time(int self, bool ms = false)=>
if ms
if self >= 1000
str.tostring(self/1000) + "s"
else
str.tostring(self) + "ms"
else
str.format("{0,time,HH:mm:ss}", self)
method format_volume(float self)=>
if self >= 9.9
str.tostring(self, format.volume)
else
str.tostring(self.round_to_first_significant())
method ready(tick_data[] self, bool real_time = false)=>
if real_time
self.size() > 0 and barstate.isrealtime
else
self.size() > 0
method color_grad(float self, bool wait_for_new = false, properties settings)=>
varip ready_color = false
varip color colour = na
if barstate.isrealtime
if barstate.isnew or not wait_for_new
ready_color := true
if ready_color
colour := self < 0.5 ?
color.from_gradient(self, 0, 0.5, settings.table_grad_bearish_down, settings.talbe_grad_bearish_up) :
color.from_gradient(self, 0.5, 1, settings.table_grad_bullish_down, settings.table_grad_bullish_up)
else
na
method color_polarity(bool self, properties settings)=>
switch self
true => settings.bullish_table_color
false => settings.bearish_table_color
=> settings.neutral_table_color
get_tick()=>
varip string state = ""
varip float old_price = 0
varip float new_price = 0
varip float price_delta = 0
varip float old_volume = 0
varip float new_volume = 0
varip float volume_delta = 0
varip int old_time = 0
varip int new_time = na
varip float time_delta = 0
varip bool polarity = na
varip bool tick_ready = false
varip float daily_vol = 0
varip float avg_daily_vol = 0
varip tick_data data = tick_data.new()
if barstate.isrealtime
new_price := close
new_volume := volume
new_time := timenow
if barstate.isnew
old_volume := 0
if session.isfirstbar_regular
state := "$"
else
state := "%"
else
state := ""
if tick_ready
price_delta := new_price - old_price
volume_delta := new_volume - old_volume
time_delta := new_time - old_time
if new_price > old_price
polarity := true
if new_price < old_price
polarity := false
if new_price == old_price
polarity := na
old_price := new_price
old_volume := new_volume
old_time := new_time
if tick_ready
data := tick_data.new(new_price, price_delta, volume_delta, polarity, new_time.format_time(), int(time_delta), state)
tick_ready := true
data
get_tape(tick_data tick, properties settings)=>
varip tape = array.new<tick_data>()
varip candle = array.new<tick_data>()
active = not na(tick.price)
if barstate.isrealtime and active
if barstate.isnew
candle.clear()
if tick.vol != 0
tape.unshift(tick)
candle.unshift(tick)
if tape.size() > length
tape.pop()
[tape, candle]
method order_size(tick_data self, bool round = true)=>
switch round
true => math.round_to_mintick(self.vol * self.price)
false => self.vol * self.price
method get_volume(tick_data[] self)=>
varip float bullish = 0
varip float bearish = 0
varip float neutral = 0
varip int bullish_count = 0
varip int bearish_count = 0
varip int neutral_count = 0
varip volume_data data = volume_data.new()
if self.ready(true)
bullish := 0
bearish := 0
neutral := 0
bullish_count := 0
bearish_count := 0
neutral_count := 0
for i = 0 to self.size() - 1
vol = self.get(i).vol
polarity = self.get(i).polarity
bullish += polarity ? vol : 0
bearish += not polarity ? vol : 0
neutral += na(polarity) ? vol : 0
bullish_count += polarity ? 1 : 0
bearish_count += not polarity ? 1 : 0
neutral_count += na(polarity) ? 1 : 0
data := volume_data.new(bullish, bearish, neutral, bullish_count, bearish_count, neutral_count, self.size())
data
method volume_sum(volume_data self, bool include_neutral = true)=>
if include_neutral
self.bullish + self.bearish + self.neutral
else
self.bullish + self.bearish
method volume_ratio(volume_data self)=>
self.bullish / self.volume_sum()
method volume_dist(volume_data self, bool full = true)=>
sum = self.volume_sum(full)
vec3.new(self.bullish/sum, self.bearish/sum, self.neutral/sum)
method candle_average(volume_data self, properties settings)=>
var ready = false
history = historical_volume()
neutral = history.z / 2
bullish = history.x + neutral
bearish = history.y + neutral
sum = bullish + bearish
var total_avg = array.new<float>()
var bullish_avg = array.new<float>()
var bearish_avg = array.new<float>()
if not barstate.isrealtime
total_avg.unshift(sum)
bullish_avg.unshift(bullish)
bearish_avg.unshift(bearish)
if barstate.isnew
ready := true
if barstate.isrealtime and ready and barstate.isconfirmed
total_avg.unshift(self.volume_sum())
bullish_avg.unshift(self.bullish + self.neutral / 2)
bearish_avg.unshift(self.bearish + self.neutral / 2)
if total_avg.size() > settings.candle_average_length
total_avg.pop()
bullish_avg.pop()
bearish_avg.pop()
vec3.new(total_avg.avg(), bullish_avg.avg(), bearish_avg.avg())
method volume_average(volume_data self, vec3 history, properties settings)=>
varip ready = false
candle_average = self.candle_average(settings)
var lines = array.new<line>()
var float current_total = 0
var float current_bullish = 0
var float current_bearish = 0
var float previous_total = na
var float previous_bullish = na
var float previous_bearish = na
neutral = history.z / 2
bullish = history.x + neutral
bearish = history.y + neutral
hist_sum_avg = ta.sma(volume, settings.candle_average_length)
hist_bullish_avg = ta.sma(bullish, settings.candle_average_length)
hist_bearish_avg = ta.sma(bearish, settings.candle_average_length)
if line.all.size() > 167
line.all.first().delete()
if not ready
if settings.volume_style == "Ratio Columns"
line.new(
bar_index - 1
, hist_sum_avg[1]
, bar_index
, hist_sum_avg
, color = settings.sum_candle_avg_color
, width = 3
)
if settings.volume_style == "Polar"
line.new(
bar_index - 1
, hist_bullish_avg[1]
, bar_index
, hist_bullish_avg
, color = settings.bullish_candle_avg_color
, width = 3
)
line.new(
bar_index - 1
, -hist_bearish_avg[1]
, bar_index
, -hist_bearish_avg
, color = settings.bearish_candle_avg_color
, width = 3
)
if barstate.isrealtime
if barstate.isnew
ready := true
if ready
if na(previous_total)
previous_total := hist_sum_avg[1]
previous_bullish := hist_bullish_avg[1]
previous_bearish := -hist_bearish_avg[1]
current_total := candle_average.x
current_bullish := candle_average.y
current_bearish := -candle_average.z
if settings.volume_style == "Ratio Columns"
line.new(
bar_index - 1
, previous_total
, bar_index
, current_total
, color = settings.sum_candle_avg_color
, width = 3
)
if settings.volume_style == "Polar"
line.new(
bar_index - 1
, previous_bullish
, bar_index
, current_bullish
, color = settings.bullish_candle_avg_color
, width = 3
)
line.new(
bar_index - 1
, previous_bearish
, bar_index
, current_bearish
, color = settings.bearish_candle_avg_color
, width = 3
)
previous_total := current_total
previous_bullish := current_bullish
previous_bearish := current_bearish
method ratio_bar(volume_data self, vec3 history, properties settings)=>
varip ready = false
ratio = self.volume_dist()
sum = self.volume_sum()
ratio_top = sum
ratio_bullish_bottom = ratio_top - ratio_top * ratio.x
ratio_bearish_top = ratio_top * ratio.y
polar_neutral = self.neutral / 2
polar_bullish = self.bullish + polar_neutral
polar_bearish = -(self.bearish + polar_neutral)
if barstate.isrealtime
if barstate.isnew
ready := true
if ready
if settings.volume_style == "Ratio Columns"
box.new(
bar_index - 1
, ratio_top
, bar_index
, ratio_bullish_bottom
, settings.bullish_candle_color
, bgcolor = settings.bullish_candle_color
)
label.new(
bar_index
, 0
, ""
, color = color.new(color.black, 100)
, tooltip =
"Total: " + sum.format_volume() + "\n"
+ "Bull: " + (sum * ratio.x).format_volume() + "\n"
+ "Bear: " + (sum * ratio.y).format_volume() + "\n"
+ "Neutral: " + (sum * ratio.z).format_volume()
)
box.new(
bar_index - 1
, ratio_bullish_bottom
, bar_index
, ratio_bearish_top
, settings.neutral_candle_color
, bgcolor = settings.neutral_candle_color
)
box.new(
bar_index - 1
, ratio_bearish_top
, bar_index
, 0
, settings.bearish_candle_color
, bgcolor = settings.bearish_candle_color
)
if settings.volume_style == "Polar"
box.new(
bar_index - 1
, polar_bullish
, bar_index
, polar_neutral
, settings.bullish_candle_color
, bgcolor = settings.bullish_candle_color
)
label.new(
bar_index
, 0
, ""
, color = color.new(color.black, 100)
, tooltip =
"Total: " + sum.format_volume() + "\n"
+ "Bull: " + (sum * ratio.x).format_volume() + "\n"
+ "Bear: " + (sum * ratio.y).format_volume() + "\n"
+ "Neutral: " + (sum * ratio.z).format_volume()
)
box.new(
bar_index - 1
, -polar_neutral
, bar_index
, polar_bearish
, settings.bearish_candle_color
, bgcolor = settings.bearish_candle_color
)
box.new(
bar_index - 1
, polar_neutral
, bar_index
, -polar_neutral
, settings.neutral_candle_color
, bgcolor = settings.neutral_candle_color
)
if not ready
bullish = history.x
bearish = history.y
neutral = history.z
history_sum = bullish + bearish + neutral
if settings.volume_style == "Ratio Columns"
box.new(
bar_index - 1
, history_sum
, bar_index
, bearish + neutral
, settings.neutral_candle_color
, bgcolor = settings.bullish_candle_color
, border_width = 2
)
label.new(
bar_index
, 0
, ""
, color = color.new(color.black, 100)
, tooltip =
"Total: " + history_sum.format_volume() + "\n"
+ "Bull: " + bullish.format_volume() + "\n"
+ "Bear: " + bearish.format_volume() + "\n"
+ "Neutral: " + neutral.format_volume()
)
box.new(
bar_index - 1
, bearish + neutral
, bar_index
, bearish
, settings.neutral_candle_color
, bgcolor = settings.neutral_candle_color
, border_width = 2
)
box.new(
bar_index - 1
, bearish
, bar_index
, 0
, settings.neutral_candle_color
, bgcolor = settings.bearish_candle_color
, border_width = 2
)
if settings.volume_style == "Polar"
box.new(
bar_index - 1
, bullish + neutral / 2
, bar_index
, neutral / 2
, settings.neutral_candle_color
, bgcolor = settings.bullish_candle_color
, border_width = 2
)
label.new(
bar_index
, 0
, ""
, color = color.new(color.black, 100)
, tooltip =
"Total: " + history_sum.format_volume() + "\n"
+ "Bull: " + bullish.format_volume() + "\n"
+ "Bear: " + bearish.format_volume() + "\n"
+ "Neutral: " + neutral.format_volume()
)
box.new(
bar_index - 1
, neutral / 2
, bar_index
, -neutral / 2
, settings.neutral_candle_color
, bgcolor = settings.neutral_candle_color
, border_width = 2
)
box.new(
bar_index - 1
, -neutral / 2
, bar_index
, -bearish - neutral / 2
, settings.neutral_candle_color
, bgcolor = settings.bearish_candle_color
, border_width = 2
)
method live_average(volume_data self, properties settings)=>
varip avg = array.new<float>()
varip ratio = array.new<float>()
varip col = array.new<color>()
varip tape_average average = na
if barstate.isrealtime
avg.unshift(self.volume_sum()/self.total_count)
ratio.unshift((self.volume_ratio() - 0.5) * 200)
col.unshift(self.volume_ratio().color_grad(false, settings))
if avg.size() > length
avg.pop()
ratio.pop()
col.pop()
average := tape_average.new(avg, ratio, col)
method average_price_per_volume(tick_data[] self, int length = 10)=>
varip avg_price_per_volume = array.new<float>()
varip float avg = 0
if self.ready(true)
avg := 0
if avg_price_per_volume.size() > length
avg_price_per_volume.pop()
for i = 0 to self.size() - 1
tick = self.get(i)
avg += nz(math.abs(tick.price_delta) / tick.vol, 0)
avg_price_per_volume.unshift(avg / self.size())
avg_price_per_volume
method average_abs_price_change(tick_data[] self, int length = 10)=>
varip avg_abs_price_change = array.new<float>()
varip float avg = 0
if self.ready(true)
avg := 0
for i = 0 to self.size() - 1
tick = self.get(i)
avg += math.abs(tick.price_delta)
avg_abs_price_change.unshift(avg / self.size())
avg_abs_price_change
method average_position_size(tick_data[] self, length = 10)=>
varip avg_position_size = array.new<float>()
varip float avg = 0
if self.ready(true)
avg := 0
if avg_position_size.size() > length
avg_position_size.pop()
for i = 0 to self.size() - 1
tick = self.get(i).order_size(false)
avg += tick
avg_position_size.unshift(math.round_to_mintick(avg / self.size()))
avg_position_size
method speed_of_tape(tick_data[] self, int length = 10)=>
varip avg_time = array.new<int>()
varip float avg = 0
if self.ready(true)
avg := 0
if avg_time.size() > length
avg_time.pop()
for i = 0 to self.size() - 1
tick = self.get(i).t_delta
avg += tick
avg_time.unshift(int(avg / self.size()))
avg_time
method set_cell(table self, int column, int row, string word, color bg_color, color text_color, string tip = "")=>
self.cell_set_text(column, row, word)
self.cell_set_text_color(column, row, text_color)
self.cell_set_bgcolor(column, row, bg_color)
self.cell_set_tooltip(column, row, tip)
init_table(tick_data[] tape, properties settings)=>
if tape.ready() and enable_table
tb = table.new(location(settings.location), 16, tape.size() + 1, settings.table_color, frame_color = settings.table_color, frame_width = 2)
tb.set_cell(
0
, 0
, ""
, settings.table_color
, settings.text_color
, "New candle"
)
if settings.enable_time
tb.set_cell(
1
, 0
, "Time"
, settings.table_color
, settings.text_color
, "Time of tick"
)
if settings.enable_time_delta
tb.set_cell(
2
, 0
, "Time Delta"
, settings.table_color
, settings.text_color
, "Time between ticks"
)
if settings.enable_order_size
tb.set_cell(
3
, 0
, "Order Size"
, settings.table_color
, settings.text_color
, "Price ✕ Volume"
)
if settings.enable_volume
tb.set_cell(
4
, 0
, "Volume"
, settings.table_color
, settings.text_color
, "Volume change between ticks"
)
if settings.enable_price_change
tb.set_cell(
5
, 0
, "Price Change"
, settings.table_color
, settings.text_color
, "Price change between ticks"
)
if settings.enable_price
tb.set_cell(
6
, 0
, "Price"
, settings.table_color
, settings.text_color
, "Price at tick"
)
if settings.enable_speed_of_tape
tb.set_cell(
7
, 0
, "Speed of Tape"
, settings.table_color
, settings.text_color
, "Average time delta"
)
if settings.enable_average_order_size
tb.set_cell(
8
, 0
, "Average Order Size"
, settings.table_color
, settings.text_color
, "Average order size"
)
if settings.enable_average_volume
tb.set_cell(
9
, 0
, "Average Volume"
, settings.table_color
, settings.text_color
, "Average tick volume"
)
if settings.enable_volume_ratio
tb.set_cell(
10
, 0
, "Ratio"
, settings.table_color
, settings.text_color
, "100% is completely bullish, -100% is completely bearish, 0% is completely neutral. (Up Volume ÷ Total Volume - 0.5) ✕ 200."
)
if settings.enable_average_price_change
tb.set_cell(
11
, 0
, "Average Price Change"
, settings.table_color
, settings.text_color
, "Average absolute price move"
)
if settings.enable_sensitivity
tb.set_cell(
12
, 0
, "Sensitivity"
, settings.table_color
, settings.text_color
, "This metric aims to provide a scale for how much the price can move for one unit of volume. |Price Change| ÷ Volume Change."
)
if settings.enable_scaled_sensitivity
tb.set_cell(
13
, 0
, "Relative Sensitivity"
, settings.table_color
, settings.text_color
, "This metric aims to provide a standardized price movement size for the average volume. Sensitivity ✕ Average Volume."
)
tb
else
tb = table.new(location(location), 0, 0, settings.table_color)
method set_table(table self, tick_data[] tape, properties settings)=>
tape_volume_average = tape.get_volume().live_average(settings)
speed_of_tape = tape.speed_of_tape(settings.length)
average_price_per_volume = tape.average_price_per_volume(settings.length)
average_position_size = tape.average_position_size(settings.length)
average_abs_price_change = tape.average_abs_price_change(settings.length)
if tape.ready(true) and enable_table
tape_size = tape.size() - 1
print_length = tape_size >= settings.window_size ? settings.window_size : tape_size
for i = 0 to print_length
j = i + 1
tick = tape.get(i)
polarity_color = tick.polarity.color_polarity(settings)
tape_speed = speed_of_tape.get(i)
average = tape_volume_average.avg.get(i)
ratio = tape_volume_average.ratio.get(i)
avg_color = tape_volume_average.col.get(i)
sensitivity = average_price_per_volume.get(i)
average_sensitivity = sensitivity * average
avg_size = average_position_size.get(i)
avg_price_change = average_abs_price_change.get(i)
self.set_cell(
0
, j
, tick.state
, settings.table_color
, settings.text_color
)
if settings.enable_time
self.set_cell(
1
, j
, tick.t
, polarity_color
, settings.text_color
)
if settings.enable_time_delta
self.set_cell(
2
, j
, tick.t_delta.format_time(true)
, polarity_color
, settings.text_color
)
if settings.enable_order_size
self.set_cell(
3
, j
, "$" + tick.order_size().format_volume()
, polarity_color
, settings.text_color
)
if settings.enable_volume
self.set_cell(
4
, j
, tick.vol.format_volume()
, polarity_color
, settings.text_color
)
if settings.enable_price_change
self.set_cell(
5
, j
, "$" + tick.price_delta.to_string()
, polarity_color
, settings.text_color
)
if settings.enable_price
self.set_cell(
6
, j
, "$" + tick.price.to_string()
, polarity_color
, settings.text_color
)
if settings.enable_speed_of_tape
self.set_cell(
7
, j
, tape_speed.format_time(true)
, avg_color
, settings.text_color
)
if settings.enable_average_order_size
self.set_cell(
8
, j
, "$" + avg_size.format_volume()
, avg_color
, settings.text_color
)
if settings.enable_average_volume
self.set_cell(
9
, j
, average.format_volume()
, avg_color
, settings.text_color
)
if settings.enable_volume_ratio
self.set_cell(
10
, j
, ratio.round(2).to_string() + "%"
, avg_color
, settings.text_color
)
if settings.enable_average_price_change
self.set_cell(
11
, j
, "$" + avg_price_change.round_to_mintick().to_string()
, avg_color
, settings.text_color
)
if settings.enable_sensitivity
self.set_cell(
12
, j
, "$" + sensitivity.round_to_first_significant().to_string()
, avg_color
, settings.text_color
)
if settings.enable_scaled_sensitivity
self.set_cell(
13
, j
, "$" + average_sensitivity.round_to_first_significant().to_string()
, avg_color
, settings.text_color
)
daily_lable(properties settings)=>
var label daily_label = label.new(
x = bar_index + 10
, y = 0
, color = color.new(color.red, 100)
, text = ""
, style = label.style_label_center
, textcolor = text_color
)
if enable_average_daily
history = daily_volume(settings)
color daily_volume_color = color.from_gradient(history.x, 0, history.y * 0.8, settings.label_neutral_color, settings.label_bullish_color)
daily_label.set_x(bar_index + settings.daily_volume_location_offset)
daily_label.set_color(daily_volume_color)
daily_label.set_text(
"Session Volume: " + history.x.format_volume() + "\n"
+ "Average Session Volume: " + history.y.format_volume())
main(properties settings)=>
history = historical_volume()
tick = get_tick()
[tape, candle] = get_tape(tick, settings)
candle_volume = candle.get_volume()
candle_average = candle_volume.volume_average(history, settings)
candle_dist_bar = candle_volume.ratio_bar(history, settings)
daily_lable(settings)
tb = init_table(tape, settings)
tb.set_table(tape, settings)
main(settings)
plot(settings.volume_style != "Disabled" ? 0 : na, "0 Line", neutral_candle_color, show_last = 188, editable = false)
//
How to Apply Pine Script in TradingView:
- Open TradingView and log in.
- Go to the Pine Script Editor (bottom of the screen).
- Copy and paste the provided script code.
- Click Save, then name the script (e.g., “AI-Volume Squeeze Candle PRO”).
- Click Add to Chart to apply it.
- Customize settings based on your trading style and preferences.
Additional Trading Tips:
- Combine with Market Structure Analysis:
Use volume signals alongside support and resistance zones for better decision-making. - Avoid Trading in Low Volume Areas:
Focus on periods with high volume for better trade execution and reduced slippage. - Backtest Before Live Trading:
Conduct backtesting to understand how the indicator performs across various market conditions.
Final Thoughts:
The AI-Volume Squeeze Candle 🚀 PRO indicator provides traders with a unique blend of volume, trend, and market pressure analysis. Its dynamic features make it suitable for various trading styles, from scalping to swing trading.
However, success in trading depends on a disciplined approach and sound risk management practices. Trade wisely, and never risk more than you can afford to lose.
Unlock the power of volume analysis and take your trading to the next level with AI-Volume Squeeze Candle 🚀 PRO!
RELATED POSTS
View all
Auto Fibonacci Retracement: Smart Price Level Detection for Precise Trading
January 24, 2025 | by admin
MagicFlakes Indicator: Precision Trading with Custom Volatility and Trend Signals
January 21, 2025 | by admin
Elite Algo Modded: Advanced Multi-Strategy Trading Tool for Traders
January 3, 2025 | by admin