Asset Bender Algo Indicator: A Comprehensive Trading Tool for Trend and Risk Management
January 21, 2025 | by admin
In the world of trading, making informed decisions requires a combination of trend analysis, risk management, and market structure insights. The Asset Bender Algo Indicator is designed to provide traders with dynamic entry and exit signals, automated stop-loss and take-profit levels, and a clear visualization of market trends.
However, it’s crucial to remember that no trading indicator guarantees profits. This script should be used as part of a well-thought-out trading plan that includes proper risk management and market awareness.
Key Features of the Script:
- ATR-Based Trend Detection System:
- Utilizes Average True Range (ATR) to identify uptrends and downtrends with configurable sensitivity.
- Offers traders the flexibility to adjust ATR calculation methods for a more customized approach.
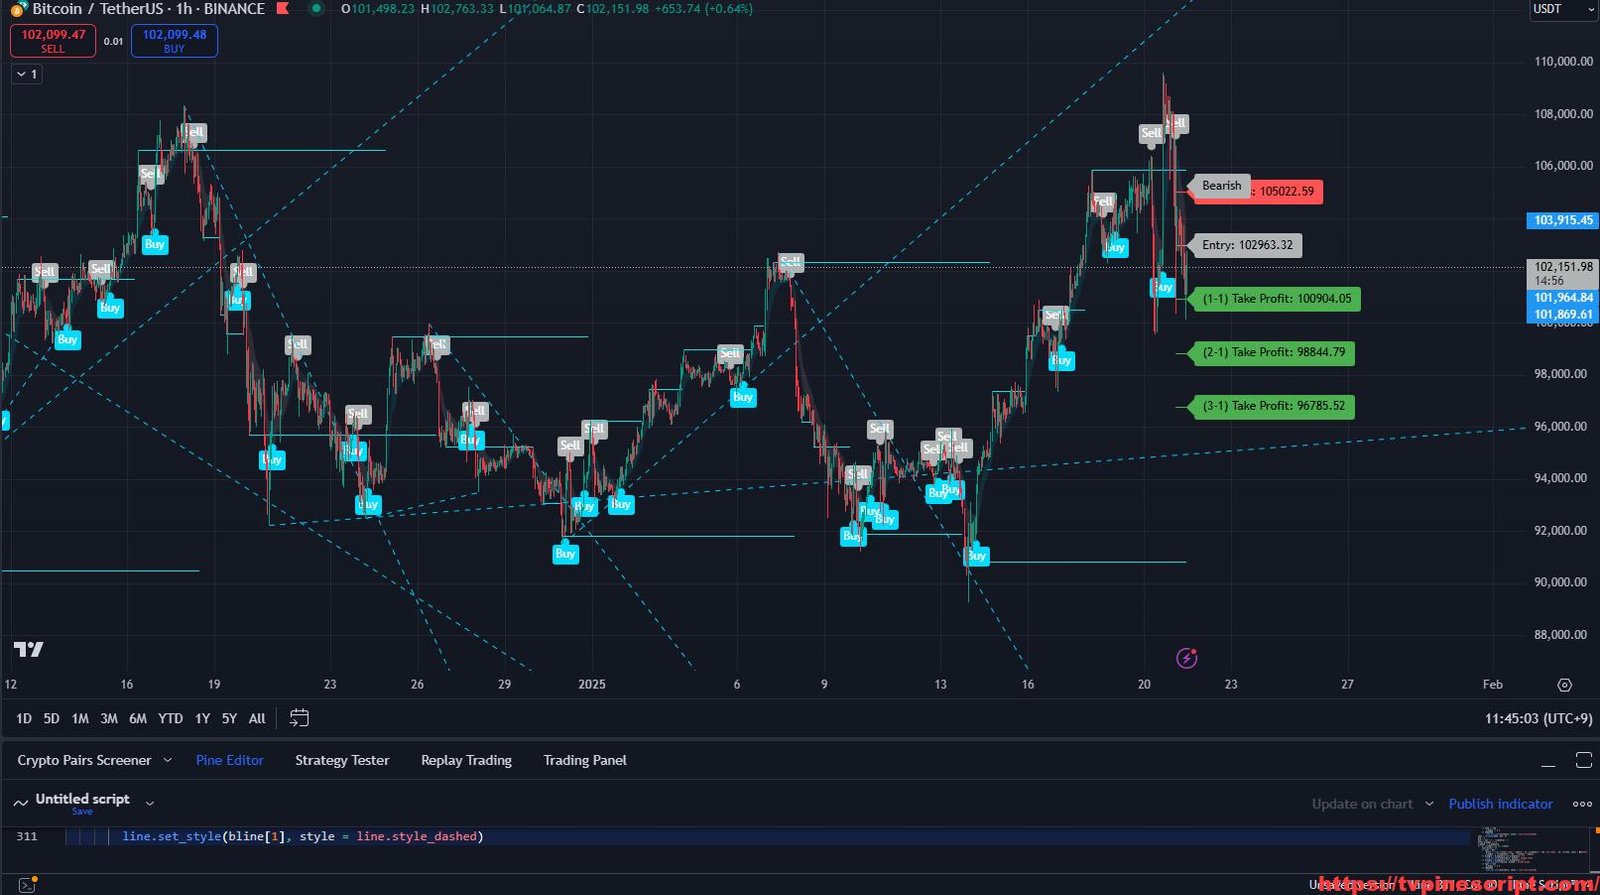
- Dynamic Buy/Sell Signal Generation:
- Automatically detects trend changes and plots Buy (“BUY”) and Sell (“SELL”) signals on the chart.
- Helps traders identify potential trade opportunities with minimal effort.
- Stop-Loss and Take-Profit Levels:
- Implements a multi-tiered stop-loss and take-profit strategy based on ATR calculations.
- Provides three levels of take-profit targets (1:1, 2:1, 3:1) to accommodate different trading styles.
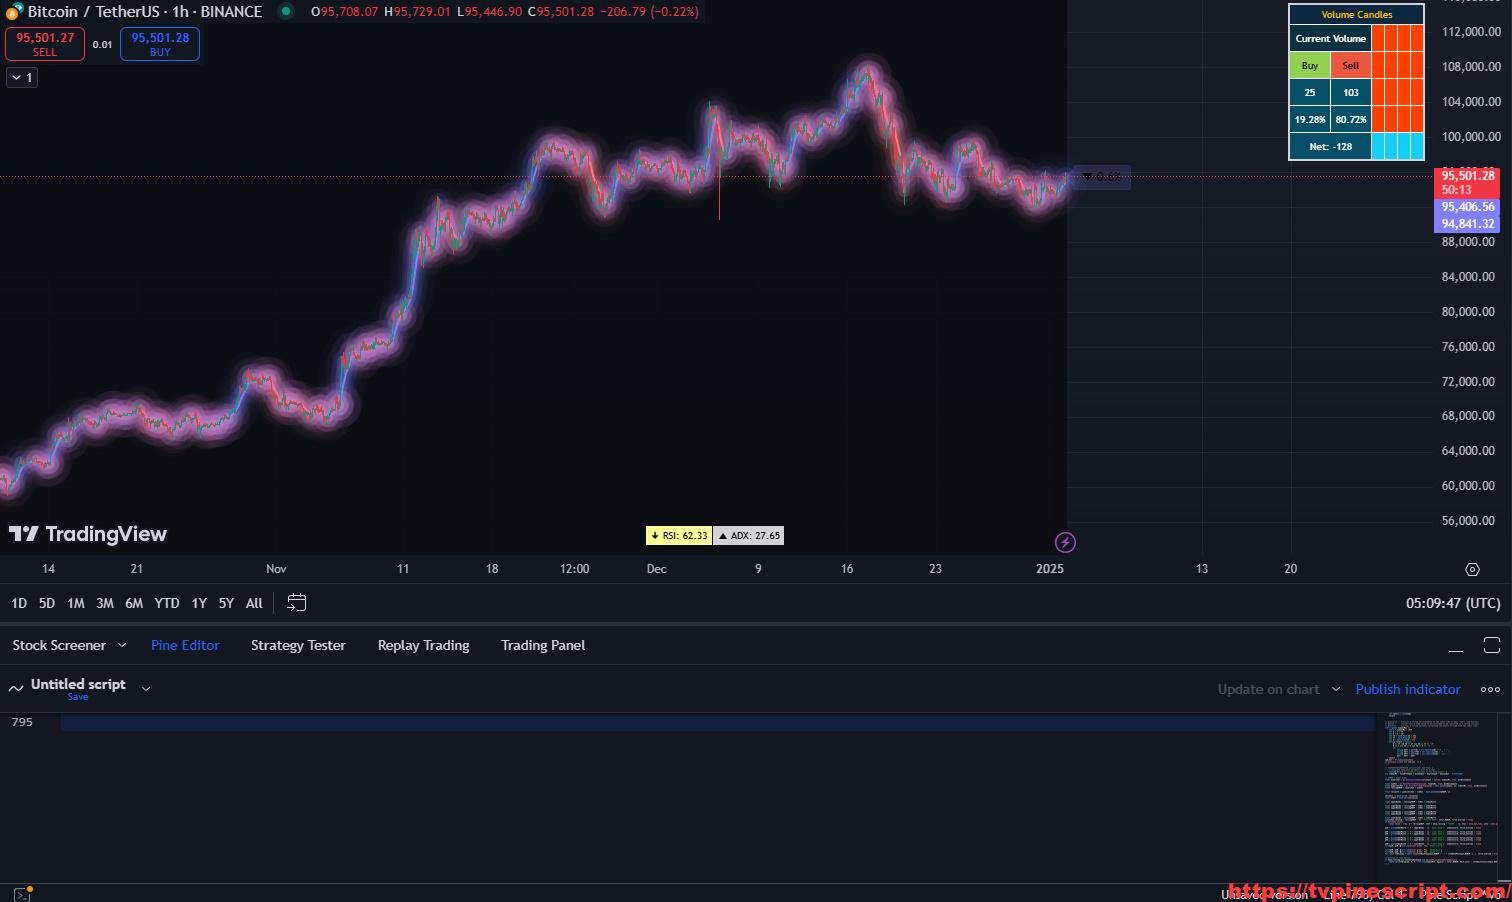
- Moving Average Cloud Visualization:
- Displays an optional cloud moving average that visually highlights bullish and bearish conditions.
- Customizable settings to enable or disable cloud visualization.
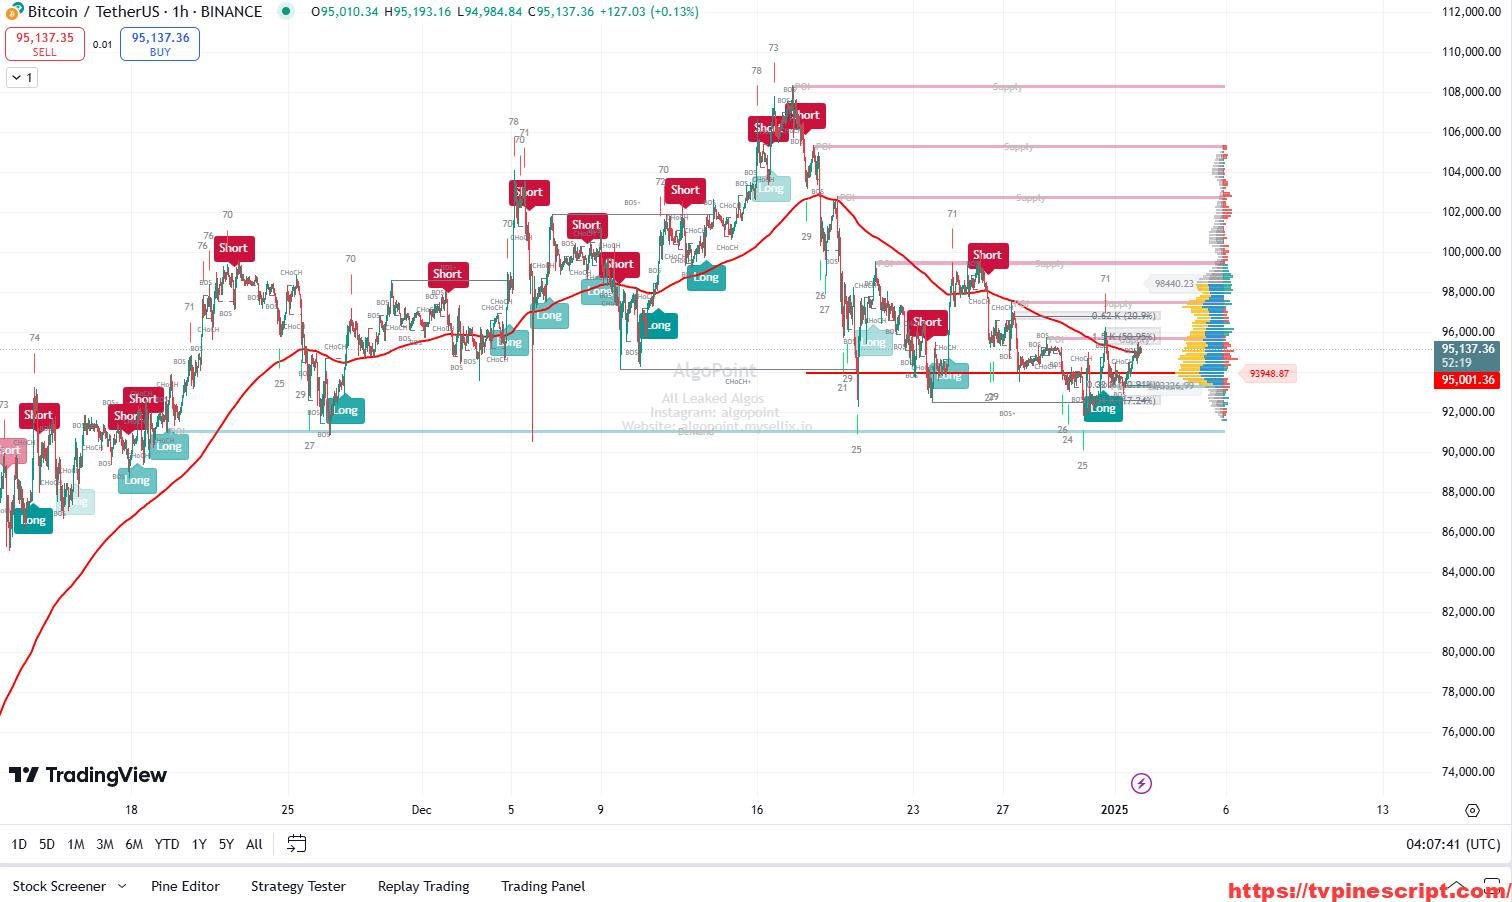
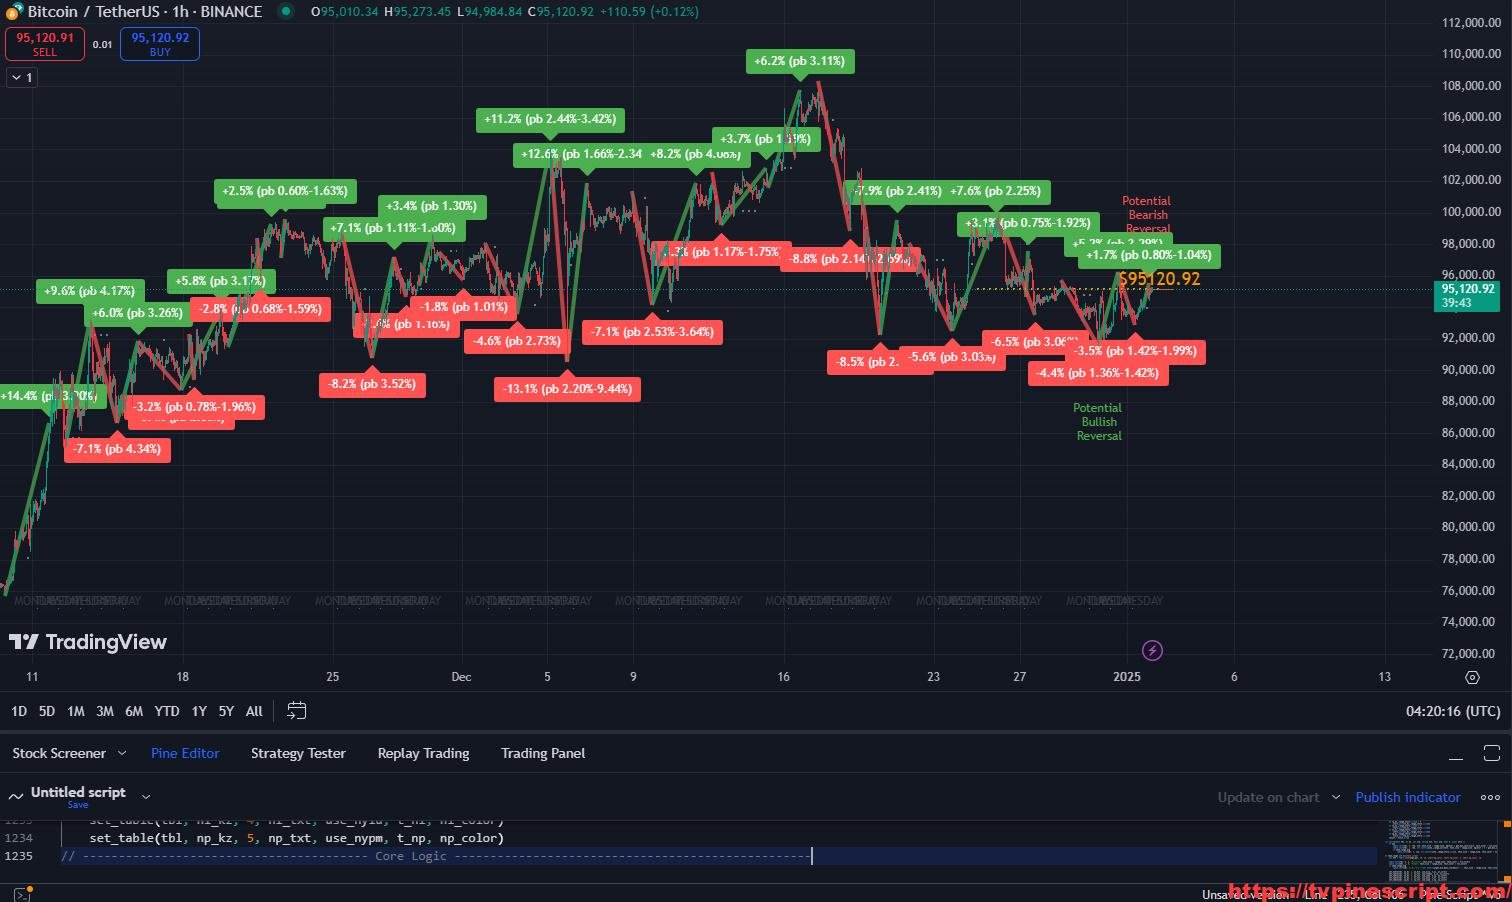
- Auto Trend Line Drawing:
- Identifies significant price levels and automatically draws trend lines.
- Provides better market structure visualization for breakout and pullback strategies.
- Position Tracking System:
- Tracks current position states and dynamically updates the chart with color-coded labels for entries and exits.
- Helps traders stay aware of their active trades without manual tracking.
- Real-Time Alerts and Notifications:
- Customizable alert system for buy and sell conditions to keep traders informed of potential setups.
- Alerts include entry, stop-loss, and take-profit levels for effective trade management.
- Bar Color Customization for Trend Visualization:
- Automatically colors bars based on trend direction, enhancing visual representation of bullish and bearish phases.
- Helps traders quickly identify market sentiment.
- Support and Resistance Levels:
- The script includes pivot-based support and resistance detection to highlight key areas of price interaction.
- Useful for determining high-probability reversal zones.
- MACD Cloud Integration:
- Visualizes MACD trends within the moving average cloud for additional confirmation of trend strength.
- Highlights bullish and bearish momentum phases.
Recommended Usage:
- Scalping:
- Best suited for 5-minute to 15-minute charts.
- Utilize quick trend changes and ATR-based stops to maximize short-term market movements.
- Day Trading:
- Recommended for 30-minute to 1-hour charts.
- Combine buy/sell signals with support/resistance levels for intraday opportunities.
- Swing Trading:
- Effective on 4-hour to daily charts.
- Use moving average clouds and trend lines to capture long-term market moves.
- Risk Management Strategy:
- Leverage the script’s stop-loss and take-profit features to establish a structured exit strategy.
- Avoid high-risk trades by focusing on confluence with support/resistance zones.
Script Evaluation:
- Functionality: 4.8/5
A well-rounded tool offering multiple features for trend detection, position management, and risk control. - Ease of Use: 4.3/5
The extensive customization options may require some familiarization, but it provides valuable insights once mastered. - Accuracy: 4.6/5
Signals are reliable when used in conjunction with broader market analysis techniques. - Repainting Analysis:
This script does not repaint.
All signals are based on confirmed price data, making it suitable for both live trading and backtesting. - Optimal Timeframes:
- Scalping: 5-minute to 15-minute charts.
- Day Trading: 30-minute to 1-hour charts.
- Swing Trading: 4-hour to daily charts.
- Author and Development Quality:
The author of this script remains unknown, but the well-structured coding and robust functionality suggest experienced development. - Overall Score: 4.7/5
A powerful trading tool that provides clear visualizations, alerts, and risk management features.
//@version=4
study("Asset Bender Algo", overlay = true)
Periods = 10 // input(title="ATR Period", type=input.integer, defval=10)
src = hl2 //input(hl2, title="Source")
Multiplier = input(title="Sensitivity (0.5 - 2.5)", type=input.float, step=0.1, defval=2.0, minval=0.5, maxval=2.5)
changeATR= true//input(title="Change ATR Calculation Method ?", type=input.bool, defval=true)
showsignals = true//input(title="Show Buy/Sell Signals ?", type=input.bool, defval=true)
highlighting = true //input(title="Highlighter On/Off ?", type=input.bool, defval=true)
show_cloud = input(true, title="Show Cloud MA")
autolines = input(false, title="Auto Trend Lines")
show_macross = input(true, title="Show MA Cross")


atr2 = sma(tr, Periods)
atr= changeATR ? atr(Periods) : atr2
up=src-(Multiplier*atr)
up1 = nz(up[1],up)
up := close[1] > up1 ? max(up,up1) : up
dn=src+(Multiplier*atr)
dn1 = nz(dn[1], dn)
dn := close[1] < dn1 ? min(dn, dn1) : dn


trend = 1
trend := nz(trend[1], trend)
trend := trend == -1 and close > dn1 ? 1 : trend == 1 and close < up1 ? -1 : trend
upPlot = plot(autolines and trend == 1 ? up : na, title="Up Trend", style=plot.style_linebr, linewidth=2, color=color.white)
buySignal = trend == 1 and trend[1] == -1

dnPlot = plot(autolines and trend ==-1 ? dn : na, title="Down Trend", style=plot.style_linebr, linewidth=2, color=color.white)
sellSignal = trend == -1 and trend[1] == 1

long = buySignal
short= sellSignal

pos = 0.0
pos:= long? 1 : short? -1 : pos[1]

longCond  = long and pos[1]!= 1
shortCond = short and pos[1]!=-1

long_entry  = valuewhen(longCond , close, 0)
short_entry = valuewhen(shortCond, close, 0)

i_sl  = input(2.0, title="Stop Loss % (0 to Disable)", minval=0)
sl  = i_sl >0? i_sl /100 : 99999


sl_long  = long_entry  * (1 - sl)
sl_short = short_entry * (1 + sl)

tp_long1  = long_entry  * (1 + sl)
tp_short1 = short_entry * (1 - sl)

tp_long2  = long_entry  * (1 + sl*2)
tp_short2 = short_entry * (1 - sl*2)

tp_long3  = long_entry  * (1 + sl*3)
tp_short3 = short_entry * (1 - sl*3)


// Position Adjustment
long_sl  = low <sl_long  and pos[1]==1
short_sl = high>sl_short and pos[1]==-1

final_long_tp  = high>tp_long3  and pos[1]==1
final_short_tp = low <tp_short3 and pos[1]==-1

if long_sl or short_sl or final_long_tp or final_short_tp
    pos:=0

long_index = valuewhen(longCond, bar_index, 0)
short_index= valuewhen(shortCond, bar_index, 0)

lastcol = pos==1? #03dbfc : #b1b4b5

if barstate.islast and pos!=0
    line_e  = line.new(bar_index, pos>0?long_entry :short_entry , pos>0?long_index:short_index, pos>0?long_entry :short_entry , color=lastcol  )
    line.delete(line_e [1])


    line_sl  = line.new(bar_index, pos>0?sl_long :sl_short , pos>0?long_index:short_index, pos>0?sl_long :sl_short , color=color.red  )
    line_tp1 = line.new(bar_index, pos>0?tp_long1:tp_short1, pos>0?long_index:short_index, pos>0?tp_long1:tp_short1, color=color.green)
    line_tp2 = line.new(bar_index, pos>0?tp_long2:tp_short2, pos>0?long_index:short_index, pos>0?tp_long2:tp_short2, color=color.green)
    line_tp3 = line.new(bar_index, pos>0?tp_long3:tp_short3, pos>0?long_index:short_index, pos>0?tp_long3:tp_short3, color=color.green)
    line.delete(line_sl [1])
    line.delete(line_tp1[1])
    line.delete(line_tp2[1])
    line.delete(line_tp3[1])

    lbl_e  = label.new(bar_index, pos>0?long_entry :short_entry , color=lastcol  , textcolor=#000000, style=label.style_label_left, text="Entry: " + tostring(pos>0?long_entry :short_entry ))
    label.delete(lbl_e[1])

    lbl_sl  = label.new(bar_index, pos>0?sl_long :sl_short , color=color.red  , textcolor=#000000, style=label.style_label_left, text="Stop Loss: " + tostring(round((pos>0?sl_long :sl_short) *100)/100))
    lbl_tp1 = label.new(bar_index, pos>0?tp_long1:tp_short1, color=color.green, textcolor=#000000, style=label.style_label_left, text="(1-1) Take Profit: " + tostring(round((pos>0?tp_long1:tp_short1) * 100)/100))
    lbl_tp2 = label.new(bar_index, pos>0?tp_long2:tp_short2, color=color.green, textcolor=#000000, style=label.style_label_left, text="(2-1) Take Profit: " + tostring(round((pos>0?tp_long2:tp_short2) * 100)/100))
    lbl_tp3 = label.new(bar_index, pos>0?tp_long3:tp_short3, color=color.green, textcolor=#000000, style=label.style_label_left, text="(3-1) Take Profit: " + tostring(round((pos>0?tp_long3:tp_short3) * 100)/100))
    label.delete(lbl_sl [1])
    label.delete(lbl_tp1[1])
    label.delete(lbl_tp2[1])
    label.delete(lbl_tp3[1])


plotshape(longCond ? up : na, title="UpTrend Begins", location=location.belowbar, style=shape.circle, size=size.tiny, color=#03dbfc, transp=0)
plotshape(longCond and showsignals ? up : na, title="Buy", text="Buy", location=location.belowbar, style=shape.labelup, size=size.tiny, color=#03dbfc, textcolor=color.white, transp=0)
plotshape(shortCond ? dn : na, title="DownTrend Begins", location=location.abovebar, style=shape.circle, size=size.tiny, color=#b1b4b5, transp=0)
plotshape(shortCond and showsignals ? dn : na, title="Sell", text="Sell", location=location.abovebar, style=shape.labeldown, size=size.tiny, color=#b1b4b5, textcolor=color.white, transp=0)

mPlot = plot(ohlc4, title="", style=plot.style_circles, linewidth=0)
longFillColor = highlighting ? (trend == 1 ? color.blue: color.white) : color.white
shortFillColor = highlighting ? (trend == -1 ? color.red : color.white) : color.white


long_alert_text = tostring(syminfo.ticker) + " BUY ALERT! " +
                  "Entry: " + tostring(long_entry) +
                  ", Take Profit 1: " + tostring(tp_long1) +
                  ", Take Profit 2: " + tostring(tp_long2) +
                  ", Take Profit 3: " + tostring(tp_long3) +
                  ", Stop Loss: " + tostring(sl_long)

short_alert_text = tostring(syminfo.ticker) + " SELL ALERT!" +
                  ", Entry: " + tostring(short_entry) +
                  ", Take Profit 1: " + tostring(tp_short1) +
                  ", Take Profit 2: " + tostring(tp_short2) +
                  ", Take Profit 3: " + tostring(tp_short3) +
                  ", Stop Loss: " + tostring(sl_short)

json_data_long = '{"content": "' + long_alert_text + '"}'
json_data_short = '{"content": "' + short_alert_text + '"}'

if longCond
    alert(json_data_long, alert.freq_once_per_bar_close)
    // alert('{"content": "' +tostring(long_entry)+ '"}')

if shortCond
    alert(json_data_short, alert.freq_once_per_bar_close)
    // alert('{"content": "' +tostring(long_entry) + '"}')

// alertcondition(longCond, title="Buy", message= long_alert_text)
// alert(shortCond, title="Sell", message= short_alert_text)
changeCond = trend != trend[1]
alertcondition(changeCond, title="Trend Direction Change", message="Trend has changed direction!")

barcolor(trend == -1? #b1b4b5 : #03dbfc)
last_line = trend == 1 ? up : dn

l = label.new(bar_index, last_line, style=label.style_label_left, color=trend == -1? #b1b4b5 : #03dbfc, textcolor=#000000, text=trend == -1? "Bearish" : "Bullish")
label.delete(l[1])


// MACD Cloud
cloud_val = 10 // input(title = "Cloud SMA", defval = 100, minval = 5, maxval = 500, type = input.integer)
sma_high = ema(high,cloud_val)
sma_low = ema(low, cloud_val)
plot_high = plot(show_cloud? sma_high : na, color = na, transp = 1, editable = false)
plot_low  = plot(show_cloud? sma_low  : na, color = na, transp = 1, editable = false)
[macdLine, signalLine, histLine] = macd(close, 12, 26, 9)

// To be able to properly configure colors in input field need to treat these as 4 different conditions vs one complex line.
fill(plot_high, plot_low, color = (macdLine > 0) and (macdLine[0] > macdLine[1]) ? #03dbfc : na, title = "Positive Uptrend")
fill(plot_high, plot_low, color = macdLine > 0 and macdLine[0] < macdLine[1]     ? #03dbfc : na, title = "Positive Downtrend")
fill(plot_high, plot_low, color = macdLine < 0 and macdLine[0] < macdLine[1]     ? #fde5e4 : na, title = "Negative Uptrend")
fill(plot_high, plot_low, color = macdLine < 0 and macdLine[0] > macdLine[1]     ? #fde5e4 : na, title = "Negative Downtrend")


//// MA CROSS
//shortx = sma(close, 9)
//longx = sma(close, 21)
//plot(show_macross?shortx :na, color = #f27979)
//plot(show_macross?longx  :na, color = #03cdff)
//plot(show_macross and cross(shortx, longx) ? shortx : na, style = plot.style_cross, linewidth = 4)


// S/R
show_sr = input(true, title='Show S/R')
line_width = 1 // input(4, type = input.integer, title="SR Level line Width")
level_min_lengh = input(4, type = input.integer, title="Set minimum number of bars from level start to qualify a level")
y  = "Orange" // input("Orange", "Line Color", options=["Red", "Lime", "Orange", "Teal", "Yellow", "White", "Black"])
line_extend = input(false, type = input.bool, title = "Extend Level line Right") ? extend.right : extend.none
sr_tf = input("", type = input.resolution, title="SR Timeframe")

//color function
colour(z) => z=="Red"?color.red:z=="Lime"?color.lime:z=="Orange"?color.orange:z=="Teal"?
 color.teal:z=="Yellow"?color.yellow:z=="Black"?color.black:color.white

//Legacy RSI calc
rsi_src = close, len = 9
upx1 = rma(max(change(rsi_src), 0), len)
downx1 = rma(-min(change(rsi_src), 0), len)
legacy_rsi = downx1 == 0 ? 100 : upx1 == 0 ? 0 : 100 - (100 / (1 + upx1 / downx1))

//CMO based on HMA
length = 1
src1 = hma(open, 5)[1] // legacy hma(5) calculation gives a resul with one candel shift, thus use hma()[1]
src2 = hma(close, 12)
momm1 = change(src1)
momm2 = change(src2)
f1(m, n) => m >= n ? m : 0.0
f2(m, n) => m >= n ? 0.0 : -m
m1 = f1(momm1, momm2)
m2 = f2(momm1, momm2)
sm1 = sum(m1, length)
sm2 = sum(m2, length)
percent(nom, div) => 100 * nom / div
cmo_new = percent(sm1-sm2, sm1+sm2)

//Legacy Close Pivots calcs.
len5 = 2
hh = highest(len5)
h1 = dev(hh, len5) ? na : hh
hpivot = fixnan(h1)
ll = lowest(len5)
l1 = dev(ll, len5) ? na : ll
lpivot = fixnan(l1)

//Calc Values

rsi_new = rsi(close,9)
lpivot_new =  lpivot  // use legacy pivots calculation as integrated pivotlow/pivothigh functions give very different result
hpivot_new =  hpivot

sup = rsi_new < 25 and cmo_new > 50  and lpivot_new
res = rsi_new > 75 and cmo_new < -50  and hpivot_new
calcXup() =>
    var xup = 0.0
    xup :=  sup ? low : xup[1]
calcXdown() =>
    var xdown = 0.0
    xdown := res ? high : xdown[1]

//Lines drawing variables
tf1 = security(syminfo.tickerid, sr_tf, calcXup(), lookahead=barmerge.lookahead_on)
tf2  = security(syminfo.tickerid, sr_tf, calcXdown(), lookahead=barmerge.lookahead_on)

//SR Line plotting
var tf1_line = line.new(0, 0, 0, 0)
var tf1_bi_start = 0
var tf1_bi_end = 0
tf1_bi_start := change(tf1) ? bar_index : tf1_bi_start[1]
tf1_bi_end := change(tf1) ? tf1_bi_start : bar_index
if change(tf1)
    if (line.get_x2(tf1_line) - line.get_x1(tf1_line)) < level_min_lengh
        line.delete(tf1_line)
    if show_sr
        tf1_line := line.new(tf1_bi_start, tf1, tf1_bi_end, tf1, color = #0fdfe6, width = line_width, extend = line_extend)
line.set_x2(tf1_line, tf1_bi_end)

var tf2_line = line.new(0, 0, 0, 0)
var tf2_bi_start = 0
var tf2_bi_end = 0
tf2_bi_start := change(tf2) ? bar_index : tf2_bi_start[1]
tf2_bi_end := change(tf2) ? tf2_bi_start : bar_index
if change(tf2)
    if (line.get_x2(tf2_line) - line.get_x1(tf2_line)) < level_min_lengh
        line.delete(tf2_line)
    if show_sr
        tf2_line := line.new(tf2_bi_start, tf2, tf2_bi_end, tf2, color =  #0fdfe6, width = line_width, extend = line_extend)
line.set_x2(tf2_line, tf2_bi_end)


// TENDLINES
lb = input(30, title="Trendline Left Bars", minval=1)
rb = input(30, title="Trendline Right Bars", minval=1)
showpivot = false //input(true, title="Trendline - Show Pivot Points")
chdashed = input(true, title="Show Old Trend Line as Dashed")
mb = lb + rb + 1
float top = na
float bot = na
top := iff(not na(high[mb]), iff(highestbars(high, mb) == -rb, high[rb], na), na) // Pivot High
bot := iff(not na(low[mb]), iff(lowestbars(low, mb) == -rb, low[rb], na), na) // Pivot Low
plotshape(top and showpivot, text="[PH]", style=shape.labeldown, color=color.white, textcolor=color.black, location=location.abovebar, transp=0, offset = -rb)
plotshape(bot and showpivot, text="[PL]", style=shape.labeldown, color=color.white, textcolor=color.black, location=location.belowbar, transp=0, offset = -rb)
ltop = valuewhen(top, top, 1)
bst = 0
bst := top ? 1 : nz(bst[1]) + 1

float t_angle = 0.0
t_angle := t_angle[1]

if not na(ltop) and not na(top)
    line tline = na
    if ltop > top
        tline := line.new(bar_index - bst[1] - rb, high[bst[1] + rb], bar_index - rb, high[rb], color = #03cdff, extend = extend.right)
        t_angle := (high[bst[1] + rb] - high[rb]) / bst[1]
    if t_angle < t_angle[1] and t_angle[1] != 0
        line.set_extend(tline[1], extend = extend.none)
    if t_angle > t_angle[1] and t_angle[1] != 0
        line.set_extend(tline, extend = extend.none)
    if ltop <= top
        t_angle := 0.0
    if chdashed
        line.set_style(tline[1], style = line.style_dashed)
lbot = valuewhen(bot, bot, 1)
bsb = 0
bsb := bot ? 1 : nz(bsb[1]) + 1
float b_angle = 0.0
b_angle := b_angle[1]
if not na(lbot) and not na(bot)
    line bline = na
    if lbot < bot
        bline := line.new(bar_index - bsb[1] - rb, low[bsb[1] + rb], bar_index - rb, low[rb], color = #03cdff, extend = extend.right)
        b_angle := (low[bsb[1] + rb] - low[rb]) / bsb[1]
    if b_angle > b_angle[1] and b_angle[1] != 0
        line.set_extend(bline[1], extend = extend.none)
    if b_angle < b_angle[1] and b_angle[1] != 0
        line.set_extend(bline, extend = extend.none)
    if lbot >= bot
        b_angle := 0.0
    if chdashed
        line.set_style(bline[1], style = line.style_dashed)
How to Apply Pine Script in TradingView:
- Open TradingView and log in to your account.
- Navigate to the Pine Script Editor at the bottom of the screen.
- Copy and paste the provided script code.
- Click Save, then name the script (e.g., “Asset Bender Algo”).
- Click Add to Chart to apply the indicator.
- Customize the settings based on your trading strategy.
Additional Trading Tips:
- Pair with Momentum Indicators:
Combining this script with RSI or MACD can help confirm entry and exit points with greater accuracy. - Use Higher Timeframes for Confirmation:
Before making decisions, align signals with a higher timeframe trend to filter false signals. - Set Realistic Expectations:
No trading system is foolproof; always prioritize risk management and maintain a disciplined approach.
Final Thoughts:
The Asset Bender Algo Indicator offers traders a comprehensive solution for market analysis, combining trend detection, entry signals, and risk management into a single tool. Its non-repainting nature ensures reliability and consistency, making it a valuable asset for both beginner and experienced traders.
RELATED POSTS
View all
COCO+ Indicator: Advanced Moving Averages and Volume Analysis for Precision Trading
January 3, 2025 | by admin
Consolidate Your Trading Analysis with the Ultimate All-in-One AlgoPoint Script
January 3, 2025 | by admin
Pullback Analysis with ICT GridBot and Advanced Pine Script Features
January 3, 2025 | by admin