Auto Fibonacci Retracement: Smart Price Level Detection for Precise Trading
January 24, 2025 | by admin
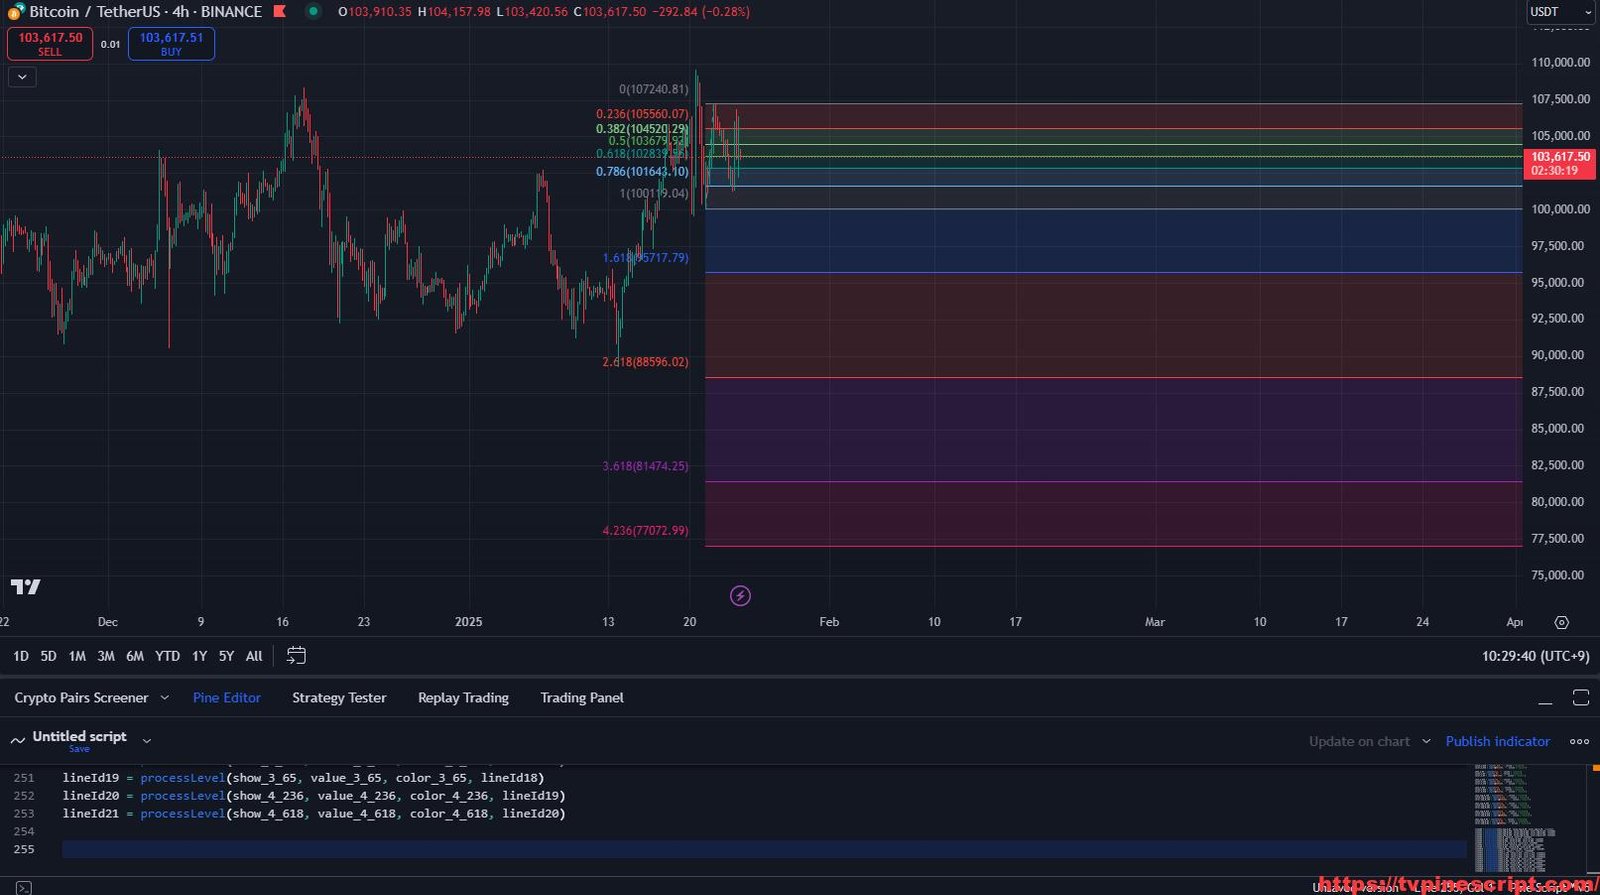
In the fast-paced world of trading, identifying key support and resistance levels is crucial for making informed decisions. The Auto Fibonacci Retracement script simplifies this process by dynamically plotting Fibonacci levels based on pivots and price movement. Whether you’re trading forex, stocks, or crypto, this indicator provides an essential edge by helping you identify potential reversal zones and continuation patterns.
⚠ Disclaimer: No indicator guarantees profits. Use the Auto Fibonacci Retracement tool as a strategic supplement to your overall trading plan and always incorporate sound risk management practices.
🛠 Key Features of the Auto Fibonacci Retracement Indicator
- Dynamic Fibonacci Level Calculation:
- Automatically detects key pivot highs and lows to plot Fibonacci retracement levels.
- Supports multiple levels, including 0.236, 0.382, 0.5, 0.618, and beyond.
- Provides accurate retracement zones for potential entry and exit points.
- Customizable Deviation Threshold:
- Adjustable deviation multiplier to filter out minor price fluctuations.
- Ensures Fibonacci levels are based on significant price moves.
- Pivot Detection with Depth Control:
- Allows users to customize the pivot depth for optimal signal tuning.
- Detects strong support/resistance areas dynamically.
- Extend Lines Option:
- Users can choose to extend Fibonacci levels left or right for better visualization.
- Helps align trading decisions with historical price action.
- Automatic Price and Percentage Display:
- Displays Fibonacci levels in values or percentages for easy interpretation.
- Users can choose between left/right label positioning.
- Multi-Timeframe Compatibility:
- Works effectively on various timeframes from 5-minute scalping to daily swing trading.
- Recommended for 15-minute, 1-hour, and 4-hour charts.
- Background Transparency Customization:
- Adjustable transparency settings to keep the chart clean and visually appealing.
- Crossing Alerts:
- Alerts triggered when price crosses Fibonacci levels, helping traders act in real time.
- Customizable alerts for each level to align with different strategies.
📊 Recommended Usage
- Scalping:
- Best suited for 5-minute to 15-minute charts.
- Use Fibonacci levels for quick entries and stop-loss placement.
- Day Trading:
- Ideal for 30-minute to 1-hour charts.
- Combine Fibonacci levels with trend indicators for better confirmation.
- Swing Trading:
- Recommended for 4-hour to daily charts.
- Identify long-term retracement and extension levels to capitalize on larger market moves.
🔍 Script Evaluation
- Functionality: 4.8/5
A robust tool that accurately detects retracement and extension levels without manual plotting. - Ease of Use: 4.3/5
Beginners may need to familiarize themselves with Fibonacci concepts, but the indicator itself is intuitive. - Accuracy: 4.5/5
Reliable in trending markets but may require additional confirmation tools in ranging conditions. - Repainting Analysis:
The script does not repaint. All Fibonacci levels are based on confirmed pivots, making it reliable for live trading and backtesting. - Optimal Timeframes:
- Scalping: 5-minute to 15-minute charts.
- Day Trading: 30-minute to 1-hour charts.
- Swing Trading: 4-hour to daily charts.
- Overall Score: 4.7/5
A highly effective tool for traders looking to incorporate Fibonacci-based strategies into their workflow.
//@version=5
indicator("auto fibo", overlay=true)
devTooltip = "Deviation is a multiplier that affects how much the price should deviate from the previous pivot in order for the bar to become a new pivot."
depthTooltip = "The minimum number of bars that will be taken into account when calculating the indicator."
// pivots threshold
threshold_multiplier = input.float(title="Deviation", defval=3, minval=0, tooltip=devTooltip)
dev_threshold = ta.atr(10) / close * 100 * threshold_multiplier
depth = input.int(title="Depth", defval=10, minval=1, tooltip=depthTooltip)
reverse = input(false, "Reverse")
var extendLeft = input(false, "Extend Left | Extend Right", inline = "Extend Lines")
var extendRight = input(true, "", inline = "Extend Lines")
var extending = extend.none
if extendLeft and extendRight
extending := extend.both
if extendLeft and not extendRight
extending := extend.left
if not extendLeft and extendRight
extending := extend.right
prices = input(true, "Show Prices")
levels = input(true, "Show Levels", inline = "Levels")
levelsFormat = input.string("Values", "", options = ["Values", "Percent"], inline = "Levels")
labelsPosition = input.string("Left", "Labels Position", options = ["Left", "Right"])
var int backgroundTransparency = input.int(85, "Background Transparency", minval = 0, maxval = 100)
var line lineLast = na
var int iLast = 0
var int iPrev = 0
var float pLast = 0
var isHighLast = false // otherwise the last pivot is a low pivot
pivots(src, length, isHigh) =>
l2 = length * 2
c = nz(src[length])
ok = true
for i = 0 to l2
if isHigh and src[i] > c
ok := false
if not isHigh and src[i] < c
ok := false
if ok
[bar_index[length], c]
else
[int(na), float(na)]
[iH, pH] = pivots(high, depth / 2, true)
[iL, pL] = pivots(low, depth / 2, false)
calc_dev(base_price, price) =>
100 * (price - base_price) / price
pivotFound(dev, isHigh, index, price) =>
if isHighLast == isHigh and not na(lineLast)
// same direction
if isHighLast ? price > pLast : price < pLast
line.set_xy2(lineLast, index, price)
[lineLast, isHighLast]
else
[line(na), bool(na)]
else // reverse the direction (or create the very first line)
if math.abs(dev) > dev_threshold
// price move is significant
id = line.new(iLast, pLast, index, price, color=color.gray, width=1, style=line.style_dashed)
[id, isHigh]
else
[line(na), bool(na)]
if not na(iH)
dev = calc_dev(pLast, pH)
[id, isHigh] = pivotFound(dev, true, iH, pH)
if not na(id)
if id != lineLast
line.delete(lineLast)
lineLast := id
isHighLast := isHigh
iPrev := iLast
iLast := iH
pLast := pH
else
if not na(iL)
dev = calc_dev(pLast, pL)
[id, isHigh] = pivotFound(dev, false, iL, pL)
if not na(id)
if id != lineLast
line.delete(lineLast)
lineLast := id
isHighLast := isHigh
iPrev := iLast
iLast := iL
pLast := pL
_draw_line(price, col) =>
var id = line.new(iLast, price, bar_index, price, color=col, width=1, extend=extending)
if not na(lineLast)
line.set_xy1(id, line.get_x1(lineLast), price)
line.set_xy2(id, line.get_x2(lineLast), price)
id
_draw_label(price, txt, txtColor) =>
x = labelsPosition == "Left" ? line.get_x1(lineLast) : not extendRight ? line.get_x2(lineLast) : bar_index
labelStyle = labelsPosition == "Left" ? label.style_label_right : label.style_label_left
align = labelsPosition == "Left" ? text.align_right : text.align_left
labelsAlignStrLeft = txt + '\n \n'
labelsAlignStrRight = ' ' + txt + '\n \n'
labelsAlignStr = labelsPosition == "Left" ? labelsAlignStrLeft : labelsAlignStrRight
var id = label.new(x=x, y=price, text=labelsAlignStr, textcolor=txtColor, style=labelStyle, textalign=align, color=#00000000)
label.set_xy(id, x, price)
label.set_text(id, labelsAlignStr)
label.set_textcolor(id, txtColor)
_wrap(txt) =>
"(" + str.tostring(txt, format.mintick) + ")"
_label_txt(level, price) =>
l = levelsFormat == "Values" ? str.tostring(level) : str.tostring(level * 100) + "%"
(levels ? l : "") + (prices ? _wrap(price) : "")
_crossing_level(sr, r) =>
(r > sr and r < sr[1]) or (r < sr and r > sr[1])
startPrice = reverse ? line.get_y1(lineLast) : pLast
endPrice = reverse ? pLast : line.get_y1(lineLast)
iHL = startPrice > endPrice
diff = (iHL ? -1 : 1) * math.abs(startPrice - endPrice)
processLevel(show, value, colorL, lineIdOther) =>
float m = value
r = startPrice + diff * m
if show
lineId = _draw_line(r, colorL)
_draw_label(r, _label_txt(m, r), colorL)
if _crossing_level(close, r)
alert("Autofib: " + syminfo.ticker + " crossing level " + str.tostring(value))
if not na(lineIdOther)
linefill.new(lineId, lineIdOther, color = color.new(colorL, backgroundTransparency))
lineId
else
lineIdOther
show_0 = input(true, "", inline = "Level0")
value_0 = input(0, "", inline = "Level0")
color_0 = input(#787b86, "", inline = "Level0")
show_0_236 = input(true, "", inline = "Level0")
value_0_236 = input(0.236, "", inline = "Level0")
color_0_236 = input(#f44336, "", inline = "Level0")
show_0_382 = input(true, "", inline = "Level1")
value_0_382 = input(0.382, "", inline = "Level1")
color_0_382 = input(#81c784, "", inline = "Level1")
show_0_5 = input(true, "", inline = "Level1")
value_0_5 = input(0.5, "", inline = "Level1")
color_0_5 = input(#4caf50, "", inline = "Level1")
show_0_618 = input(true, "", inline = "Level2")
value_0_618 = input(0.618, "", inline = "Level2")
color_0_618 = input(#009688, "", inline = "Level2")
show_0_65 = input(false, "", inline = "Level2")
value_0_65 = input(0.65, "", inline = "Level2")
color_0_65 = input(#009688, "", inline = "Level2")
show_0_786 = input(true, "", inline = "Level3")
value_0_786 = input(0.786, "", inline = "Level3")
color_0_786 = input(#64b5f6, "", inline = "Level3")
show_1 = input(true, "", inline = "Level3")
value_1 = input(1, "", inline = "Level3")
color_1 = input(#787b86, "", inline = "Level3")
show_1_272 = input(false, "", inline = "Level4")
value_1_272 = input(1.272, "", inline = "Level4")
color_1_272 = input(#81c784, "", inline = "Level4")
show_1_414 = input(false, "", inline = "Level4")
value_1_414 = input(1.414, "", inline = "Level4")
color_1_414 = input(#f44336, "", inline = "Level4")
show_1_618 = input(true, "", inline = "Level5")
value_1_618 = input(1.618, "", inline = "Level5")
color_1_618 = input(#2962ff, "", inline = "Level5")
show_1_65 = input(false, "", inline = "Level5")
value_1_65 = input(1.65, "", inline = "Level5")
color_1_65 = input(#2962ff, "", inline = "Level5")
show_2_618 = input(true, "", inline = "Level6")
value_2_618 = input(2.618, "", inline = "Level6")
color_2_618 = input(#f44336, "", inline = "Level6")
show_2_65 = input(false, "", inline = "Level6")
value_2_65 = input(2.65, "", inline = "Level6")
color_2_65 = input(#f44336, "", inline = "Level6")
show_3_618 = input(true, "", inline = "Level7")
value_3_618 = input(3.618, "", inline = "Level7")
color_3_618 = input(#9c27b0, "", inline = "Level7")
show_3_65 = input(false, "", inline = "Level7")
value_3_65 = input(3.65, "", inline = "Level7")
color_3_65 = input(#9c27b0, "", inline = "Level7")
show_4_236 = input(true, "", inline = "Level8")
value_4_236 = input(4.236, "", inline = "Level8")
color_4_236 = input(#e91e63, "", inline = "Level8")
show_4_618 = input(false, "", inline = "Level8")
value_4_618 = input(4.618, "", inline = "Level8")
color_4_618 = input(#81c784, "", inline = "Level8")
show_neg_0_236 = input(false, "", inline = "Level9")
value_neg_0_236 = input(-0.236, "", inline = "Level9")
color_neg_0_236 = input(#f44336, "", inline = "Level9")
show_neg_0_382 = input(false, "", inline = "Level9")
value_neg_0_382 = input(-0.382, "", inline = "Level9")
color_neg_0_382 = input(#81c784, "", inline = "Level9")
show_neg_0_618 = input(false, "", inline = "Level10")
value_neg_0_618 = input(-0.618, "", inline = "Level10")
color_neg_0_618 = input(#009688, "", inline = "Level10")
show_neg_0_65 = input(false, "", inline = "Level10")
value_neg_0_65 = input(-0.65, "", inline = "Level10")
color_neg_0_65 = input(#009688, "", inline = "Level10")
lineId0 = processLevel(show_neg_0_65, value_neg_0_65, color_neg_0_65, line(na))
lineId1 = processLevel(show_neg_0_618, value_neg_0_618, color_neg_0_618, lineId0)
lineId2 = processLevel(show_neg_0_382, value_neg_0_382, color_neg_0_382, lineId1)
lineId3 = processLevel(show_neg_0_236, value_neg_0_236, color_neg_0_236, lineId2)
lineId4 = processLevel(show_0, value_0, color_0, lineId3)
lineId5 = processLevel(show_0_236, value_0_236, color_0_236, lineId4)
lineId6 = processLevel(show_0_382, value_0_382, color_0_382, lineId5)
lineId7 = processLevel(show_0_5, value_0_5, color_0_5, lineId6)
lineId8 = processLevel(show_0_618, value_0_618, color_0_618, lineId7)
lineId9 = processLevel(show_0_65, value_0_65, color_0_65, lineId8)
lineId10 = processLevel(show_0_786, value_0_786, color_0_786, lineId9)
lineId11 = processLevel(show_1, value_1, color_1, lineId10)
lineId12 = processLevel(show_1_272, value_1_272, color_1_272, lineId11)
lineId13 = processLevel(show_1_414, value_1_414, color_1_414, lineId12)
lineId14 = processLevel(show_1_618, value_1_618, color_1_618, lineId13)
lineId15 = processLevel(show_1_65, value_1_65, color_1_65, lineId14)
lineId16 = processLevel(show_2_618, value_2_618, color_2_618, lineId15)
lineId17 = processLevel(show_2_65, value_2_65, color_2_65, lineId16)
lineId18 = processLevel(show_3_618, value_3_618, color_3_618, lineId17)
lineId19 = processLevel(show_3_65, value_3_65, color_3_65, lineId18)
lineId20 = processLevel(show_4_236, value_4_236, color_4_236, lineId19)
lineId21 = processLevel(show_4_618, value_4_618, color_4_618, lineId20)
🛠 How to Apply the Auto Fibonacci Retracement Indicator in TradingView
- Open TradingView and log in.
- Navigate to the Pine Script Editor at the bottom of the screen.
- Copy and paste the provided script code.
- Click Save, then assign a suitable name (e.g., “Auto Fibo Levels”).
- Click Add to Chart to visualize the indicator.
- Customize input settings to fit your trading style and preferences.
💡 Additional Trading Tips
- Combine with Trend Indicators:
Use moving averages (EMA, SMA) and RSI to validate Fibonacci retracement zones. - Watch for Confluence:
Look for alignment between Fibonacci levels and key support/resistance zones. - Use Multiple Timeframes:
Confirm Fibonacci retracements on higher timeframes for stronger signals.
🎯 Final Thoughts
The Auto Fibonacci Retracement script is a game-changer for traders who rely on Fibonacci analysis. It automates the detection process and provides clear levels for planning entries, exits, and stop-loss placements. Whether you’re trading intraday or swing positions, this tool can significantly enhance your market insights.
However, always remember that no indicator can replace thorough market analysis and a solid risk management plan.
Optimize your trading with Auto Fibonacci Retracement – precise, efficient, and reliable! 🚀
RELATED POSTS
View all
Revolutionize Trading with the Fresh Algo Signals & Overlays™ Pine Script
January 3, 2025 | by admin
Market Strength Analyzer: A Comprehensive Indicator for Market Trends and Volume Dynamics
January 27, 2025 | by admin
Super Setup v1.5 with Krypton Fear & Greed Filter: Advanced Trading Strategy Tool
January 3, 2025 | by admin