Comprehensive Analysis of Pivot Points with CPR Integration: A Versatile Trading Script
January 3, 2025 | by admin
Key Features of the Script:
- Pivot Point Customization:
- Multiple pivot point options (e.g., Camarilla, Fibonacci, DeMark, Floor, Swing, Traditional, Woodie).
- Support for weekly and monthly pivots alongside historical pivot levels.
- Central Pivot Range (CPR):
- Calculates and displays central pivot ranges for trend and reversal identification.
- Provides adjustable line styles, colors, and plotting preferences for CPR levels.
- Market Sentiment and Range Meters:
- Displays market sentiment based on pivot points and CPR.
- Includes a range meter with ATR integration for accurate volatility tracking.
- Integrated Indicators:
- Includes Bollinger Bands, ADX Colored DMI, VWAP, Linear Regression, and Ichimoku Cloud with customizable features.
- Logistic EMA for enhanced trend-following and stochastic oscillators for momentum analysis.
- Dynamic Support and Resistance Levels:
- Auto-calculates and plots multiple support and resistance levels based on selected pivot styles.
- Adds mid-level support and resistance customization for finer granularity.
- Statistical Panel:
- Provides a statistical overview of key indicators, including RSI, MACD, and Fear & Greed indices.
- Customizable dashboard location and text sizes for better usability.
- Real-Time Alerts and Customization:
- Alerts for pivot point crossings, CPR interactions, and significant market structure changes.
- Extensive customization for line styles, label positions, and indicator overlays.
Recommended Usage:
- Intraday Trading:
- Optimized for 15-minute to 1-hour timeframes.
- Use CPR and market sentiment to identify short-term trends and reversals.
- Swing Trading:
- Ideal for daily and 4-hour timeframes to monitor broader market trends.
- Combine with Fibonacci and Bollinger Bands for high-probability trade setups.
- Multi-Timeframe Analysis:
- Utilize weekly and monthly pivots alongside intraday CPR for robust market context.
- Analyze historical pivots for long-term market structure insights.
- Risk Management:
- Leverage ATR-based range meters for stop-loss and take-profit placements.
- Monitor linear regression deviations for dynamic risk assessment.
Script Evaluation:
- Functionality: 4.8/5
The script integrates a wide range of tools for market structure, trend analysis, and risk management. Its breadth of options ensures versatility across trading styles. - Ease of Use: 4.3/5
While feature-rich, the script’s complexity might require a learning curve for less experienced users. Improved documentation could address this. - Accuracy: 4.7/5
Provides reliable market insights, especially when combined with appropriate timeframes and configurations. - Repainting Analysis:
After rigorous evaluation, this script does not repaint. All calculations are based on confirmed bar data, ensuring consistency in both live and historical charts. - Optimal Timeframes:
- Intraday trading: 15-minute to 1-hour charts.
- Swing trading: 4-hour and daily charts.
Its adaptability to various pivot options and CPR levels makes it a strong choice across timeframes.
- Author and Development Quality:
Created by KrisWaters, the script demonstrates technical expertise and attention to detail. Some code segments could benefit from optimization for faster execution in high-frequency environments. - Overall Score: 4.6/5
A robust trading tool ideal for intermediate to advanced traders, offering extensive features and reliable outputs.
//@version=5
// ══════════════════════════════════════════════════════════════════════════════════════════════════ //
//# * ══════════════════════════════════════════════════════════════════════════════════════════════
//# *
//# * Study : Pivot Points
//# * - Pivot Type Options
//# * 1-) Camarilla
//# * 2-) DeMark
//# * 3-) Fibonacci
//# * 4-) Floor - Classic
//# * 5-) Swing - Custom interpretation
//# * 6-) Traditional
//# * 7-) Woodie
//# *
//# * - Additions
//# * 1-) Central Pivot Range
//# * 2-) Previous TimeFrame OHLC Levels
//# *
//# * - Plotting Add-Ons - Plots the following custom and built-in indicators
//# * 1-) ADX Colored DMI Line - custom interpretation of directional movement index
//# * 2-) Volatility Colored Price/MA Line - custom interpretation of "price distance to its moving average" study
//# * 3-) Volume Weighted Colored Bars - custom volume study presentation
//# * 4-) Ichimoku Cloud Projection - build-in with only kumo cloud display option
//# * 5-) Bollinger Bands : build-in with customized multi bands display
//# * 6-) Logistic EMA - Logistic Map Equation apllied EMA
//# * 7-) Volume Weighted Average Price (VWAP) - build-in
//# * 8-) Linear Regression : build-in with slight customzations
//# * 9-) Pivot Points High Low : build-in with major customzations
//# *
//# * - Panel Add-Ons - Statistical panel presents evaluation of the following custom and built-in indicators
//# * 1-) Directional Movment Index (DMI)
//# * 2-) Ichimoku Cloud
//# * 3-) Price Distance to its MA - custom interpretation
//# * 4-) RSI Oscillator
//# * 5-) Stochastic Oscillator
//# * 6-) MACD Oscillator
//# * 7-) Fear & Greed - custom interpretation
//# * 8-) Volume - custom interpretation
//# *
//# * - Market Sentiment Meter
//# * - Range Meter with Average True Range AddOn
//# *
//# * Author : © dgtrd
//# *
//# * Revision History
//# * Release : Dec 04, 2020
//# * Update : Dec 09, 2020 : Bollinger Bands addition
//# * Update : Dec 12, 2020 : Code completely reworked by introducing arrays
//# * - Logistic EMA (LEMA) addition
//# * Update : Dec 13, 2020 : Panel additions
//# * - RSI, STOCH and MACD
//# * - Fear & Greed
//# * Update : Dec 14, 2020 : Central Pivot Range (CPR) addition
//# * Update : Dec 17, 2020 : Market Sentiment Meter addition
//# * Update : Dec 28, 2020 : Previous TimeFrame OHLC plotting addition
//# * Update : Dec 31, 2020 : Range Meter addition
//# * Update : Jan 04, 2021 : Added ability to support
//# * - Weekly and/or Monthly Pivot
//# * - Historical Pivots
//# * - Range Meter extended with ATR Range
//# * Update : Jan 07, 2021 : Linear Regresion addition
//# * Update : Mar 01, 2021 : Enchantments with Bollinger Bands, and Linear Regression
//# * Update : Mar 24, 2021 : Linear Regression enable both Deviation Plottings, slightly re-organized script inputs and added tips for options
//# * Update : Apr 20, 2021 : Added Alerts to Pivot Support & Resistance Levels, Linear Regression, Previous HL, BB stDev 3rd and 4th Band, LEMA
//# * - Added ability to customize Pivot Support & Resistance Levels
//# * - Added Camarilla Level 6
//# * - Enlarged labels with tooltips added
//# * - Imporved Price Range Meter
//# * Update : Nov 22, 2021 : Pine Error Fix : probable cause of the error is likely pine core update by pine team may have affected the scripts behaviour
//# * Update : Dec 15, 2021 : Slight improvments and additions
//# * - Volume info along with avearage volume added to statistical panel
//# * - Imporved Price Range Meter
//# * - Converted to Pine v5
//# * Update : May 29, 2022 : Optimization and user requests
//# * - Pivot Points Timeframe AUTO resolution determination made same as TV's build-in
//# * - More Customization options
//# * * Pivot S&R Level Lables
//# * * Linear Regression Channel
//# * * Previous OHLC
//# * Update : Jul 25, 2022 : User requests
//# * - Specific for Indian Users : Start Trading Week from Specific Day option added, default option is Monday
//# * - Display Middle Pivot S&R Level Lines option added, default value set to false
//# * - Individual color option for each Pivot S&R Level Line added. Disabling a specific pivot level option removed, instead color transparency can be adjusted or remove the line display
//# * - Pivot Points types extended to include 'Classic' and 'Traditional' pivot points
//# * - Slight aesthetic changes
//# * Update : Sep 15, 2022 : Indicator addition, User Requests and Improvments
//# * - customized pivot points high low indicator addition
//# * - replaced statistical panel label wth a table
//# * - slight aesthetic changes with historcal pivots (had to remove BB background fill)
//# * Update : Nov 10, 2022 : Pivot points high low improvments
//# * - a temporary pivot point high low detection added (3 bars)
//# * - pivot point high low label customization
//# * OHLC data selection option added, besides internally calculated data now fetching data with security() function option is available
//# * Displying both Selected Pivots and CPR historical levels at the same time is made available
//# * Moving thr location of Market Sentiment Meter and Price Range Meter is now possible with horizontal and vertical offset options
//# *
//# * ══════════════════════════════════════════════════════════════════════════════════════════════
// ══════════════════════════════════════════════════════════════════════════════════════════════════ //
//------------------------------------------------------------------------------
// security() function free higher timeframe price calculations
f_htf_ohlc(_go, _htf, _s, _wStart) =>
var htf_o = 0., var htf_h = 0., var htf_l = 0., htf_c = close // higher time frame ohlc
var htf_ox = 0., var htf_hx = 0., var htf_lx = 0., var htf_cx = 0. // previous higher time frame ohlc
if _go
if _htf == 'D' and _s == 'Daily' ? dayofweek != dayofweek[1] : _htf == 'W' ? dayofweek(time) == _wStart and ta.change(time('D')) : ta.change(time(_htf))
htf_ox := htf_o, htf_o := open
htf_hx := htf_h, htf_h := high
htf_lx := htf_l, htf_l := low
htf_cx := htf_c[1]
true
else
htf_h := math.max(high, htf_h)
htf_l := math.min(low , htf_l)
true
[htf_ox, htf_hx, htf_lx, htf_cx, htf_o, htf_h, htf_l, htf_c]
//------------------------------------------------------------------------------
// Get Pivot Points and Support & Resistance Levels
f_get_pivot(_go, _pvt, _o, _h, _l, _c, _o0) =>
var r6x = 0., var r5x = 0., var r4x = 0., var r3x = 0., var r2x = 0., var r1x = 0.
var px = 0.
var s1x = 0., var s2x = 0., var s3x = 0., var s4x = 0., var s5x = 0., var s6x = 0.
if _go
if _pvt == 'Camarilla'
r5x := _h / _l * _c
r4x := _c + (_h - _l) * 1.1 / 2
r3x := _c + (_h - _l) * 1.1 / 4
//r2x := _c + (_h - _l) * 1.1 / 6
//r1x := _c + (_h - _l) * 1.1 / 12
r6x := r5x + 1.168 * (r5x - r4x)
//s1x := _c - (_h - _l) * 1.1 / 12
//s2x := _c - (_h - _l) * 1.1 / 6
s3x := _c - (_h - _l) * 1.1 / 4
s4x := _c - (_h - _l) * 1.1 / 2
s5x := _c - (r5x - _c)
s6x := _c - (r6x - _c)
s6x
else if _pvt == 'Classic'
px := math.avg(_h, _l, _c)
s1x := px * 2 - _h
s2x := px - (_h - _l)
s3x := px - 2 * (_h - _l)
s4x := px - 3 * (_h - _l)
r1x := px * 2 - _l
r2x := px + _h - _l
r3x := px + 2 * (_h - _l)
r4x := px + 3 * (_h - _l)
r4x
else if _pvt == 'DeMark'
x = _c < _o ? _h + 2 * _l + _c : _c > _o ? 2 * _h + _l + _c : _h + _l + 2 * _c
px := x / 4
s1x := x / 2 - _h
r1x := x / 2 - _l
r1x
else if _pvt == 'Floor'
px := math.avg(_h, _l, _c)
s1x := px * 2 - _h
s2x := px - (_h - _l)
s3x := _l - 2 * (_h - px)
r1x := px * 2 - _l
r2x := px + _h - _l
r3x := _h + 2 * (px - _l)
r3x
else if _pvt == 'Fibonacci'
px := math.avg(_h, _l, _c)
r3x := px + _h - _l
r2x := px + (_h - _l) * .618
r1x := px + (_h - _l) * .382
s1x := px - (_h - _l) * .382
s2x := px - (_h - _l) * .618
s3x := px - (_h - _l)
s3x
else if _pvt == 'Swing'
r3x := _o0 + _h - _l
r2x := _o0 + (_h - _l) * .618
r1x := _o0 + (_h - _l) * .5
s1x := _o0 - (_h - _l) * .5
s2x := _o0 - (_h - _l) * .618
s3x := _o0 - (_h - _l)
s3x
else if _pvt == 'Traditional'
px := math.avg(_h, _l, _c)
s1x := px * 2 - _h
s2x := px - (_h - _l)
s3x := px * 2 - (2 * _h - _l)
s4x := px * 3 - (3 * _h - _l)
s5x := px * 4 - (4 * _h - _l)
r1x := px * 2 - _l
r2x := px + _h - _l
r3x := px * 2 + _h - 2 * _l
r4x := px * 3 + _h - 3 * _l
r5x := px * 4 + _h - 4 * _l
r5x
else if _pvt == 'Woodie'
px := (_h + _l + 2 * _o0) / 4
r1x := 2 * px - _l
r2x := px + _h - _l
r3x := _h + 2 * (px - _l)
r4x := r3x + _h - _l
s1x := 2 * px - _h
s2x := px - (_h - _l)
s3x := _l - 2 * (_h - px)
s4x := s3x - (_h - _l)
s4x
[r6x, r5x, r4x, r3x, r2x, r1x, px, s1x, s2x, s3x, s4x, s5x, s6x]
//------------------------------------------------------------------------------
// Central Pivot Range
f_cpr(_h, _l, _c) =>
[math.avg(_h, _l, _c), math.avg(_h, _l), 2 * math.avg(_h, _l, _c) - math.avg(_h, _l)]
//------------------------------------------------------------------------------
// line/label/alert functions
f_drawLineX(_x1, _y1, _x2, _y2, _xloc, _extend, _color, _style, _width) =>
var id = line.new(_x1, _y1, _x2, _y2, _xloc, _extend, _color, _style, _width)
if _y1 > 0 and _y2 > 0
line.set_xy1(id, _x1, _y1)
line.set_xy2(id, _x2, _y2)
line.set_color(id, _color)
else
line.set_xy1(id, _x1, close)
line.set_xy2(id, _x2, close)
line.set_color(id, #ffffff00)
f_drawOnlyLabelX(_x, _y, _text, _xloc, _yloc, _color, _style, _textcolor, _size, _textalign, _tooltip) =>
label.new(_x, _y, _text, _xloc, _yloc, _color, _style, _textcolor, _size, _textalign, _tooltip)
f_drawLabelX(_x, _y, _text, _xloc, _yloc, _color, _style, _textcolor, _size, _textalign, _tooltip) =>
var id = label.new(_x, _y, _text, _xloc, _yloc, _color, _style, _textcolor, _size, _textalign, _tooltip)
label.set_text(id, _text)
label.set_tooltip(id, _tooltip)
if _y > 0
label.set_xy(id, _x, _y)
label.set_textcolor(id, _textcolor)
else
label.set_xy(id, _x, close)
label.set_textcolor(id, #00000000)
f_crossingLevelX(_price, _level) =>
(_level > _price and _level < _price[1]) or (_level < _price and _level > _price[1])
f_processPivotLevelX(_show, _x1, _y, _x2, _c, _s, _w, _lb, pivot, _levels, _pos) =>
if _show
f_drawLineX(_x1, _y, _x2, _y, xloc.bar_time, extend.none, _c, _s, _w)
if _levels != 'None' and _lb != ''
f_drawLabelX(_pos == 'Last Bar' ? timenow : _x2, _y, (_levels == 'Levels' ? _lb : _lb + ' (' + str.tostring(_y, format.mintick) + ')') + (_pos == 'Last Bar' ? '\n\n' : ''), xloc.bar_time, yloc.price, #00000000, label.style_label_left, _c, size.normal, text.align_left, pivot + ' ' + _lb + ' (' + str.tostring(_y, format.mintick) + ')')
if f_crossingLevelX(close, _y) and _show
alert(pivot + ' (PVTvX) : ' + syminfo.ticker + ' crossing ' + pivot + ' level ' + _lb + ' level, price ' + str.tostring(_y, format.mintick))
f_getStyle(_style) =>
_style == 'Solid' ? line.style_solid : _style == 'Dotted' ? line.style_dotted : line.style_dashed
f_getTradedVolume(_len, _calc, _offset) =>
if _calc
vol = 0.
for x = 0 to _len - 1
vol += volume[_offset + x]
vol
indicator('Pivot Points [KrisWaters] vX by DGT', 'PVTvX ʙʏ DGT ☼☾', true, max_lines_count=275, max_bars_back=5000)
// ---------------------------------------------------------------------------------------------- //
// Definitions ---------------------------------------------------------------------------------- //
group_pick_a_pivot = 'Pivot Points Setup'
group_pp_l = 'Pivot Points Line/Label Customization'
group_tools = 'Tool Add-Ons'
group_indicators = 'Indicator Add-Ons'
group_panel = 'Statistical Panel Add-Ons'
tooltip_pick_a_pivot = 'Pivot Points [KrisWaters] vX is a technical analysis indicator used to determine the overall trend of the market over different time frames. The Pivot Points vX indicator consists of a pivot point (PP) level and several support (S) and resistance (R) levels.\n\n' +
'The following types of the Pivot Points are included:\n - Camarilla\n - DeMark\n - Fibonacci\n - Floor\n - Swing\n - Woodie'
tooltip_tf = 'The indicator resolution is set by the input of the Pivot Points TF. If the Pivot Points TF is set to AUTO (the default value), then the increased resolution is determined by the following algorithm:\n' +
' - for intraday resolutions up to and including 15 min, DAY (1D) is used\n - for intraday resolutions more than 15 min, WEEK (1W) is used\n - for daily resolutions MONTH is used (1M)\n - for weekly and monthly resolutions, 12-MONTH (12M) is used\n\n' +
'ps : difference between Session and Daily - Daily will take into account extended hours (if present on the chart) during pivot calculations, whereas Session will assume only regular trading hours. Session is default value for AUTO pivot timeframe'
tooltip_sentiment = 'Market Sentiment Meter is based on price levels compared to Central Pivot Range (CPR) and selected Pivot Points support and resistance levels'
tooltip_range = 'Displays graphical price range during the higher time frame period as well its previous higher time frame range\nincludes the range numerical display calculated based on selected ATR period and multiplier'
tooltip_panel = 'provides evaluated result of some of most used technical indicators and some custom interpreted indicators'
tooltip_adx_line = '◁ how to read adx colored dmi line ▷ \n' +
'* triangle shapes:\n ▲- bullish : diplus >= diminus\n ▼- bearish : diplus < diminus\n' +
'* colors:\n green - bullish trend : adx >= strongTrend and di+ > di-\n red - bearish trend : adx >= strongTrend and di+ < di- \n gray - no trend : weakTrend < adx < strongTrend\n yellow - weak trend : adx < weakTrend\n' +
'* color density:\n darker : adx growing\n lighter : adx falling'
tooltip_adx = 'ADX Colored Directional Movement Line is custom interpretation of Directional Movement (DMI) with aim to present all 3 DMI indicator components with SINGLE line\n' +
'Plotted on top of the Main Price Chart\n\n' + tooltip_adx_line
tooltip_pvt = 'The Pivot Points High Low indicator aims to predict and determine price changes and potential reversals in the market'
tooltipohlcData = 'Internall Calculated option is when OHLC values are calculated within the script whereus Fetching from \'security()\' function option uses build-in function the get the required OHLC values' +
'\n\nPS1 : Using request.security() function may introduce future leak in scripts which may lead to misleading results' +
'\n\nPS2 : Internall Calculated option is default option in case Start Trading Week from a Specific Day is set to any day other then Monday'
tooltpi_bb = 'A Bollinger Band is a technical analysis tool defined by a set of lines plotted two standard deviations (positively and negatively) away from a simple moving average (SMA) of the security\'s price\n' +
'This customization allows plotting of eight bands that can be adjusted to user preferences'
tooltip_linreg = 'A line that best fits the prices specified over a user-defined time period. It is calculated using the least squares method\n' +
'Both Upper/Lower and Standart Devaiation channels are plotted'
tooltip_log_ema = 'Logistic Map Equation with combination of Exponential Moving Average ( EMA )'
tooltip_pma_line = '◁ how to read volatility colored price/ma line ▷ \n' +
'* triangle shapes:\n ▲ – bullish, price action above moving average\n ▼ – bearish, price action below moving average\n' +
'* colors:\n gray/black - low volatility\n green/red – price action in threshold bands\n dark green/red – price action exceeds threshold bands'
//'evaluation given herein does not constitute professional and/or financial advice'
tooltip_pma = 'Volatility Colored Price/MA Line, Custom interpretation of the idea “Prices high above the moving average (MA) or low below it are likely to be remedied in the future by a reverse price movement”\n' +
'Plotted on bottom of the Main Price Chart\n\n' + tooltip_pma_line +
'\n\nfor further details, please visit study Price Distance to its MA by DGT'
tooltip_vwcb = 'Volume Weighted Bars, a study of Kıvanç Özbilgiç, aims to present whether volume supports price movements'
tooltip_ichimoku = 'The Ichimoku Cloud, is a collection of technical indicators that give it a unique capacity to show support and resistance levels, momentum and trend direction'
tooltip_vwap = 'Volume Weighted Average Price (VWAP) is a technical analysis tool used to measure the average price weighted by volume. VWAP is typically used with intraday charts as a way to determine the general direction of intraday prices. It\'s similar to a moving average in that when price is above VWAP, prices are rising and when price is below VWAP, prices are falling. VWAP is primarily used by technical analysts to identify market trend'
tooltip_rsi = 'Relative strength index. It is calculated based on rma\'s of upward and downward change of x'
tooltip_stoch = 'A stochastic oscillator is a momentum indicator comparing a particular closing price of a security to a range of its prices over a certain period of time'
tooltip_macd = 'Moving average convergence divergence (MACD) is a trend-following momentum indicator that shows the relationship between two moving averages of a security’s price'
// -Inputs ══════════════════════════════════════════════════════════════════════════════════════ //
pivot = input.string('Camarilla', 'Pick a Pivot', options=['Camarilla', 'Classic', 'DeMark', 'Fibonacci', 'Floor', 'Swing', 'Traditional', 'Woodie', '🔕 None'], group=group_pick_a_pivot, tooltip=tooltip_pick_a_pivot)
htf_tf = input.string('Auto', 'Pivot Points Timeframe', options=['Auto', '15 Min', '1 Hour', '4 Hour', 'Session', 'Daily', 'Weekly', 'Monthly', 'Quarterly', 'Yearly'], group=group_pick_a_pivot, tooltip=tooltip_tf)
htf = htf_tf == '15 Min' ? '15' : htf_tf == '1 Hour' ? '60' : htf_tf == '4 Hour' ? '240' : htf_tf == 'Session' ? 'D' : htf_tf == 'Daily' ? 'D' : htf_tf == 'Weekly' ? 'W' : htf_tf == 'Monthly' ? 'M' : htf_tf == 'Quarterly' ? '3M' : htf_tf == 'Yearly' ? '12M' :
timeframe.isintraday and (timeframe.period == '1' or timeframe.period == '3' or timeframe.period == '5' or timeframe.period == '15') ? 'D' :
timeframe.isintraday and (timeframe.period == '30' or timeframe.period == '45' or timeframe.period == '60' or timeframe.period == '120' or timeframe.period == '180' or timeframe.period == '240') ? 'W' :
timeframe.isdaily ? 'M' : timeframe.isweekly or timeframe.ismonthly ? '12M' : '3M'
ohlcData = input.string('Internally Calculated', '* OHLC Data Source', options = ['Internally Calculated', 'Fetching from \'security()\' function'], group=group_pick_a_pivot, tooltip = tooltipohlcData )
customStrat = input.string('Monday', '* Start Trading Week from a Specific Day', options=['Monday', 'Tuesday', 'Wednesday', 'Thursday', 'Friday', 'Saturday', 'Sunday'], group=group_pick_a_pivot, tooltip='Applicable for Weekly Pivot Points Timeframe only')
wStart = switch customStrat
'Monday' => 2//dayofweek.monday
'Tuesday' => 3//dayofweek.tuesday
'Wednesday' => 4//dayofweek.wednesday
'Thursday' => 5//dayofweek.thursday
'Friday' => 6//dayofweek.friday
'Saturday' => 7//dayofweek.saturday
'Sunday' => 1//dayofweek.sunday
srLabel = input.string('Levels (Prices)', 'Pivot S&R Level Labels', options=['Levels', 'Levels (Prices)', 'None'], inline = 'LBL', group=group_pick_a_pivot)
srLabelPos = input.string('Pivot End', '', options=['Last Bar', 'Pivot End'], inline = 'LBL', group=group_pick_a_pivot)
i_show_r = input.bool(true, 'Resistance Lines', inline='rLevel11', group=group_pick_a_pivot)
i_style_r = input.string('Solid', '', options=['Dashed', 'Dotted', 'Solid'], inline='rLevel11', group=group_pick_a_pivot)
i_width_r = input.int(2, '', minval=1, inline='rLevel11', group=group_pick_a_pivot)
i_color_r1 = input.color(#e91e63, 'R1', inline='rLevel13', group=group_pick_a_pivot)
i_color_r2 = input.color(#e91e63, 'R2', inline='rLevel13', group=group_pick_a_pivot)
i_color_r3 = input.color(#e91e63, 'R3', inline='rLevel13', group=group_pick_a_pivot)
i_color_r4 = input.color(#e91e63, 'R4', inline='rLevel13', group=group_pick_a_pivot)
i_color_r5 = input.color(#e91e63, 'R5', inline='rLevel13', group=group_pick_a_pivot)
i_color_r6 = input.color(#e91e63, 'R6', inline='rLevel13', group=group_pick_a_pivot)
i_show_p = input.bool(true, 'Pivot Point Line', inline='ppLeve', group=group_pick_a_pivot)
i_color_p = input.color(#0000f0, ' ', inline='ppLeve', group=group_pick_a_pivot)
i_style_p = input.string('Solid', '', options=['Dashed', 'Dotted', 'Solid'], inline='ppLeve', group=group_pick_a_pivot)
i_width_p = input.int(2, '', minval=1, inline='ppLeve', group=group_pick_a_pivot)
i_show_s = input.bool(true, 'Support Lines ', inline='sLevel1', group=group_pick_a_pivot)
i_style_s = input.string('Solid', '', options=['Dashed', 'Dotted', 'Solid'], inline='sLevel1', group=group_pick_a_pivot)
i_width_s = input.int(2, '', minval=1, inline='sLevel1', group=group_pick_a_pivot)
i_color_s1 = input.color(#26a69a, 'S1', inline='sLevel', group=group_pick_a_pivot)
i_color_s2 = input.color(#26a69a, 'S2', inline='sLevel', group=group_pick_a_pivot)
i_color_s3 = input.color(#26a69a, 'S3', inline='sLevel', group=group_pick_a_pivot)
i_color_s4 = input.color(#26a69a, 'S4', inline='sLevel', group=group_pick_a_pivot)
i_color_s5 = input.color(#26a69a, 'S5', inline='sLevel', group=group_pick_a_pivot)
i_color_s6 = input.color(#26a69a, 'S6', inline='sLevel', group=group_pick_a_pivot)
i_midPvt = input.bool(false, 'Display Middle Pivot S&R Level Lines', group=group_pick_a_pivot)
dispWM = input.string('None', 'Add Weekly/Monthly Pivots', options=['Both', 'Weekly', 'Monthly', 'None'], group=group_pick_a_pivot)
dispHist = input.string('None', 'Show Historical Pivots', options=['Selected Pivots', 'Central Pivot Range', 'Both', 'None'], group=group_pick_a_pivot)
i_dispPVT = input.bool(true, 'Subsequent Pivots, Hours Prior to Session End', inline='SPVT', group=group_pick_a_pivot)
i_when = input.int(6, '', minval=1, inline='SPVT', group=group_pick_a_pivot)
dispCPR = input.bool(true, 'Central Pivot Range', group=group_pick_a_pivot)
i_color_tc = input.color(#fa8072, 'TC', inline='CPR', group=group_pick_a_pivot)
i_color_cpr = input.color(#4262ba, 'CPR', inline='CPR', group=group_pick_a_pivot)
i_color_bc = input.color(#9ef2e8, 'BC', inline='CPR', group=group_pick_a_pivot)
i_style_cpr = input.string('Dotted', '', options=['Dashed', 'Dotted', 'Solid'], inline='CPR', group=group_pick_a_pivot)
i_width_cpr = input.int(2, '', minval=1, inline='CPR', group=group_pick_a_pivot)
dispOHLC = input.bool(true, 'Previous HTF OHLC', inline='OHLC', group=group_pick_a_pivot)
i_show_o = input.bool(true, 'O', inline='OHLC', group=group_pick_a_pivot)
i_show_h = input.bool(true, 'H', inline='OHLC', group=group_pick_a_pivot)
i_show_l = input.bool(true, 'L', inline='OHLC', group=group_pick_a_pivot)
i_show_c = input.bool(true, 'C', inline='OHLC', group=group_pick_a_pivot)
i_style_ohlc = input.string('Dashed', '', options=['Dashed', 'Dotted', 'Solid'], inline='OHLC', group=group_pick_a_pivot)
addons = input.bool(true, '|----------| Add-Ons On/Off |----------|', group='Add-Ons')
isMeter = input.bool(true, 'Market Sentiment Meter', group=group_tools, tooltip=tooltip_sentiment)
msmHOffset = input.int(-23, ' Offset : Horizontal', inline='MSM', group=group_tools)
msmVOffset = input.int(0, 'Vertical', inline='MSM', group=group_tools) / 10
isRange = input.bool(true, 'Price Range Meter / ATR Range Meter ', group=group_tools, tooltip=tooltip_range)
atrLength = input.int(14 , ' ATR : Length', inline='ATR', group=group_tools)
atrRange = input.float(2. , 'Mult', step=.1, inline='ATR', group=group_tools)
prmHOffset = input.int(-13, ' Offset : Horizontal', inline='PRM', group=group_tools) * ta.change(time)
prmVOffset = input.int(-7, 'Vertical', inline='PRM', group=group_tools) / 10
isLabel = input.bool(true, 'Statistical Panel', inline='STAT', group=group_tools, tooltip=tooltip_panel)
//pLabel = input.int(0 , '', inline='STAT', group=group_tools)
i_textSize = input.string('Small', '', options=['Tiny', 'Small', 'Normal', 'Large'], inline='STAT', group=group_tools)
statPos = input.string('Top Right', '', options=['Top Left', 'Top Center', 'Top Right', 'Middle Right', 'Bottom Left', 'Bottom Center'], inline='STAT', group=group_tools)
dispPVT = input.bool(true , 'Pivot Points High Low ------------------|', group=group_indicators, tooltip=tooltip_pvt)
pvtLength = input.int(20, " Pivot Points High Low : Left/Right Length", minval=1, group=group_indicators)
pvtPrice = input(true, "Pivot Points High Low : Display Pivot High/Low Price", group=group_indicators)
pvtChange = input(true, "Pivot Points High Low : Display Pivot High/Low Price Change", group=group_indicators)
pvtVolume = input(true, "Pivot Points High Low : Display Cumulative Volume", group=group_indicators)
pvtText = input.string('Small', " Pivot Points High Low : Text Size", options=['Tiny', 'Small', 'Normal'], group=group_indicators)
pvtTextSize = pvtText == 'Small' ? size.small : pvtText == 'Normal' ? size.normal : size.tiny
dispBB = input.bool(true , 'Bollinger Bands ------------------|', group=group_indicators, tooltip=tooltpi_bb)
extendBB = input.bool(false, 'Bollinger Bands : Extend Bands Display', group=group_indicators)
//gShow = input.bool(false, 'Bollinger Bands : Fill Background', group=group_indicators)
bbSrc = input.source(close, ' Bollinger Bands : Source', group=group_indicators)
bbLen = input.int(21 , ' Bollinger Bands : Length', minval=1, group=group_indicators)
bbMult1 = input.float(1. , ' Bollinger Bands : 1st Band Multiplier', minval=1, group=group_indicators)
bbMult2 = input.float(1.618, ' Bollinger Bands : 2nd Band Multiplier', minval=1, group=group_indicators)
bbMult3 = input.float(2.618, ' Bollinger Bands : 3rd Band Multiplier', minval=1, group=group_indicators)
//bbMult4 = input.float(3.618, ' Bollinger Bands : 4th Band Multiplier', minval=1, group=group_indicators)
dispDM = input.bool(true, 'ADX Colored DMI Line ------------------|', group=group_indicators, tooltip=tooltip_adx)
adxS = input.int(14, ' DMI : ADX Smoothing', minval=1, group=group_indicators)
diLen = input.int(14, ' DMI : DI Length', minval=1, group=group_indicators)
strTr = input.int(25, ' DMI : Strong Trend Theshold', group=group_indicators)
wkTr = input.int(17, ' DMI : Weak Trend Theshold', group=group_indicators)
dispPM = input.bool(true, 'Volatility Colored Price/MA Line ----------|', group=group_indicators, tooltip=tooltip_pma)
pmrLen = input.int(21 , ' P/MA : MA Length', minval=1, group=group_indicators)
stDevL = input.float(.75, ' P/MA : Lower Deviation', minval=0, step=.25, maxval=3, group=group_indicators)
stDevH = input.float(2. , ' P/MA : Higher Deviation', minval=0, step=.25, maxval=3, group=group_indicators)
vwcb = input.bool(true, 'Volume Weighted Colored Bars ------------|', group=group_indicators, tooltip=tooltip_vwcb)
vwcbLen = input.int(21 , ' VWCB : Volume MA Length', minval=1, group=group_indicators)
vwcbUpper = input.float(1.618, ' VWCB : Upper Theshold', minval=0.1, step=.1, group=group_indicators)
vwcbLower = input.float(.618 , ' VWCB : Lower Theshold', minval=0.1, step=.1, group=group_indicators)
dispLEMA = input.bool(true, 'Logistic EMA (LEMA) ------------------|', group=group_indicators, tooltip=tooltip_log_ema)
lemaSrc = input.source(close, ' LEMA : Source', group=group_indicators)
lemaLen = input.int(21 , ' LEMA : Length', minval=1, maxval=50, group=group_indicators)
vwapPlot = input.bool(true, 'Volume Weighted Average Price (VWAP) -------|', group=group_indicators, tooltip=tooltip_vwap)
//hideonDWM = input.bool(false, title='⮩ VWAP : Hide VWAP on 1D or Above', group=group_indicators)
//var anchor = input.string(defval='Session', title=' ⮩ VWAP : Anchor Period', options=['Session', 'Week', 'Month', 'Quarter', 'Year', 'Decade', 'Century'], group=group_indicators)
src = input.source(title=' VWAP : Source', defval=hlc3, group=group_indicators)
offset = input.int(0, title=' VWAP : Offset', group=group_indicators)
showBands = input.bool(true, title='VWAP : Calculate Bands, ', inline='VWAP', group=group_indicators)
stdevMult = input.float(1.0, title='Bands Multiplier', inline='VWAP', group=group_indicators)
ichimoku = input.bool(true, 'Ichimoku Cloud Projection ---------------|', group=group_indicators, tooltip=tooltip_ichimoku)
showKumo = input.bool(true, 'Ichimoku : Extend Kumo Cloud Display', group=group_indicators)
conversionPeriods = input.int(9 , ' Ichimoku : Conversion Line Periods', minval=1, group=group_indicators)
basePeriods = input.int(26, ' Ichimoku : Base Line Periods', minval=1, group=group_indicators)
laggingSpan2Periods = input.int(52, ' Ichimoku : Lagging Span 2 Periods', minval=1, group=group_indicators)
displacement = input.int(26, ' Ichimoku : Displacement', minval=1, group=group_indicators)
linreg = input.bool(true, 'Linear Regression -------------------|', group=group_indicators, tooltip=tooltip_linreg)
upperMult = input.int(2, ' LinReg : Upper Deviation', inline='lrUp', group=group_indicators)
style_lrU = input.string('Solid', '', options=['Dashed', 'Dotted', 'Solid'], inline='lrUp', group=group_indicators)
lowerMult = input.int(-2, ' LinReg : Lower Deviation', inline='lrDn', group=group_indicators)
style_lrD = input.string('Solid', '', options=['Dashed', 'Dotted', 'Solid'], inline='lrDn', group=group_indicators)
showPearson = input.bool(false, 'LinReg : Show Pearson`s R', group=group_indicators)
pearsonAlert = input.float(.68, ' LinReg : Pearson`s R Threshold' , group=group_indicators, tooltip = 'Triggers alert when specified threshold of Pearson\'s R value exceeds')
extendLines = input.bool(false, 'LinReg : Extend Lines', group=group_indicators)
linregLength = input.int(100, ' LinReg : Count', minval=2, maxval=300, group=group_indicators)
linregSrc = input.source(close, ' LinReg : Source', group=group_indicators)
linregCUp = input.color(color.blue, ' LinReg : Positive Slope ', inline='Lcol', group=group_indicators)
linregCDn = input.color(color.blue, 'Negative Slope', inline = 'Lcol', group=group_indicators)
dummy6 = input.bool(false, 'RSI Oscillator -------------------------|', group=group_panel, tooltip=tooltip_rsi)
rsiSrc = input.source(close, ' RSI : Source', group=group_panel)
rsiLength = input.int(14, ' RSI : Length', minval=1, group=group_panel)
rsiOversold = input.int(30, ' RSI : OverSold Theshold', minval=1, group=group_panel)
rsiOverbought = input.int(70, ' RSI : OverBought Theshold', minval=1, group=group_panel)
dummy7 = input.bool(false, 'Stochastic Oscillator ----------------|', group=group_panel, tooltip=tooltip_stoch)
stochLengthK = input.int(14, ' Stoch : %K', minval=1, group=group_panel)
stochLengthD = input.int(3 , ' Stoch : %D', minval=1, group=group_panel)
stochSmoothingK = input.int(3 , ' Stoch : Smoothing', minval=1, group=group_panel)
stochOversold = input.int(20, ' Stoch : OverSold Theshold', minval=1, group=group_panel)
stochOverbought = input.int(80, ' Stoch : OverBought Theshold', minval=1, group=group_panel)
dummy8 = input.bool(false, 'MACD Oscillator -----------------|', group=group_panel, tooltip=tooltip_macd)
macdSrc = input.source(close, ' MACD : Source', group=group_panel)
macdFastLength = input.int(12, ' MACD : Fast Length', minval=1, group=group_panel)
macdSlowLength = input.int(26, ' MACD : Slow Length', minval=1, group=group_panel)
macdSignalLength = input.int(9 , ' MACD : Signal Smoothing Length', minval=1, group=group_panel)
pll = input.int(987, 'Indicator and Historical Pivots', group='Ploting Length')
// -Calculations ════════════════════════════════════════════════════════════════════════════════ //
[htf_o1s, htf_h1s, htf_l1s, htf_c1s, htf_os] = request.security(syminfo.tickerid, htf, [open[1], high[1], low[1], close[1], open], lookahead = barmerge.lookahead_on)
[htf_o1, htf_h1, htf_l1, htf_c1, htf_o , htf_h, htf_l, htf_c] = f_htf_ohlc(true, htf, htf_tf, wStart)
htf_o1 := customStrat != 'Monday' ? htf_o1 : ohlcData == 'Internally Calculated' ? htf_o1 : htf_o1s
htf_h1 := customStrat != 'Monday' ? htf_h1 : ohlcData == 'Internally Calculated' ? htf_h1 : htf_h1s
htf_l1 := customStrat != 'Monday' ? htf_l1 : ohlcData == 'Internally Calculated' ? htf_l1 : htf_l1s
htf_c1 := customStrat != 'Monday' ? htf_c1 : ohlcData == 'Internally Calculated' ? htf_c1 : htf_c1s
htf_o := customStrat != 'Monday' ? htf_o : ohlcData == 'Internally Calculated' ? htf_o : htf_os
[htf_ows, htf_hws, htf_lws, htf_cws, htf_ow0s] = request.security(syminfo.tickerid, 'W', [open[1], high[1], low[1], close[1], open], lookahead = barmerge.lookahead_on)
[htf_ow, htf_hw, htf_lw, htf_cw, htf_ow0, _ , _ , _ ] = f_htf_ohlc(htf != 'W' and (dispWM == 'Both' or dispWM == 'Weekly' ), 'W', '', wStart)
htf_ow := customStrat != 'Monday' ? htf_ow : ohlcData == 'Internally Calculated' ? htf_ow : htf_ows
htf_hw := customStrat != 'Monday' ? htf_hw : ohlcData == 'Internally Calculated' ? htf_hw : htf_hws
htf_lw := customStrat != 'Monday' ? htf_lw : ohlcData == 'Internally Calculated' ? htf_lw : htf_lws
htf_cw := customStrat != 'Monday' ? htf_cw : ohlcData == 'Internally Calculated' ? htf_cw : htf_cws
htf_ow0 := customStrat != 'Monday' ? htf_ow0 : ohlcData == 'Internally Calculated' ? htf_ow0 : htf_ow0s
[htf_oms, htf_hms, htf_lms, htf_cms, htf_om0s] = request.security(syminfo.tickerid, 'M', [open[1], high[1], low[1], close[1], open], lookahead = barmerge.lookahead_on)
[htf_om, htf_hm, htf_lm, htf_cm, htf_om0, _ , _ , _ ] = f_htf_ohlc(htf != 'M' and (dispWM == 'Both' or dispWM == 'Monthly'), 'M', '', wStart)
htf_om := ohlcData == 'Internally Calculated' ? htf_om : htf_oms
htf_hm := ohlcData == 'Internally Calculated' ? htf_hm : htf_hms
htf_lm := ohlcData == 'Internally Calculated' ? htf_lm : htf_lms
htf_cm := ohlcData == 'Internally Calculated' ? htf_cm : htf_cms
htf_om0 := ohlcData == 'Internally Calculated' ? htf_om0 : htf_om0s
[r6m, r5m, r4m, r3m, r2m, r1m, pm, s1m, s2m, s3m, s4m, s5m, s6m] = f_get_pivot(htf != 'M' and (dispWM == 'Both' or dispWM == 'Monthly'), pivot, htf_om, htf_hm, htf_lm, htf_cm, htf_om0)
[r6w, r5w, r4w, r3w, r2w, r1w, pw, s1w, s2w, s3w, s4w, s5w, s6w] = f_get_pivot(htf != 'W' and (dispWM == 'Both' or dispWM == 'Weekly' ), pivot, htf_ow, htf_hw, htf_lw, htf_cw, htf_ow0)
[r61, r51, r41, r31, r21, r11, p1, s11, s21, s31, s41, s51, s61] = f_get_pivot(pivot != '🔕 None', pivot, htf_o1, htf_h1, htf_l1, htf_c1, htf_o )
[r6 , r5 , r4 , r3 , r2 , r1 , p , s1 , s2 , s3 , s4 , s5 , s6 ] = f_get_pivot(true , pivot, htf_o , htf_h , htf_l , htf_c , htf_o )
[cpr1, bc1, tc1] = f_cpr(htf_h1, htf_l1, htf_c1)
[cpr, bc, tc] = f_cpr(htf_h , htf_l , htf_c )
//------------------------------------------------------------------------------
// Linear Regression - Build-in : slight presentation changes
extend = extendLines ? extend.right : extend.none
calcSlope(linregSrc, linregLength) =>
max_bars_back(linregSrc, 300)
if not barstate.islast or linregLength <= 1
[float(na), float(na), float(na)]
else
sumX = 0.0
sumY = 0.0
sumXSqr = 0.0
sumXY = 0.0
for i = 0 to linregLength - 1 by 1
val = linregSrc[i]
per = i + 1.0
sumX += per
sumY += val
sumXSqr += per * per
sumXY += val * per
sumXY
slope = (linregLength * sumXY - sumX * sumY) / (linregLength * sumXSqr - sumX * sumX)
average = sumY / linregLength
intercept = average - slope * sumX / linregLength + slope
[slope, average, intercept]
[slope, average, intercept] = calcSlope(linregSrc, linregLength)
calcDev(linregSrc, linregLength, slope, average, intercept) =>
upDev = 0.0
dnDev = 0.0
stdDevAcc = 0.0
dsxx = 0.0
dsyy = 0.0
dsxy = 0.0
periods = linregLength - 1
daY = intercept + slope * periods / 2
val = intercept
for i = 0 to periods by 1
price = high[i] - val
if price > upDev
upDev := price
upDev
price := val - low[i]
if price > dnDev
dnDev := price
dnDev
price := linregSrc[i]
dxt = price - average
dyt = val - daY
price -= val
stdDevAcc += price * price
dsxx += dxt * dxt
dsyy += dyt * dyt
dsxy += dxt * dyt
val += slope
val
stdDev = math.sqrt(stdDevAcc / (periods == 0 ? 1 : periods))
pearsonR = dsxx == 0 or dsyy == 0 ? 0 : dsxy / math.sqrt(dsxx * dsyy)
[stdDev, pearsonR, upDev, dnDev]
[stdDev, pearsonR, upDev, dnDev] = calcDev(linregSrc, linregLength, slope, average, intercept)
startPrice = intercept + slope * (linregLength - 1)
endPrice = intercept
if addons and linreg //and barstate.islast
iStart = bar_index - linregLength + 1
iEnd = bar_index
style_lru = f_getStyle(style_lrU), style_lrd = f_getStyle(style_lrD)
f_drawLineX(iStart, startPrice , iEnd, endPrice , xloc.bar_index, extend, startPrice > endPrice ? linregCDn : linregCUp, line.style_solid , 1)
f_drawLineX(iStart, startPrice + upperMult * stdDev, iEnd, endPrice + upperMult * stdDev, xloc.bar_index, extend, startPrice > endPrice ? linregCDn : linregCUp, style_lru, 2)
f_drawLineX(iStart, startPrice + lowerMult * stdDev, iEnd, endPrice + lowerMult * stdDev, xloc.bar_index, extend, startPrice > endPrice ? linregCDn : linregCUp, style_lrd, 2)
f_drawLineX(iStart, startPrice + upDev , iEnd, endPrice + upDev , xloc.bar_index, extend, startPrice > endPrice ? linregCDn : linregCUp, style_lru, 3)
f_drawLineX(iStart, startPrice - dnDev , iEnd, endPrice - dnDev , xloc.bar_index, extend, startPrice > endPrice ? linregCDn : linregCUp, style_lrd, 3)
if f_crossingLevelX(close, endPrice)
alert('LinReg (PVTvX) : ' + syminfo.ticker + ' crossing linear regression line')
if f_crossingLevelX(close, endPrice + upperMult * stdDev)
alert('LinReg (PVTvX) : ' + syminfo.ticker + ' crossing linear regression upper standart deviation line')
if f_crossingLevelX(close, endPrice + lowerMult * stdDev)
alert('LinReg (PVTvX) : ' + syminfo.ticker + ' crossing linear regression lower standart deviation line')
if f_crossingLevelX(close, endPrice + upDev)
alert('LinReg (PVTvX) : ' + syminfo.ticker + ' crossing linear regression upper deviation line')
if f_crossingLevelX(close, endPrice - upDev)
alert('LinReg (PVTvX) : ' + syminfo.ticker + ' crossing linear regression lower deviation line')
if f_crossingLevelX(pearsonR, pearsonAlert)
alert('LinReg (PVTvX) : ' + syminfo.ticker + ' crossing pearsonR threshold')
if addons and linreg and showPearson and not na(pearsonR)
f_drawLabelX(bar_index - linregLength + 1, startPrice - dnDev, str.tostring(pearsonR, '#.###'), xloc.bar_index, yloc.price, #00000000, label.style_label_up, #f000ff, size.normal, text.align_center, 'Pearson`s R')
//------------------------------------------------------------------------------
// ADX Colored Directional Movement Index Line by DGT
[diplus, diminus, adxValue] = ta.dmi(diLen, adxS)
dmiBull = diplus >= diminus and adxValue >= strTr
dmiBear = diplus < diminus and adxValue >= strTr
dmiWeak = adxValue < strTr and adxValue > wkTr
dmiColor = dmiBull ? adxValue > adxValue[1] ? #006400 : color.green : dmiBear ? adxValue > adxValue[1] ? #910000 : color.red : dmiWeak ? adxValue > adxValue[1] ? color.black : color.gray : adxValue > adxValue[1] ? #FFC40C : color.yellow
//------------------------------------------------------------------------------
// Price Distance to its Moving Average by DGT
pmar = (close / ta.sma(close, pmrLen) - 1) * 100
[_, uL, lL] = ta.bb(pmar, pmrLen * 10, stDevL)
[_, uH, lH] = ta.bb(pmar, pmrLen * 10, stDevH)
[pmaColor, pmaText, pmaText1] = if pmar >= 0
if pmar > uH
[color.green, 'strong\nbullish', 'over overbought zone']
else if pmar < uH and pmar > uL
[color.green, 'bullish', 'in overbought zone']
else
[color.black, 'trendless', 'low volotile price action in bullish zone']
else
if pmar < lH
[color.red, ' strong\nbearish', 'below oversold zone']
else if pmar > lH and pmar < lL
[color.red , 'bearish', 'in oversold zone']
else
[color.black, 'trendless', 'low volotile price action in bearish zone']
//------------------------------------------------------------------------------
// Volume Weighted Colored Bars by Kıvanç ÖZBİLGİÇ
nzVolume = nz(volume)
volMA = ta.sma(nzVolume, vwcbLen)
B = nzVolume * (close - low) / (high - low)
S = nzVolume * (high - close) / (high - low)
vwcbColor = if close < open
if nzVolume > volMA * vwcbUpper
#910000
else if nzVolume < volMA * vwcbLower
#FF9800
else
if nzVolume > volMA * vwcbUpper
#006400
else if nzVolume < volMA * vwcbLower
#7FFFD4
//------------------------------------------------------------------------------
// Pivot Points High Low - build-in, slight presentation changes
pvtHigh = ta.pivothigh(pvtLength, pvtLength)
pvtLow = ta.pivotlow (pvtLength, pvtLength)
proceed = not na(pvtHigh) or not na(pvtLow)
pvtLengthTemp = 3
pvtHighTemp = ta.pivothigh(pvtLengthTemp, pvtLengthTemp)
pvtLowTemp = ta.pivotlow (pvtLengthTemp, pvtLengthTemp)
proceedTemp = not na(pvtHighTemp) or not na(pvtLowTemp)
var x1 = 0
var x2 = 0
var x2Temp = 0
var pvtHigh1 = 0.
var pvtLow1 = 0.
var pvtHigh1Temp = 0.
var pvtLow1Temp = 0.
//var pvtLast = ''
if proceed
x1 := x2
x2 := bar_index
if proceedTemp
x2Temp := bar_index
profileLength = x2 - x1
profileLengthTemp = x2Temp - pvtLengthTemp - x2 + pvtLength
//------------------------------------------------------------------------------
// Ichimoku Cloud - build-in, slight presentation changes
donchian(len) =>
math.avg(ta.lowest(len), ta.highest(len))
conversionLine = donchian(conversionPeriods)
baseLine = donchian(basePeriods)
leadLine1 = math.avg(conversionLine, baseLine)
leadLine2 = donchian(laggingSpan2Periods)
aboveCloud = close > leadLine1[displacement - 1] and close > leadLine2[displacement - 1]
belowCloud = close < leadLine1[displacement - 1] and close < leadLine2[displacement - 1]
inCloud = close > leadLine1[displacement - 1] and close < leadLine2[displacement - 1] or close < leadLine1[displacement - 1] and close > leadLine2[displacement - 1]
//------------------------------------------------------------------------------
// Bollinger Bands - build-in
[_, u1, l1] = ta.bb(bbSrc, bbLen, bbMult1)
[_, u2, l2] = ta.bb(bbSrc, bbLen, bbMult2)
[_, u3, l3] = ta.bb(bbSrc, bbLen, bbMult3)
//[_, u4, l4] = ta.bb(bbSrc, bbLen, bbMult4)
//------------------------------------------------------------------------------
// Logistic EMA by DGT - custum application of Logistic Map Equation
// https://www.tradingview.com/script/jUuBT0bO-Logistic-EMA-w-Signals-by-DGT/
logeq(_source, _length) =>
ta.change(_source, _length) / _source[_length] * _source / ta.highest(_length) * (1 - _source / ta.highest(_length))
logema(_source, _length) =>
(logeq(lemaSrc, lemaLen) + 1) * ta.ema(_source, _length)
lema = logema(lemaSrc, lemaLen)
lema50 = logema(lemaSrc, 50)
lema100 = logema(lemaSrc, 100)
lema200 = logema(lemaSrc, 200)
lemaHigh = logema(high, 11)
lemaLow = logema(low, 23)
dir = close > lemaHigh[1] ? 1 : close < lemaLow[1] ? -1 : 0
trend = ta.valuewhen(dir != 0, dir, 0)
maColor = lema > lema200 ? lema > lema100 ? lema > lema50 ? color.olive : color.aqua : color.orange : color.maroon
hlColor = trend == 1 ? #006400 : #910000
//------------------------------------------------------------------------------
// Trading Psychology - Fear & Greed Index by DGT : Panel Add-On
// https://www.tradingview.com/script/HfNGbuRt-Trading-Psychology-Fear-Greed-Index-by-DGT/
slowLength = 144
fastLength = 21
smoothLen = 5
pmacd = (close / ta.ema(close, slowLength) - 1) * 100
ror = ta.change(close, slowLength) / close[slowLength] * 100
accDist = close == high and close == low or high == low ? 0 : (2 * close - low - high) / (high - low)
moneyFlow = math.sum(accDist * nzVolume, fastLength) / math.sum(nzVolume, fastLength) * 100
vix = request.security('VIX', timeframe.period, -(close / ta.ema(close, slowLength) - 1) * 100, barmerge.gaps_off, barmerge.lookahead_on)
gold = request.security('GOLD', timeframe.period, -(1 - close[fastLength] / close) * 100, barmerge.gaps_off, barmerge.lookahead_on)
avg = nzVolume ? math.avg(pmacd, ror, vix, gold, moneyFlow) : math.avg(pmacd, ror, vix, gold)
feargreed = ta.rma(avg, smoothLen)
//------------------------------------------------------------------------------
// VWAP - build-in
computeVWAP(src, isNewPeriod, stDevMultiplier) =>
var float sumSrcVol = na
var float sumVol = na
var float sumSrcSrcVol = na
sumSrcVol := isNewPeriod ? src * volume : src * volume + sumSrcVol[1]
sumVol := isNewPeriod ? volume : volume + sumVol[1]
// sumSrcSrcVol calculates the dividend of the equation that is later used to calculate the standard deviation
sumSrcSrcVol := isNewPeriod ? volume * math.pow(src, 2) : volume * math.pow(src, 2) + sumSrcSrcVol[1]
_vwap = sumSrcVol / sumVol
variance = sumSrcSrcVol / sumVol - math.pow(_vwap, 2)
variance := variance < 0 ? 0 : variance
stDev = math.sqrt(variance)
lowerBand = _vwap - stDev * stDevMultiplier
upperBand = _vwap + stDev * stDevMultiplier
[_vwap, lowerBand, upperBand]
//timeChange(period) =>
// ta.change(time(period))
isNewPeriod = ta.change(time(htf))
//na(src[1]) ? true : anchor == 'Session' ? timeChange('D') : anchor == 'Week' ? timeChange('W') : anchor == 'Month' ? timeChange('M') : anchor == 'Quarter' ? timeChange('3M') : anchor == 'Year' ? timeChange('12M') : anchor == 'Decade' ? timeChange('12M') and year % 10 == 0 : anchor == 'Century' ? timeChange('12M') and year % 100 == 0 : false
float vwapValue = na
float std = na
float upperBandValue = na
float lowerBandValue = na
//if not(hideonDWM and timeframe.isdwm)
[_vwap, bottom, top] = computeVWAP(src, isNewPeriod, stdevMult)
vwapValue := _vwap
upperBandValue := showBands ? top : na
lowerBandValue := showBands ? bottom : na
// -Plotting ════════════════════════════════════════════════════════════════════════════════════ //
time_x1w = ta.valuewhen(ta.change(time('W')), time, 0)
time_x1m = ta.valuewhen(ta.change(time('M')), time, 0)
//time_x10 = ta.valuewhen(ta.change(time(htf)), time, 1)
//time_x11 = ta.valuewhen(ta.change(time(htf)), time, 0)
var time_x10 = 0
var time_x11 = 0
if htf == 'D' and htf_tf == 'Daily' ? dayofweek != dayofweek[1] : htf == 'W' ? dayofweek(time) == wStart and ta.change(time('D')) : ta.change(time(htf))
time_x10 := time_x11
time_x11 := time
time_x21 = 2 * time_x11 - time_x10
time_x1 = time_x21 + math.round(ta.change(time) * 7)
time_x2 = time_x21 + math.round(ta.change(time) * 13)
islast = request.security(syminfo.tickerid, htf, barstate.islast, lookahead=barmerge.lookahead_on)
htf_time = htf == 'D' and htf_tf == 'Daily' ? dayofweek != dayofweek[1] : htf == 'W' ? dayofweek(time) == wStart and ta.change(time('D')) : ta.change(time(htf)) //ta.change(time(htf))
//------------------------------------------------------------------------------
// Pivots
when = barstate.islast and pivot != '🔕 None' and i_dispPVT and time_x21 - timenow < 3600000 * i_when
style_r = f_getStyle(i_style_r)
f_processPivotLevelX(when and i_show_r, time_x1, r6, time_x2, i_color_r6, style_r, i_width_r, '', pivot, srLabel, srLabelPos)
f_processPivotLevelX(when and i_show_r, time_x1, r5, time_x2, i_color_r5, style_r, i_width_r, '', pivot, srLabel, srLabelPos)
f_processPivotLevelX(when and i_show_r, time_x1, r4, time_x2, i_color_r4, style_r, i_width_r, '', pivot, srLabel, srLabelPos)
f_processPivotLevelX(when and i_show_r, time_x1, r3, time_x2, i_color_r3, style_r, i_width_r, '', pivot, srLabel, srLabelPos)
f_processPivotLevelX(when and i_show_r, time_x1, r2, time_x2, i_color_r2, style_r, i_width_r, '', pivot, srLabel, srLabelPos)
f_processPivotLevelX(when and i_show_r, time_x1, r1, time_x2, i_color_r1, style_r, i_width_r, '', pivot, srLabel, srLabelPos)
style_p = f_getStyle(i_style_p)
f_processPivotLevelX(when and i_show_p, time_x1, p, time_x2, i_color_p, style_p, i_width_p, '', pivot, srLabel, srLabelPos)
style_s = f_getStyle(i_style_s)
f_processPivotLevelX(when and i_show_s, time_x1, s1, time_x2, i_color_s1, style_s, i_width_s, '', pivot, srLabel, srLabelPos)
f_processPivotLevelX(when and i_show_s, time_x1, s2, time_x2, i_color_s2, style_s, i_width_s, '', pivot, srLabel, srLabelPos)
f_processPivotLevelX(when and i_show_s, time_x1, s3, time_x2, i_color_s3, style_s, i_width_s, '', pivot, srLabel, srLabelPos)
f_processPivotLevelX(when and i_show_s, time_x1, s4, time_x2, i_color_s4, style_s, i_width_s, '', pivot, srLabel, srLabelPos)
f_processPivotLevelX(when and i_show_s, time_x1, s5, time_x2, i_color_s5, style_s, i_width_s, '', pivot, srLabel, srLabelPos)
f_processPivotLevelX(when and i_show_s, time_x1, s6, time_x2, i_color_s6, style_s, i_width_s, '', pivot, srLabel, srLabelPos)
when := barstate.islast and pivot != '🔕 None'
f_processPivotLevelX(when and i_show_r, time_x11, r61, time_x21, i_color_r6, style_r, i_width_r, 'R6', pivot, srLabel, srLabelPos)
f_processPivotLevelX(when and i_show_r, time_x11, r51, time_x21, i_color_r5, style_r, i_width_r, 'R5', pivot, srLabel, srLabelPos)
f_processPivotLevelX(when and i_show_r, time_x11, r41, time_x21, i_color_r4, style_r, i_width_r, 'R4', pivot, srLabel, srLabelPos)
f_processPivotLevelX(when and i_show_r, time_x11, r31, time_x21, i_color_r3, style_r, i_width_r, 'R3', pivot, srLabel, srLabelPos)
f_processPivotLevelX(when and i_show_r, time_x11, r21, time_x21, i_color_r2, style_r, i_width_r, 'R2', pivot, srLabel, srLabelPos)
f_processPivotLevelX(when and i_show_r, time_x11, r11, time_x21, i_color_r1, style_r, i_width_r, 'R1', pivot, srLabel, srLabelPos)
f_processPivotLevelX(when and i_show_r and i_midPvt, time_x11, r61 > 0 and r51 > 0 ? math.avg(r61, r51) : 0, time_x21, i_color_r6, style_r, i_width_r - 2, '', pivot, srLabel, srLabelPos)
f_processPivotLevelX(when and i_show_r and i_midPvt, time_x11, r51 > 0 and r41 > 0 ? math.avg(r51, r41) : 0, time_x21, i_color_r5, style_r, i_width_r - 2, '', pivot, srLabel, srLabelPos)
f_processPivotLevelX(when and i_show_r and i_midPvt, time_x11, r41 > 0 and r31 > 0 ? math.avg(r41, r31) : 0, time_x21, i_color_r4, style_r, i_width_r - 2, '', pivot, srLabel, srLabelPos)
f_processPivotLevelX(when and i_show_r and i_midPvt, time_x11, r31 > 0 and r21 > 0 ? math.avg(r31, r21) : 0, time_x21, i_color_r3, style_r, i_width_r - 2, '', pivot, srLabel, srLabelPos)
f_processPivotLevelX(when and i_show_r and i_midPvt, time_x11, r21 > 0 and r11 > 0 ? math.avg(r21, r11) : 0, time_x21, i_color_r2, style_r, i_width_r - 2, '', pivot, srLabel, srLabelPos)
f_processPivotLevelX(when and i_show_r and i_midPvt, time_x11, r11 > 0 and p1 > 0 ? math.avg(r11, p1 ) : 0, time_x21, i_color_r1, style_r, i_width_r - 2, '', pivot, srLabel, srLabelPos)
//plot(dispHist == 'Selected Pivots' and r61 > 0 ? htf_time or islast ? na : r61 : na, 'Historical R6', color.new(#e91e63, 0), 1, plot.style_linebr, show_last=pll, editable=false)
//plot(dispHist == 'Selected Pivots' and r51 > 0 ? htf_time or islast ? na : r51 : na, 'Historical R5', color.new(#e91e63, 0), 1, plot.style_linebr, show_last=pll, editable=false)
//plot(dispHist == 'Selected Pivots' and r41 > 0 ? htf_time or islast ? na : r41 : na, 'Historical R4', color.new(#e91e63, 0), 1, plot.style_linebr, show_last=pll, editable=false)
//plot(dispHist == 'Selected Pivots' and r31 > 0 ? htf_time or islast ? na : r31 : na, 'Historical R3', color.new(#e91e63, 0), 1, plot.style_linebr, show_last=pll, editable=false)
//plot(dispHist == 'Selected Pivots' and r21 > 0 ? htf_time or islast ? na : r21 : na, 'Historical R2', color.new(#e91e63, 0), 1, plot.style_linebr, show_last=pll, editable=false)
//plot(dispHist == 'Selected Pivots' and r11 > 0 ? htf_time or islast ? na : r11 : na, 'Historical R1', color.new(#e91e63, 0), 1, plot.style_linebr, show_last=pll, editable=false)
spHistDisp = dispHist == 'Selected Pivots' or dispHist == 'Both'
plot(spHistDisp and r61 > 0 ? htf_time or islast ? na : r61 : na, 'Historical R6', i_color_r6, i_width_r, plot.style_linebr, show_last=pll, editable=false)
plot(spHistDisp and r51 > 0 ? htf_time or islast ? na : r51 : na, 'Historical R5', i_color_r5, i_width_r, plot.style_linebr, show_last=pll, editable=false)
plot(spHistDisp and r41 > 0 ? htf_time or islast ? na : r41 : na, 'Historical R4', i_color_r4, i_width_r, plot.style_linebr, show_last=pll, editable=false)
plot(spHistDisp and r31 > 0 ? htf_time or islast ? na : r31 : na, 'Historical R3', i_color_r3, i_width_r, plot.style_linebr, show_last=pll, editable=false)
plot(spHistDisp and r21 > 0 ? htf_time or islast ? na : r21 : na, 'Historical R2', i_color_r2, i_width_r, plot.style_linebr, show_last=pll, editable=false)
plot(spHistDisp and r11 > 0 ? htf_time or islast ? na : r11 : na, 'Historical R1', i_color_r1, i_width_r, plot.style_linebr, show_last=pll, editable=false)
f_processPivotLevelX(when and i_show_p, time_x11, p1, time_x21, i_color_p, style_p, i_width_p, 'P', pivot, srLabel, srLabelPos)
//plot(dispHist == 'Selected Pivots' and i_show_p and p1 > 0 ? htf_time or islast ? na : p1 : na, 'Historical P ', color.new(#0000f0, 0), 1, plot.style_linebr, show_last=pll, editable=false)
plot(spHistDisp and i_show_p and p1 > 0 ? htf_time or islast ? na : p1 : na, 'Historical P ', i_color_p, i_width_p, plot.style_linebr, show_last=pll, editable=false)
f_processPivotLevelX(when and i_show_s and i_midPvt, time_x11, s11 > 0 and p1 > 0 ? math.avg(s11, p1 ) : 0, time_x21, i_color_s1, style_s, i_width_s - 2, '', pivot, srLabel, srLabelPos)
f_processPivotLevelX(when and i_show_s and i_midPvt, time_x11, s21 > 0 and s11 > 0 ? math.avg(s21, s11) : 0, time_x21, i_color_s2, style_s, i_width_s - 2, '', pivot, srLabel, srLabelPos)
f_processPivotLevelX(when and i_show_s and i_midPvt, time_x11, s31 > 0 and s21 > 0 ? math.avg(s31, s21) : 0, time_x21, i_color_s3, style_s, i_width_s - 2, '', pivot, srLabel, srLabelPos)
f_processPivotLevelX(when and i_show_s and i_midPvt, time_x11, s41 > 0 and s31 > 0 ? math.avg(s41, s31) : 0, time_x21, i_color_s4, style_s, i_width_s - 2, '', pivot, srLabel, srLabelPos)
f_processPivotLevelX(when and i_show_s and i_midPvt, time_x11, s51 > 0 and s41 > 0 ? math.avg(s51, s41) : 0, time_x21, i_color_s5, style_s, i_width_s - 2, '', pivot, srLabel, srLabelPos)
f_processPivotLevelX(when and i_show_s and i_midPvt, time_x11, s61 > 0 and s51 > 0 ? math.avg(s61, s51) : 0, time_x21, i_color_s6, style_s, i_width_s - 2, '', pivot, srLabel, srLabelPos)
f_processPivotLevelX(when and i_show_s, time_x11, s11, time_x21, i_color_s1, style_s, i_width_s, 'S1', pivot, srLabel, srLabelPos)
f_processPivotLevelX(when and i_show_s, time_x11, s21, time_x21, i_color_s2, style_s, i_width_s, 'S2', pivot, srLabel, srLabelPos)
f_processPivotLevelX(when and i_show_s, time_x11, s31, time_x21, i_color_s3, style_s, i_width_s, 'S3', pivot, srLabel, srLabelPos)
f_processPivotLevelX(when and i_show_s, time_x11, s41, time_x21, i_color_s4, style_s, i_width_s, 'S4', pivot, srLabel, srLabelPos)
f_processPivotLevelX(when and i_show_s, time_x11, s51, time_x21, i_color_s5, style_s, i_width_s, 'S5', pivot, srLabel, srLabelPos)
f_processPivotLevelX(when and i_show_s, time_x11, s61, time_x21, i_color_s6, style_s, i_width_s, 'S6', pivot, srLabel, srLabelPos)
//plot(dispHist == 'Selected Pivots' and s11 > 0 ? htf_time or islast ? na : s11 : na, 'Historical S1', color.new(#26a69a, 0), 1, plot.style_linebr, show_last=pll, editable=false)
//plot(dispHist == 'Selected Pivots' and s21 > 0 ? htf_time or islast ? na : s21 : na, 'Historical S2', color.new(#26a69a, 0), 1, plot.style_linebr, show_last=pll, editable=false)
//plot(dispHist == 'Selected Pivots' and s31 > 0 ? htf_time or islast ? na : s31 : na, 'Historical S3', color.new(#26a69a, 0), 1, plot.style_linebr, show_last=pll, editable=false)
//plot(dispHist == 'Selected Pivots' and s41 > 0 ? htf_time or islast ? na : s41 : na, 'Historical S4', color.new(#26a69a, 0), 1, plot.style_linebr, show_last=pll, editable=false)
//plot(dispHist == 'Selected Pivots' and s51 > 0 ? htf_time or islast ? na : s51 : na, 'Historical S5', color.new(#26a69a, 0), 1, plot.style_linebr, show_last=pll, editable=false)
//plot(dispHist == 'Selected Pivots' and s61 > 0 ? htf_time or islast ? na : s61 : na, 'Historical S6', color.new(#26a69a, 0), 1, plot.style_linebr, show_last=pll, editable=false)
plot(spHistDisp and s11 > 0 ? htf_time or islast ? na : s11 : na, 'Historical S1', i_color_s1, i_width_s, plot.style_linebr, show_last=pll, editable=false)
plot(spHistDisp and s21 > 0 ? htf_time or islast ? na : s21 : na, 'Historical S2', i_color_s2, i_width_s, plot.style_linebr, show_last=pll, editable=false)
plot(spHistDisp and s31 > 0 ? htf_time or islast ? na : s31 : na, 'Historical S3', i_color_s3, i_width_s, plot.style_linebr, show_last=pll, editable=false)
plot(spHistDisp and s41 > 0 ? htf_time or islast ? na : s41 : na, 'Historical S4', i_color_s4, i_width_s, plot.style_linebr, show_last=pll, editable=false)
plot(spHistDisp and s51 > 0 ? htf_time or islast ? na : s51 : na, 'Historical S5', i_color_s5, i_width_s, plot.style_linebr, show_last=pll, editable=false)
plot(spHistDisp and s61 > 0 ? htf_time or islast ? na : s61 : na, 'Historical S6', i_color_s6, i_width_s, plot.style_linebr, show_last=pll, editable=false)
when := barstate.islast and dispWM == 'Weekly' or dispWM == 'Both'
f_processPivotLevelX(when and i_show_r, time_x1w, r6w, time_x21, i_color_r6, style_r, i_width_r, 'R6W', pivot, srLabel, srLabelPos)
f_processPivotLevelX(when and i_show_r, time_x1w, r5w, time_x21, i_color_r5, style_r, i_width_r, 'R5W', pivot, srLabel, srLabelPos)
f_processPivotLevelX(when and i_show_r, time_x1w, r4w, time_x21, i_color_r4, style_r, i_width_r, 'R4W', pivot, srLabel, srLabelPos)
f_processPivotLevelX(when and i_show_r, time_x1w, r3w, time_x21, i_color_r3, style_r, i_width_r, 'R3W', pivot, srLabel, srLabelPos)
f_processPivotLevelX(when and i_show_r, time_x1w, r2w, time_x21, i_color_r2, style_r, i_width_r, 'R2W', pivot, srLabel, srLabelPos)
f_processPivotLevelX(when and i_show_r, time_x1w, r1w, time_x21, i_color_r1, style_r, i_width_r, 'R1W', pivot, srLabel, srLabelPos)
f_processPivotLevelX(when and i_show_p, time_x1w, pw, time_x21, i_color_p, style_p, i_width_p, 'PW ', pivot, srLabel, srLabelPos)
f_processPivotLevelX(when and i_show_s, time_x1w, s1w, time_x21, i_color_s1, style_s, i_width_s, 'S1W', pivot, srLabel, srLabelPos)
f_processPivotLevelX(when and i_show_s, time_x1w, s2w, time_x21, i_color_s2, style_s, i_width_s, 'S2W', pivot, srLabel, srLabelPos)
f_processPivotLevelX(when and i_show_s, time_x1w, s3w, time_x21, i_color_s3, style_s, i_width_s, 'S3W', pivot, srLabel, srLabelPos)
f_processPivotLevelX(when and i_show_s, time_x1w, s4w, time_x21, i_color_s4, style_s, i_width_s, 'S4W', pivot, srLabel, srLabelPos)
f_processPivotLevelX(when and i_show_s, time_x1w, s5w, time_x21, i_color_s5, style_s, i_width_s, 'S5W', pivot, srLabel, srLabelPos)
f_processPivotLevelX(when and i_show_s, time_x1w, s6w, time_x21, i_color_s6, style_s, i_width_s, 'S6W', pivot, srLabel, srLabelPos)
when := barstate.islast and dispWM == 'Monthly' or dispWM == 'Both'
f_processPivotLevelX(when and i_show_r, time_x1m, r6m, time_x21, i_color_r6, style_r, i_width_r, 'R6M', pivot, srLabel, srLabelPos)
f_processPivotLevelX(when and i_show_r, time_x1m, r5m, time_x21, i_color_r5, style_r, i_width_r, 'R5M', pivot, srLabel, srLabelPos)
f_processPivotLevelX(when and i_show_r, time_x1m, r4m, time_x21, i_color_r4, style_r, i_width_r, 'R4M', pivot, srLabel, srLabelPos)
f_processPivotLevelX(when and i_show_r, time_x1m, r3m, time_x21, i_color_r3, style_r, i_width_r, 'R3M', pivot, srLabel, srLabelPos)
f_processPivotLevelX(when and i_show_r, time_x1m, r2m, time_x21, i_color_r2, style_r, i_width_r, 'R2M', pivot, srLabel, srLabelPos)
f_processPivotLevelX(when and i_show_r, time_x1m, r1m, time_x21, i_color_r1, style_r, i_width_r, 'R1M', pivot, srLabel, srLabelPos)
f_processPivotLevelX(when and i_show_p, time_x1m, pm, time_x21, i_color_p, style_p, i_width_p, 'PM ', pivot, srLabel, srLabelPos)
f_processPivotLevelX(when and i_show_s, time_x1m, s1m, time_x21, i_color_s1, style_s, i_width_s, 'S1M', pivot, srLabel, srLabelPos)
f_processPivotLevelX(when and i_show_s, time_x1m, s2m, time_x21, i_color_s2, style_s, i_width_s, 'S2M', pivot, srLabel, srLabelPos)
f_processPivotLevelX(when and i_show_s, time_x1m, s3m, time_x21, i_color_s3, style_s, i_width_s, 'S3M', pivot, srLabel, srLabelPos)
f_processPivotLevelX(when and i_show_s, time_x1m, s4m, time_x21, i_color_s4, style_s, i_width_s, 'S4M', pivot, srLabel, srLabelPos)
f_processPivotLevelX(when and i_show_s, time_x1m, s5m, time_x21, i_color_s5, style_s, i_width_s, 'S5M', pivot, srLabel, srLabelPos)
f_processPivotLevelX(when and i_show_s, time_x1m, s6m, time_x21, i_color_s6, style_s, i_width_s, 'S6M', pivot, srLabel, srLabelPos)
when := barstate.islast and dispCPR
style_cpr = f_getStyle(i_style_cpr)
f_processPivotLevelX(when, time_x11, tc1 , time_x21, i_color_tc , style_cpr, i_width_cpr, 'TC' , '', srLabel, srLabelPos)
f_processPivotLevelX(when, time_x11, cpr1, time_x21, i_color_cpr, style_cpr, i_width_cpr, 'CPR', '', srLabel, srLabelPos)
f_processPivotLevelX(when, time_x11, bc1 , time_x21, i_color_bc , style_cpr, i_width_cpr, 'BC' , '', srLabel, srLabelPos)
when := barstate.islast and dispCPR and i_dispPVT and time_x21 - timenow < 3600000 * i_when
f_processPivotLevelX(when, time_x1, tc , time_x2, i_color_tc , style_cpr, i_width_cpr, '', '', srLabel, srLabelPos)
f_processPivotLevelX(when, time_x1, cpr, time_x2, i_color_cpr, style_cpr, i_width_cpr, '', '', srLabel, srLabelPos)
f_processPivotLevelX(when, time_x1, bc , time_x2, i_color_bc , style_cpr, i_width_cpr, '', '', srLabel, srLabelPos)
//plot(dispHist == 'Central Pivot Range' and dispCPR ? htf_time or islast ? na : tc1 : na, 'Historical CPR TC', color.new(#9ef2e8, 0), 1, plot.style_cross, show_last=pll, editable=false)
//plot(dispHist == 'Central Pivot Range' and dispCPR ? htf_time or islast ? na : cpr1 : na, 'Historical CPR P ', color.new(#fa8072, 0), 1, plot.style_cross, show_last=pll, editable=false)
//plot(dispHist == 'Central Pivot Range' and dispCPR ? htf_time or islast ? na : bc1 : na, 'Historical CPR BC', color.new(#4262ba, 0), 1, plot.style_cross, show_last=pll, editable=false)
cprHistDisp = dispHist == 'Central Pivot Range' or dispHist == 'Both'
plot(cprHistDisp and dispCPR ? htf_time or islast ? na : tc1 : na, 'Historical CPR TC', i_color_tc , 1, plot.style_cross, show_last=pll, editable=false)
plot(cprHistDisp and dispCPR ? htf_time or islast ? na : cpr1 : na, 'Historical CPR P ', i_color_cpr, 1, plot.style_cross, show_last=pll, editable=false)
plot(cprHistDisp and dispCPR ? htf_time or islast ? na : bc1 : na, 'Historical CPR BC', i_color_bc , 1, plot.style_cross, show_last=pll, editable=false)
if barstate.islast and dispOHLC
ohlcC = htf_o1 > htf_c1 ? color.red : color.green
style_ohlc = f_getStyle(i_style_ohlc)
if i_show_o
f_drawLineX(time_x10, htf_o1, time_x21, htf_o1, xloc.bar_time, extend.none, ohlcC, style_ohlc, 1)
f_drawLabelX(time_x10, htf_o1, 'O', xloc.bar_time, yloc.price, #00000000, label.style_label_right, ohlcC, size.normal, text.align_center, 'PREVIOUS HTF(' + htf + ') OPEN : ' + str.tostring(htf_o1, format.mintick))
if i_show_h
f_drawLineX(time_x10, htf_h1, time_x21, htf_h1, xloc.bar_time, extend.none, ohlcC, style_ohlc, 2)
f_drawLabelX(time_x10, htf_h1, 'H', xloc.bar_time, yloc.price, #00000000, label.style_label_right, ohlcC, size.normal, text.align_center, 'PREVIOUS HTF(' + htf + ') HIGH : ' + str.tostring(htf_h1, format.mintick))
if i_show_l
f_drawLineX(time_x10, htf_l1, time_x21, htf_l1, xloc.bar_time, extend.none, ohlcC, style_ohlc, 2)
f_drawLabelX(time_x10, htf_l1, 'L', xloc.bar_time, yloc.price, #00000000, label.style_label_right, ohlcC, size.normal, text.align_center, 'PREVIOUS HTF(' + htf + ') LOW : ' + str.tostring(htf_l1, format.mintick))
if i_show_c
f_drawLineX(time_x10, htf_c1, time_x21, htf_c1, xloc.bar_time, extend.none, ohlcC, style_ohlc, 1)
f_drawLabelX(time_x10, htf_c1, 'C', xloc.bar_time, yloc.price, #00000000, label.style_label_right, ohlcC, size.normal, text.align_center, 'PREVIOUS HTF(' + htf + ') CLOSE : ' + str.tostring(htf_c1, format.mintick))
if f_crossingLevelX(close, htf_h1) and barstate.islast and dispOHLC
alert('OHLC (PVTvX) : ' + syminfo.ticker + ' crossing previous htf high')
if f_crossingLevelX(close, htf_l1) and barstate.islast and dispOHLC
alert('OHLC (PVTvX) : ' + syminfo.ticker + ' crossing previous htf low')
//------------------------------------------------------------------------------
// ADX Colored Directional Movement Line by DGT
didir = diplus >= diminus ? true : false
plotshape(addons and dispDM and diplus >= diminus, style=shape.triangleup , location=location.top, color=dmiColor, title='DMI Bull', show_last=pll, editable=false)
plotshape(addons and dispDM and diplus < diminus , style=shape.triangledown, location=location.top, color=dmiColor, title='DMI Bear', show_last=pll, editable=false)
//------------------------------------------------------------------------------
// Price Distance to its Moving Average by DGT
plotshape(addons and dispPM and pmar >= 0, style=shape.triangleup , location=location.bottom, color=pmaColor, title="Price/MA Bull", show_last = pll, editable=false)
plotshape(addons and dispPM and pmar < 0, style=shape.triangledown, location=location.bottom, color=pmaColor, title="Price/MA Bear", show_last = pll, editable=false)
//------------------------------------------------------------------------------
// Volume weighted Colored Bars by KIVANÇ ÖZBİLGİÇ
barcolor(addons and nz(volume) and vwcb ? vwcbColor : na, title='Volume Based Colored Bars by [KıvançÖZBİLGİÇ]', show_last=pll, editable=false)
//------------------------------------------------------------------------------
// Ichimoku Cloud - presentation customized by DGT
pi1 = plot(leadLine1, offset=displacement - 1, color=color.new(color.green, 0), title='Lead 1', display=display.none, show_last=displacement - 1, editable=false)
pi2 = plot(leadLine2, offset=displacement - 1, color=color.new(color.red , 0), title='Lead 2', display=display.none, show_last=displacement - 1, editable=false)
fill(pi1, pi2, color=addons and ichimoku ? leadLine1 > leadLine2 ? color.new(color.green, 73) : color.new(color.red, 73) : na, title='Ichimoku Kumo Cloud', show_last=showKumo ? pll + 1 : 1)
//------------------------------------------------------------------------------
// Pivot Points High Low
var label tempHigh = na
var label tempLow = na
if addons and dispPVT
if not na(pvtHigh)
tradedVolume = f_getTradedVolume(profileLength, proceed, pvtLength)
f_drawOnlyLabelX(bar_index[pvtLength], pvtHigh, (pvtPrice ? str.tostring(pvtHigh, format.mintick) : '') + (pvtChange ? (pvtPrice ? ' ↑ %' : '↑ %') + str.tostring((pvtHigh - pvtLow1) * 100 / pvtLow1 , '#.##') : '') + (pvtVolume and nzVolume ? (pvtPrice or pvtChange ? '\n' : '') + str.tostring(tradedVolume, format.volume) : ''), xloc.bar_index, yloc.price, chart.fg_color, label.style_label_down, chart.bg_color, (not pvtPrice and not pvtChange and not pvtVolume ? size.tiny : pvtTextSize), text.align_center, 'Pivot High : ' + str.tostring(pvtHigh, format.mintick) + '\n -Price Change : ↑ %' + str.tostring((pvtHigh - pvtLow1) * 100 / pvtLow1 , '#.##') + (nzVolume ? '\n -Traded Volume : ' + str.tostring(tradedVolume, format.volume) + ' (' + str.tostring(profileLength - 1) + ' bars)\n *Average Volume/Bar : ' + str.tostring(tradedVolume / (profileLength - 1), format.volume) : '') + '\n\nNumber of bars : ' + str.tostring(profileLength) )
pvtHigh1 := pvtHigh
//pvtLast := 'H'
label.delete(tempHigh[1])
if x2 - pvtLength > x2Temp - pvtLengthTemp
label.delete(tempLow[1])
if not na(pvtLow)
tradedVolume = f_getTradedVolume(profileLength, proceed, pvtLength)
f_drawOnlyLabelX(bar_index[pvtLength], pvtLow , (pvtPrice ? str.tostring(pvtLow , format.mintick) : '') + (pvtChange ? (pvtPrice ? ' ↓ %' : '↓ %') + str.tostring((pvtHigh1 - pvtLow) * 100 / pvtHigh1, '#.##') : '') + (pvtVolume and nzVolume ? (pvtPrice or pvtChange ? '\n' : '') + str.tostring(tradedVolume, format.volume) : ''), xloc.bar_index, yloc.price, chart.fg_color, label.style_label_up , chart.bg_color, (not pvtPrice and not pvtChange and not pvtVolume ? size.tiny : pvtTextSize), text.align_center, 'Pivot Low : ' + str.tostring(pvtLow , format.mintick) + '\n -Price Change : ↓ %' + str.tostring((pvtHigh1 - pvtLow) * 100 / pvtHigh1, '#.##') + (nzVolume ? '\n -Traded Volume : ' + str.tostring(tradedVolume, format.volume) + ' (' + str.tostring(profileLength - 1) + ' bars)\n *Average Volume/Bar : ' + str.tostring(tradedVolume / (profileLength - 1), format.volume) : '') + '\n\nNumber of bars : ' + str.tostring(profileLength) )
pvtLow1 := pvtLow
//pvtLast := 'L'
label.delete(tempLow[1])
if x2 - pvtLength > x2Temp - pvtLengthTemp// ???
label.delete(tempHigh[1])
if not na(pvtHighTemp) //and pvtLast == 'L'
if pvtHighTemp > pvtHigh1Temp// or pvtHighTemp > pvtHigh1
label.delete(tempHigh[1])
tradedVolume = f_getTradedVolume(profileLengthTemp, proceedTemp, pvtLengthTemp)
tempHigh := label.new(bar_index[pvtLengthTemp], pvtHighTemp, '* ' + (pvtPrice ? str.tostring(pvtHighTemp, format.mintick) : '') + (pvtChange ? (pvtPrice ? ' ↑ %' : '↑ %') + str.tostring((pvtHighTemp - pvtLow1) * 100 / pvtLow1 , '#.##') : '') + (pvtVolume and nzVolume ? (pvtPrice or pvtChange ? '\n' : '') + str.tostring(tradedVolume, format.volume) : ''), xloc.bar_index, yloc.price, #284aa9, label.style_label_down, color.white, (not pvtPrice and not pvtChange and not pvtVolume ? size.tiny : pvtTextSize), text.align_center, 'Temporary Pivot High : ' + str.tostring(pvtHighTemp, format.mintick) + '\n -Price Change : ↑ %' + str.tostring((pvtHighTemp - pvtLow1) * 100 / pvtLow1 , '#.##') + (nzVolume ? '\n -Traded Volume : ' + str.tostring(tradedVolume, format.volume) + ' (' + str.tostring(profileLengthTemp - 1) + ' bars)\n *Average Volume/Bar : ' + str.tostring(tradedVolume / (profileLengthTemp - 1), format.volume) : '') + '\n\nNumber of bars\n since last confirmed Pivot High/Low : ' + str.tostring(profileLengthTemp) + '\n\nWarning : subject to repaint, not a confirmed Pivot Level or Signal' )
pvtHigh1Temp := pvtHighTemp
if high > pvtHigh1Temp
label.delete(tempHigh[1])
if not na(pvtLowTemp) //and pvtLast == 'H'
if pvtLowTemp < pvtLow1Temp// or pvtLowTemp < pvtLow1
tradedVolume = f_getTradedVolume(profileLengthTemp, proceedTemp, pvtLengthTemp)
label.delete(tempLow[1])
tempLow := label.new(bar_index[pvtLengthTemp], pvtLowTemp, '* ' + (pvtPrice ? str.tostring(pvtLowTemp, format.mintick) : '') + (pvtChange ? (pvtPrice ? ' ↓ %' : '↓ %') + str.tostring((pvtHigh1 - pvtLowTemp) * 100 / pvtLowTemp , '#.##') : '') + (pvtVolume and nzVolume ? (pvtPrice or pvtChange ? '\n' : '') + str.tostring(tradedVolume, format.volume) : ''), xloc.bar_index, yloc.price, #284aa9, label.style_label_up, color.white, (not pvtPrice and not pvtChange and not pvtVolume ? size.tiny : pvtTextSize), text.align_center, 'Temporary Pivot Low : ' + str.tostring(pvtLowTemp, format.mintick) + '\n -Price Change : ↓ %' + str.tostring((pvtHigh1 - pvtLowTemp) * 100 / pvtHigh1 , '#.##') + (nzVolume ? '\n -Traded Volume : ' + str.tostring(tradedVolume, format.volume) + ' (' + str.tostring(profileLengthTemp - 1) + ' bars)\n *Average Volume/Bar : ' + str.tostring(tradedVolume / (profileLengthTemp - 1), format.volume) : '') + '\n\nNumber of bars\n since last confirmed Pivot High/Low : ' + str.tostring(profileLengthTemp) + '\n\nWarning : subject to repaint, not a confirmed Pivot Level or Signal')
pvtLow1Temp := pvtLowTemp
if low < pvtLow1Temp
label.delete(tempLow[1])
//------------------------------------------------------------------------------
// Bolligner Bands - customized presentation
//pu4 = plot(addons and dispBB and islast and not extendBB ? u4 : na, 'BB Upper stDev bbMult4', color.new(color.red , 0), 1)
pu3 = plot(addons and dispBB and islast and not extendBB ? u3 : na, 'BB Upper stDev bbMult3', color.new(color.orange, 0), 1)
pu2 = plot(addons and dispBB and islast and not extendBB ? u2 : na, 'BB Upper stDev bbMult2', color.new(color.aqua , 0), 1)
pu1 = plot(addons and dispBB and islast and not extendBB ? u1 : na, 'BB Upper stDev bbMult1', color.new(color.silver, 0), 1)
pl1 = plot(addons and dispBB and islast and not extendBB ? l1 : na, 'BB Lower stDev bbMult1', color.new(color.silver, 0), 1)
pl2 = plot(addons and dispBB and islast and not extendBB ? l2 : na, 'BB Lower stDev bbMult2', color.new(color.aqua , 0), 1)
pl3 = plot(addons and dispBB and islast and not extendBB ? l3 : na, 'BB Lower stDev bbMult3', color.new(color.orange, 0), 1)
//pl4 = plot(addons and dispBB and islast and not extendBB ? l4 : na, 'BB Lower stDev bbMult4', color.new(color.red , 0), 1)
//fill(pl3, pl4, color=bgShow ? color.new(#006400 , 73) : na, title='BB Bands Fill (Lower 3-4)')
//fill(pl2, pl3, color=bgShow ? color.new(color.green, 73) : na, title='BB Bands Fill (Lower 2-3)')
//fill(pl1, pl2, color=bgShow ? color.new(#9ef2e8 , 73) : na, title='BB Bands Fill (Lower 1-2)')
//fill(pu1, pu2, color=bgShow ? color.new(#fa8072 , 73) : na, title='BB Bands Fill (Upper 1-2)')
//fill(pu2, pu3, color=bgShow ? color.new(color.red , 73) : na, title='BB Bands Fill (Upper 2-3)')
//fill(pu3, pu4, color=bgShow ? color.new(#910000 , 73) : na, title='BB Bands Fill (Upper 3-4)')
//pu4e = plot(addons and dispBB and extendBB ? u4 : na, 'BB Upper stDev bbMult4 (extended)', color.new(color.red , 0), 1, show_last=pll)
pu3e = plot(addons and dispBB and extendBB ? u3 : na, 'BB Upper stDev bbMult3 (extended)', color.new(color.orange, 0), 1, show_last=pll)
pu2e = plot(addons and dispBB and extendBB ? u2 : na, 'BB Upper stDev bbMult2 (extended)', color.new(color.aqua , 0), 1, show_last=pll)
pu1e = plot(addons and dispBB and extendBB ? u1 : na, 'BB Upper stDev bbMult1 (extended)', color.new(color.silver, 0), 1, show_last=pll)
pl1e = plot(addons and dispBB and extendBB ? l1 : na, 'BB Lower stDev bbMult1 (extended)', color.new(color.silver, 0), 1, show_last=pll)
pl2e = plot(addons and dispBB and extendBB ? l2 : na, 'BB Lower stDev bbMult2 (extended)', color.new(color.aqua , 0), 1, show_last=pll)
pl3e = plot(addons and dispBB and extendBB ? l3 : na, 'BB Lower stDev bbMult3 (extended)', color.new(color.orange, 0), 1, show_last=pll)
//pl4e = plot(addons and dispBB and extendBB ? l4 : na, 'BB Lower stDev bbMult4 (extended)', color.new(color.red , 0), 1, show_last=pll)
//fill(pl3e, pl4e, color=bgShow ? color.new(#006400 , 73) : na, title='BB Bands Fill (Lower 3-4) (extended)')
//fill(pl2e, pl3e, color=bgShow ? color.new(color.green, 73) : na, title='BB Bands Fill (Lower 2-3) (extended)')
//fill(pl1e, pl2e, color=bgShow ? color.new(#9ef2e8 , 73) : na, title='BB Bands Fill (Lower 1-2) (extended)')
//fill(pu1e, pu2e, color=bgShow ? color.new(#fa8072 , 73) : na, title='BB Bands Fill (Upper 1-2) (extended)')
//fill(pu2e, pu3e, color=bgShow ? color.new(color.red , 73) : na, title='BB Bands Fill (Upper 2-3) (extended)')
//fill(pu3e, pu4e, color=bgShow ? color.new(#910000 , 73) : na, title='BB Bands Fill (Upper 3-4) (extended)')
//if f_crossingLevelX(close, u4)
// alert('BB (PVTvX) : ' + syminfo.ticker + ' crossing bollinger bands upper standart deviation line ' + str.tostring(bbMult4))
if f_crossingLevelX(close, u3)
alert('BB (PVTvX) : ' + syminfo.ticker + ' crossing bollinger bands upper standart deviation line ' + str.tostring(bbMult3))
if f_crossingLevelX(close, u2)
alert('BB (PVTvX) : ' + syminfo.ticker + ' crossing bollinger bands upper standart deviation line ' + str.tostring(bbMult2))
if f_crossingLevelX(close, l2)
alert('BB (PVTvX) : ' + syminfo.ticker + ' crossing bollinger bands lower standart deviation line ' + str.tostring(bbMult2))
if f_crossingLevelX(close, l3)
alert('BB (PVTvX) : ' + syminfo.ticker + ' crossing bollinger bands lower standart deviation line ' + str.tostring(bbMult3))
//if f_crossingLevelX(close, l4)
// alert('BB (PVTvX) : ' + syminfo.ticker + ' crossing bollinger bands lower standart deviation line ' + str.tostring(bbMult4))
//------------------------------------------------------------------------------
// Volume Weighted Average Price (VWAP) - Build-In
plot(addons and vwapPlot ? vwapValue : na, 'VWAP', color.blue, 2, offset=offset, show_last=pll)
upperBand = plot(addons and vwapPlot ? upperBandValue : na, title='VWAP Upper Band', color=color.new(color.green, 0), display=display.none, offset=offset, show_last=pll)
lowerBand = plot(addons and vwapPlot ? lowerBandValue : na, title='VWAP Lower Band', color=color.new(color.green, 0), display=display.none, offset=offset, show_last=pll)
fill(upperBand, lowerBand, title='VWAP Bands Fill', color=showBands ? color.new(color.blue, 73) : na, show_last=pll)
//------------------------------------------------------------------------------
// Logistic EMA (LEMA) by DGT
plot(addons and dispLEMA ? lema : na, 'LEMA Trend ', trend != trend[1] ? hlColor[1] : hlColor, 4, show_last=pll)
plot(addons and dispLEMA ? lema : na, 'Logistic EMA (LEMA)', maColor, 2, show_last=pll)
if f_crossingLevelX(close, lema)
alert('LEMA (PVTvX) : ' + syminfo.ticker + ' crossing Logistic EMA (LEMA)')
//------------------------------------------------------------------------------
// Statistical Panel
textSize = i_textSize == 'Small' ? size.small : i_textSize == 'Normal' ? size.normal : i_textSize == 'Large' ? size.large : size.tiny
statPosition = switch statPos
'Top Left' => position.top_left
'Top Center' => position.top_center
'Top Right' => position.top_right
'Middle Right' => position.middle_right
'Bottom Left' => position.bottom_left
'Bottom Center' => position.bottom_center
rsiValue = ta.rsi(rsiSrc, rsiLength)
stochK = ta.sma(ta.stoch(close, high, low, stochLengthK), stochSmoothingK)
stochD = ta.sma(stochK, stochLengthD)
[macdLine, signalLine, histLine] = ta.macd(macdSrc, macdFastLength, macdSlowLength, macdSignalLength)
var table change = table.new(statPosition, 3, 7, border_width=3)
if barstate.islast and addons and isLabel
table.cell(change, 0, 0, 'Market Status' , text_color=color.white, bgcolor=color.new(#4262ba, 23), text_halign=text.align_center, text_size=textSize, tooltip = syminfo.description )
table.merge_cells(change, 0, 0, 2, 0)
// Directional Movement
diStat = diplus >= diminus ? '\ndiplus(' + str.tostring(diplus, '#.##') + ') >= diminus(' + str.tostring(diminus, '#.##') + ')' : '\ndiplus(' + str.tostring(diplus, '#.##') + ') < diminus(' + str.tostring(diminus, '#.##') + ')'
adxMom = adxValue > adxValue[1] ? ' and rising' : ' and falling'
[dmiText, dmiColor1] = if dmiBull
['bullish', color.green]
else if dmiBear
['bearish', color.red]
else
['trendless', color.black]
table.cell(change, 0, 1, 'DMI', text_color=color.white, bgcolor=color.new(#4262ba, 23), text_halign=text.align_center, text_size=textSize, tooltip = 'Directional Movement Index')
table.cell(change, 0, 2, dmiText, text_color=color.white, bgcolor=color.new(dmiColor1, 23), text_halign=text.align_center, text_size=textSize, tooltip = 'adx(' + str.tostring(adxValue, '#.##') + ')' + adxMom + diStat)
// Ichimoku Cloud
tkStat = conversionLine >= baseLine ? '\ntenkan-sen(' + str.tostring(conversionLine, format.mintick) + ') >= kijun-sen(' + str.tostring(baseLine, format.mintick) + ')' : '\ntenkan-sen(' + str.tostring(conversionLine, format.mintick) + ') < kijun-sen(' + str.tostring(baseLine, format.mintick) + ')'
ichiTxt = aboveCloud ? 'bullish' : belowCloud ? 'bearish' : inCloud ? 'trendless or \ntransitioning' : na
ichiTxt1 = aboveCloud ? 'price action above the kumo cloud' : belowCloud ? 'price action below the kumo cloud' : inCloud ? 'price action within the kumo cloud' : na
ichiColor1 = aboveCloud ? color.green : belowCloud ? color.red : inCloud ? color.black : na
table.cell(change, 1, 1, 'ICHI', text_color=color.white, bgcolor=color.new(#4262ba, 23), text_halign=text.align_center, text_size=textSize, tooltip = 'Ichimoku Cloud ')
table.cell(change, 1, 2, ichiTxt, text_color=color.white, bgcolor=color.new(ichiColor1, 23), text_halign=text.align_center, text_size=textSize, tooltip = ichiTxt1 + tkStat)
table.cell(change, 2, 1, 'PMA', text_color=color.white, bgcolor=color.new(#4262ba, 23), text_halign=text.align_center, text_size=textSize, tooltip = 'Price Distance to its MA')
table.cell(change, 2, 2, pmaText, text_color=color.white, bgcolor=color.new(pmaColor, 23), text_halign=text.align_center, text_size=textSize, tooltip = pmaText1)
// RSI
[rsiColor, rsiText, rsiTip] = if rsiValue >= 50
if rsiValue > rsiOverbought
[color.green, 'bullish\noverbought', 'over overbought zone']
else if rsiValue > 60 and rsiValue < rsiOverbought
[color.green, 'bullish', 'in bullish zone (rsi > 60)']
else
[color.black, 'neutral', 'in bullish zone (60 > rsi > 50)']
else
if rsiValue < rsiOversold
[color.red, 'bearish\noversold', 'below oversold zone']
else if rsiValue < 40 and rsiValue > rsiOversold
[color.red , 'bearish', 'in bearish zone (rsi < 40)']
else
[color.black, 'neutral', 'in bearish zone (50 > rsi > 40)']
rsiTip := rsiValue > rsiValue[1] ? rsiTip + '\nrsi(' + str.tostring(rsiValue, '#.##') + ') and rising' : rsiTip + '\nrsi(' + str.tostring(rsiValue, '#.##') + ') and falling'
table.cell(change, 0, 3, 'RSI', text_color=color.white, bgcolor=color.new(#4262ba, 23), text_halign=text.align_center, text_size=textSize, tooltip = 'Relative Strength Index')
table.cell(change, 0, 4, rsiText, text_color=color.white, bgcolor=color.new(rsiColor, 23), text_halign=text.align_center, text_size=textSize, tooltip = rsiTip)
// Stochastic
stochMom = stochK > stochK[1] ? ', stochK rising' : ', stochK falling'
stochStat = stochK > stochOverbought ? '\noverbought' : stochK < stochOversold ? '\noversold' : ''
[stochColor, stochText, stochTip] = if stochK > stochD
[color.green, 'bullish', '%k(' + str.tostring(stochK, '#.##') + ') > %d(' + str.tostring(stochD, '#.##') + ')' + stochMom]
else
[color.red, 'bearish', '%k(' + str.tostring(stochK, '#.##') + ') < %d(' + str.tostring(stochD, '#.##') + ')' + stochMom]
table.cell(change, 1, 3, 'STOCH', text_color=color.white, bgcolor=color.new(#4262ba, 23), text_halign=text.align_center, text_size=textSize, tooltip = 'Stochastic')
table.cell(change, 1, 4, stochText + stochStat, text_color=color.white, bgcolor=color.new(stochColor, 23), text_halign=text.align_center, text_size=textSize, tooltip = stochTip)
// MACD
macdMom = histLine > histLine[1] ? '\nmomentum rising' : '\nmomentum falling'
[macdColor, macdText, macdTip] = if macdLine > signalLine
[color.green, 'bullish', 'macd > signal' + macdMom]
else
[color.red, 'bearish', 'macd > signal' + macdMom]
table.cell(change, 2, 3, 'MACD', text_color=color.white, bgcolor=color.new(#4262ba, 23), text_halign=text.align_center, text_size=textSize, tooltip = 'Moving Average Convergence/Divergence')
table.cell(change, 2, 4, macdText, text_color=color.white, bgcolor=color.new(macdColor, 23), text_halign=text.align_center, text_size=textSize, tooltip = macdTip)
// Fear & Greed
fgTxt = feargreed > 73 ? 'extreame\ngreed' : feargreed > 33 ? 'greed' : feargreed < -25 ? 'fear' : feargreed < -41 ? 'extreame\nfear' : 'neutral'
fgColor = feargreed > 33 ? color.green : feargreed < -25 ? color.red : color.black
fgTip = 'Fear and Greed Index ' + str.tostring(feargreed, '#.##') + '%' + '\n\nReference Sources : ' + '\n-----------------------------------------------' +
'\n 1 - Price Convergence/Divergence, Length (' + str.tostring(slowLength) + ') : ' + str.tostring(pmacd, '#.##') + '%' +
'\n 2 - Rate of Return, Length (' + str.tostring(slowLength) + ') : ' + str.tostring(ror, '#.##') + '%' +
'\n 3 - Chaikin Money Flow, Length (' + str.tostring(fastLength) + ') : ' + str.tostring(moneyFlow, '#.##') + '% \n ps: CMF calculated only if volume data is provided' +
'\n 4 - VIX - Volatility (Fear) Index, Length (' + str.tostring(slowLength) + ') : ' + str.tostring(vix, '#.##') + '%' +
'\n 5 - Safe Haven (Gold) Demand, Length (' + str.tostring(fastLength) + ') : ' + str.tostring(gold, '#.##') + '%' +
'\n\nWarren Buffett’s quote, buy when others are fearful, and sell when others are greedy'
table.cell(change, 0, 5, 'F & G', text_color=color.white, bgcolor=color.new(#4262ba, 23), text_halign=text.align_center, text_size=textSize, tooltip = 'Fear and Greed Index')
table.cell(change, 0, 6, fgTxt, text_color=color.white, bgcolor=color.new(fgColor, 23), text_halign=text.align_center, text_size=textSize, tooltip = fgTip)
// Volume
if nzVolume
volTip = 'last volume : ' + str.tostring(nzVolume, format.volume) + '\naverage volume : ' + str.tostring(volMA, format.volume)
volColor = nzVolume > 1.618 * volMA ? color.green : nzVolume < .618 * volMA ? color.red : color.black
table.cell(change, 1, 5, 'VOLUME', text_color=color.white, bgcolor=color.new(volColor, 23), text_halign=text.align_center, text_size=textSize, tooltip = volTip)
table.merge_cells(change, 1, 5, 2, 5)
volColor1 = B > S ? color.green : color.red
table.cell(change, 1, 6, 'bull %' + str.tostring(B / (B + S) * 100, '#.##'), text_color=color.white, bgcolor=color.new(volColor1, 23), text_halign=text.align_center, text_size=textSize, tooltip = 'buying volume')
table.cell(change, 2, 6, 'bear %' + str.tostring(S / (B + S) * 100, '#.##'), text_color=color.white, bgcolor=color.new(volColor1, 23), text_halign=text.align_center, text_size=textSize, tooltip = 'selling volume')
//------------------------------------------------------------------------------
// Market Sentiment Meter
if addons and isMeter and pivot != '🔕 None'
priceChangeRate = math.abs((startPrice - endPrice) / startPrice)
l = 13
a = ta.atr(10) / 5
f = (math.max(startPrice, endPrice) + upDev) * (1 + priceChangeRate * msmVOffset) //highest(3 * l) + 5 * a // math.max(r61, r51, r41, r31, r21, r11)//
t = bar_index//time
var lns = array.new_line()
var c = array.new_color(na)
if barstate.isfirst
array.push(c, color.gray)
array.push(c, color.red)
array.push(c, #910000)
array.push(c, color.gray)
array.push(c, color.green)
array.push(c, #006400)
if ta.change(time) and array.size(lns) > 0
for i = 1 to array.size(lns) by 1
lns1 = array.shift(lns)
line.delete(lns1)
if barstate.islast
for i = 0 to l - 1 by 1
array.push(lns, line.new(t[l + i] + msmHOffset, f + a * math.sqrt(math.pow(l, 2) - math.pow(i, 2)), t[l + i + 1] + msmHOffset, f + a * math.sqrt(math.pow(l, 2) - math.pow(i + 1, 2)), xloc.bar_index, extend.none, array.get(c, math.round((i - 2) / 5)), line.style_solid, 5))
for i = 1 to array.size(lns) - 1 by 1
array.push(lns, line.new(t[i + 1] + msmHOffset, f + a * math.sqrt(math.pow(l, 2) - math.pow(l - i, 2)), t[i] + msmHOffset, f + a * math.sqrt(math.pow(l, 2) - math.pow(l - i + 1, 2)), xloc.bar_index, extend.none, array.get(c, math.round(3 + (l - i - 2) / 5)), line.style_solid, 5))
[t1, t2, p2, nc] = if close < bc1
min = s51 != 0 ? s51 : s31 != 0 ? s31 : s21 != 0 ? s21 : s11
min2 = s11 != 0 ? s11 : s31
if close < min and min != 0
[0, 11, -10, #910000]
else if close < min2 and min2 != 0
[0, 6, -4, color.red]
else
[0, 2, -2, color.gray]
else if close > tc1
max2 = r11 != 0 ? r11 : r31
if close > math.max(r51, r31, r21, r11) and math.max(r51, r31, r21, r11) != 0
[1, -10, -10, #006400]
else if close > max2 and max2 != 0
[1, -6, -4, color.green]
else
[1, -2, -2, color.gray]
else
[0, 0, -2, color.gray]
array.push(lns, line.new(t[l + t1] + msmHOffset, f + a, t[l + t2] + msmHOffset, f + a * (l + p2), xloc.bar_index, extend.none, nc, line.style_solid, 3))
array.push(lns, line.new(t[l + t1] + msmHOffset, f + a, t[l + t2] + msmHOffset, f + a * (l + p2), xloc.bar_index, extend.none, nc, line.style_arrow_right, 1))
//------------------------------------------------------------------------------
// Price Range Meter / ATR Range Display
f_atr(_length) =>
ta.atr(_length)
atr = request.security(syminfo.tickerid, htf, f_atr(atrLength))
if addons and isRange
l = 50
a = ta.atr(10) / 5
t = time
tco = math.round(ta.change(t))
priceChangeRate = math.abs((startPrice - endPrice) / startPrice)
f = (math.min(startPrice, endPrice) - dnDev) * (1 + priceChangeRate * prmVOffset) //timeframe.isweekly or timeframe.ismonthly ? lowest(l) : lowest(3 * l) - 5 * a
//------------------------------------------------------------------------------
highVolatility = htf_h - htf_l > atr * 1.618
atrValue = ta.atr(atrLength)
highVolatility0 = high - low > atrValue * 1.618
if barstate.islast
oo = math.round(l * (htf_h - htf_o) / (htf_h - htf_l))
co = math.round(l * (htf_h - close) / (htf_h - htf_l))
f_drawLineX(t - l * tco + prmHOffset, f - a, t + prmHOffset, f - a, xloc.bar_time, extend.none, color.gray, line.style_solid, 7)
f_drawLineX(t - oo * tco + prmHOffset, f - a, t - co * tco + prmHOffset, f - a, xloc.bar_time, extend.none, htf_o < close ? #006400 : #910000, line.style_solid, 7)
f_drawLabelX(t - l * tco + prmHOffset, f - a, str.tostring(htf_l, format.mintick), xloc.bar_time, yloc.price, #00000000, label.style_label_right, color.blue, size.normal, text.align_center, 'HTF LOW')
f_drawLabelX(t + prmHOffset, f - a, str.tostring(htf_h, format.mintick), xloc.bar_time, yloc.price, #00000000, label.style_label_left, color.blue, size.normal, text.align_center, 'HTF HIGH')
tooltip = (highVolatility0 ? '⚡' : '') + 'Current TF (' + timeframe.period + ')\nATR(' + str.tostring(atrLength) + ') Value : ' + str.tostring(atrValue, format.mintick) + '\nPrice Range (H-L) : ' + str.tostring(high - low, format.mintick) + '\n' +
str.tostring(atrRange) + ' x ATR Bands : ' + str.tostring(open - atrRange * atrValue, format.mintick) + ' / ' + str.tostring(open + atrRange * atrValue, format.mintick) +
'\n\nHigher TF (' + htf + ')\nATR(' + str.tostring(atrLength) + ') Value : ' + str.tostring(atr, format.mintick) + '\nPrice Range (H-L) : ' + str.tostring(htf_h - htf_l, format.mintick) + '\n' + str.tostring(atrRange) + ' x ATR Bands : ' + str.tostring(htf_o - atrRange * atr, format.mintick) + ' / ' + str.tostring(htf_o + atrRange * atr, format.mintick)
text_2 = (highVolatility0 ? '⚡' : '') + (highVolatility ? '⚡' : '') + 'CHANGE (' + htf + ') ' + str.tostring(htf_c - htf_o) + ' (' + str.tostring((htf_c / htf_c1 - 1) * 100, '#.##') + '%)'
f_drawLabelX(t - math.round(l / 2) * tco + prmHOffset, f - a, text_2, xloc.bar_time, yloc.price, #00000000, label.style_label_down, color.blue, size.normal, text.align_center, tooltip)
f_drawLabelX(t - co * tco + prmHOffset, f - a, '', xloc.bar_time, yloc.price, htf_o < close ? #006400 : #910000, label.style_label_up, color.blue, size.tiny, text.align_center, 'CURRENT PRICE(' + str.tostring(close, format.mintick) + ')')
if not timeframe.ismonthly
oo1 = math.round(l * (htf_h1 - htf_o1) / (htf_h1 - htf_l1))
co1 = math.round(l * (htf_h1 - htf_c1) / (htf_h1 - htf_l1))
f_drawLineX(t - l * tco + prmHOffset, f - 7 * a, t + prmHOffset, f - 7 * a, xloc.bar_time, extend.none, color.gray, line.style_solid, 5)
f_drawLineX(t - oo1 * tco + prmHOffset, f - 7 * a, t - co1 * tco + prmHOffset, f - 7 * a, xloc.bar_time, extend.none, htf_o1 < htf_c1 ? #006400 : #910000, line.style_solid, 5)
f_drawLabelX(t - l * tco + prmHOffset, f - 7 * a, str.tostring(htf_l1, format.mintick), xloc.bar_time, yloc.price, #00000000, label.style_label_right, color.blue, size.normal, text.align_center, 'PREVIOUS HTF LOW')
f_drawLabelX(t + prmHOffset, f - 7 * a, str.tostring(htf_h1, format.mintick), xloc.bar_time, yloc.price, #00000000, label.style_label_left, color.blue, size.normal, text.align_center, 'PREVIOUS HTF HIGH')
f_drawLabelX(t - math.round(l / 2) * tco + prmHOffset, f - 7 * a, 'PREVIOUS HTF\'s RANGE (' + htf + ')', xloc.bar_time, yloc.price, #00000000, label.style_label_up, color.blue, size.normal, text.align_center, 'PREVIOUS HTF RANGE (H-L) : ' + str.tostring(htf_h1 - htf_l1, format.mintick))
var table logo = table.new(position.bottom_right, 1, 1)
if barstate.islast
table.cell(logo, 0, 0, '☼☾ ', text_size=size.normal, text_color=color.teal)How to Apply Pine Script in TradingView:
- Open TradingView and log in.
- Navigate to the Pine Script Editor at the bottom of the screen.
- Copy the provided Pine Script code.
- Paste it into the editor and click Save.
- Name the script, e.g., “Pivot Points with CPR by KrisWaters.”
- Click Add to Chart to apply the script.
- Customize settings via the indicator panel to match your trading preferences.
Final Verdict:
The Pivot Points with CPR Integration script is a versatile tool for traders seeking to incorporate pivot-based strategies into their analysis. Its broad range of features and non-repainting nature make it a dependable choice for technical analysis across multiple timeframes. While its complexity might challenge beginners, experienced users will find significant value in its depth and flexibility.
RELATED POSTS
View all
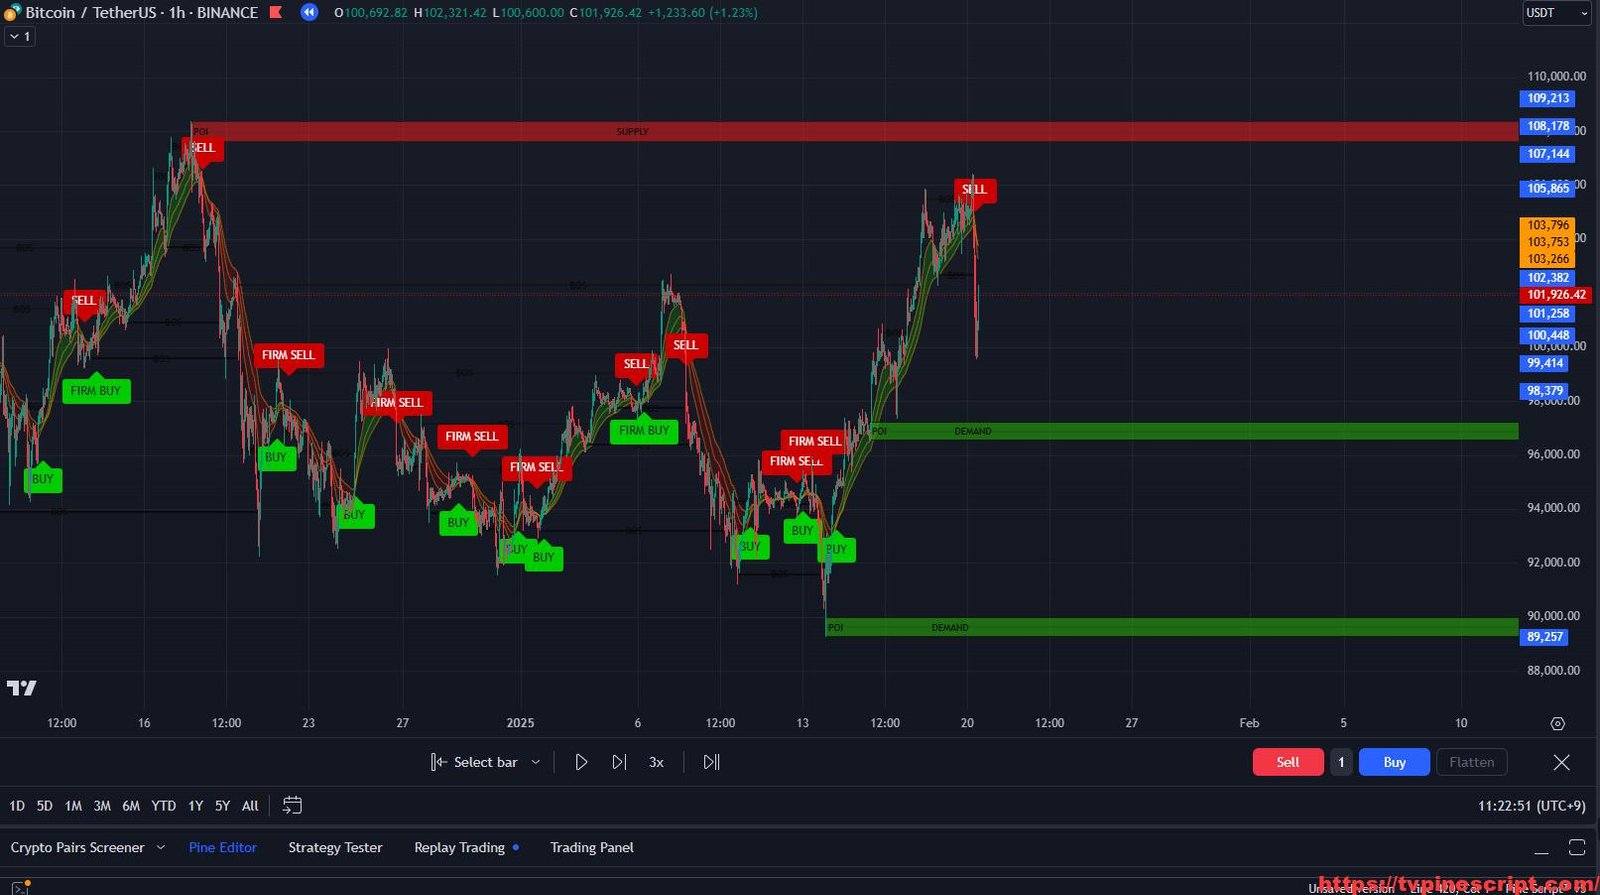
TradeWortex Indicator: A Multi-Faceted Trading Tool for Trend and Volatility Analysis
January 21, 2025 | by admin
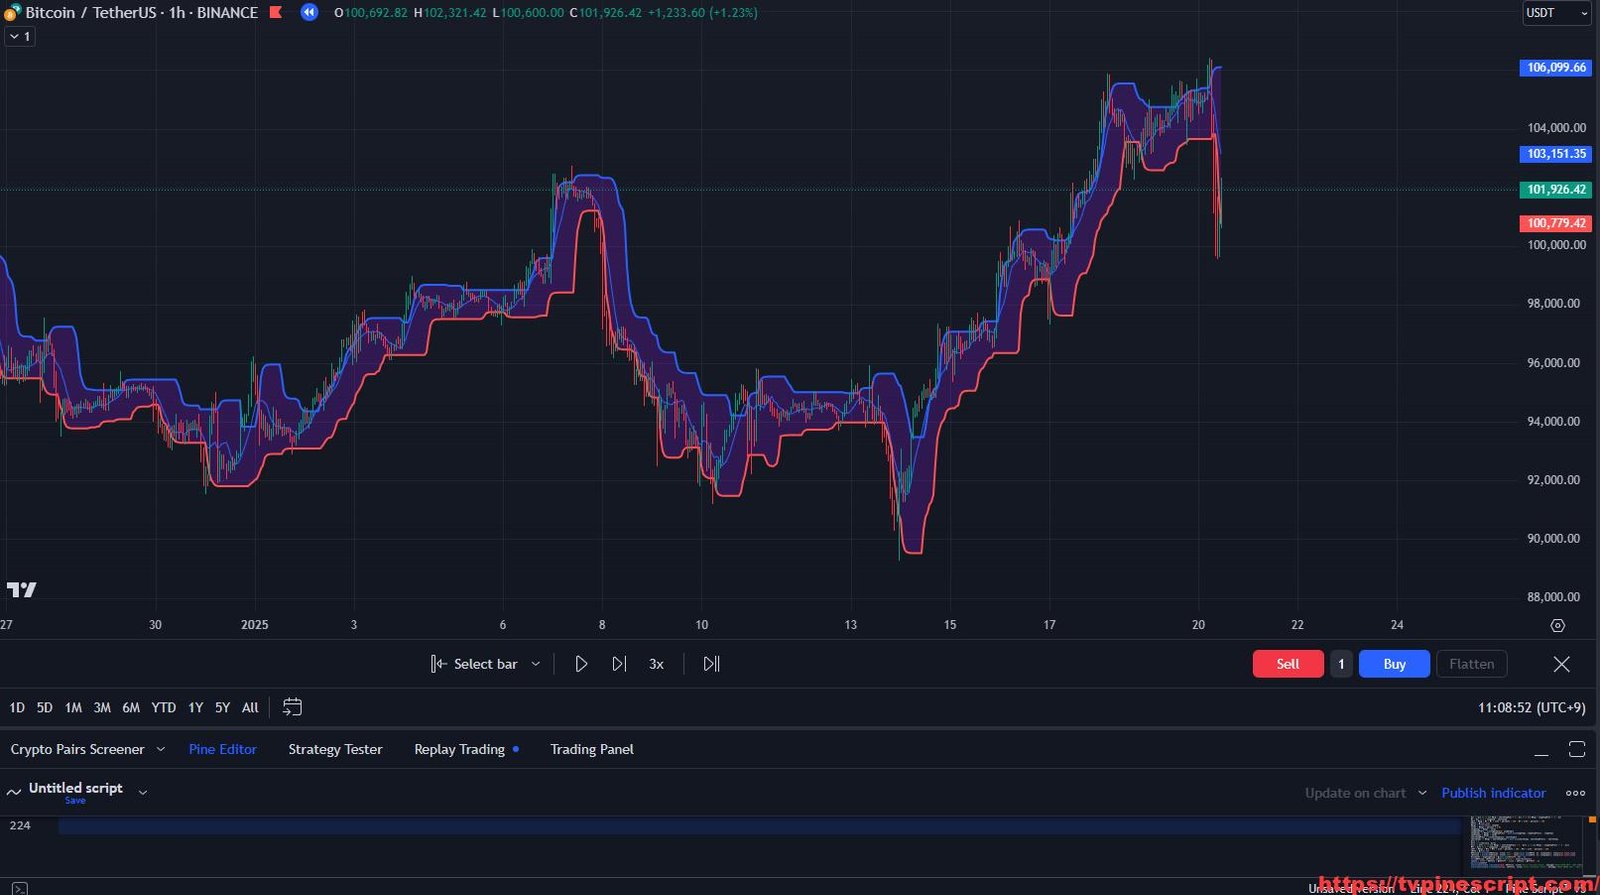
TradeGenius MA+HLOTT: Mastering Market Trends with Adaptive Moving Averages and Dynamic Support/Resistance
January 21, 2025 | by admin