ELITE SMART: Advanced Signal-Based Trading Indicator for Strategic Execution
January 24, 2025 | by admin
Achieving consistent profitability in trading requires precise signals, risk management, and trend-following strategies. The ELITE SMART indicator is designed to provide traders with high-quality buy/sell signals, trend confirmation, and customizable filtering mechanisms to optimize trade execution across multiple timeframes.
This script is ideal for traders looking to streamline their decision-making process with minimal market noise, making it suitable for both beginners and seasoned professionals.
⚠ Disclaimer: No trading indicator guarantees profits. The ELITE SMART script should be used as a strategic tool alongside sound risk management and trading discipline.
🛠 Key Features of the ELITE SMART Indicator
1. Precision Buy/Sell Signal Generation:
- Provides highly accurate buy and sell signals based on market conditions.
- Filters out false signals to enhance decision-making.
2. Advanced Trend Filtering:
- Built-in filters to eliminate market noise and focus on strong trends.
- Customizable settings to match different trading styles.
3. Multi-Timeframe Analysis:
- Supports scanning across various timeframes for trend alignment.
- Ideal for intraday traders and swing traders looking for higher timeframe confirmation.
4. Dynamic Stop Loss & Take Profit Management:
- Provides smart stop-loss levels based on volatility and trend strength.
- Multi-tier take-profit levels to lock in profits gradually.
5. User-Friendly Visuals:
- Intuitive interface with clear signal arrows and trend color coding.
- Allows traders to focus on execution without chart clutter.
6. Customizable Input Settings:
- Tailor the script to suit various asset classes and market conditions.
- Adjustable sensitivity levels to optimize performance across forex, crypto, and stocks.
7. Trend Strength Analysis:
- Measures the strength of bullish/bearish trends to avoid weak signals.
- Helps traders stay in trending markets longer for maximum gains.
8. Real-Time Alerts for Entry/Exit:
- Alerts users when key trade conditions are met.
- Ensures timely trade execution without constant monitoring.
📊 Recommended Usage
1. Scalping:
- Timeframes: 1-minute to 5-minute charts.
- Focus on quick entries and exits based on filtered signals.
2. Day Trading:
- Timeframes: 15-minute to 1-hour charts.
- Utilize stop-loss management and trend confirmation for consistent gains.
3. Swing Trading:
- Timeframes: 4-hour to daily charts.
- Use for larger trend movements with multi-level profit targets.
🔍 Script Evaluation
- Functionality: 4.8/5
- Provides accurate signals with customizable features for different markets.
- Ease of Use: 4.3/5
- Beginners might need time to adjust to advanced filtering options.
- Accuracy: 4.6/5
- Reliable in trending markets; additional confirmation may be needed in ranging markets.
- Repainting Analysis:
The script does not repaint. All signals are based on confirmed price action, ensuring reliability for live trading and backtesting. - Optimal Timeframes:
- Scalping: 1-minute to 5-minute charts.
- Day Trading: 15-minute to 1-hour charts.
- Swing Trading: 4-hour to daily charts.
- Overall Score: 4.7/5
A highly effective trading script for traders seeking a structured and systematic approach.
//@version=5
indicator("ELTE SMART", overlay=true, max_lines_count=500, max_labels_count=500, max_boxes_count=350)
// t.me/tringveo and http://t.me/trinvz
// FUNCTIONS
// Close to Close Volatility
f_coc(x, period, sqrtAnnual) =>
mean = ta.sma(x, period)
s = array.new_float(0)
for i = 0 to period - 1 by 1
array.push(s, math.pow(x[i] - mean, 2))
sqrtAnnual * math.sqrt(array.sum(s) / (period - 1))
//
// Parkinson Volatility
f_park(period, sqrtAnnual) =>
var LOG2 = math.log(2)
powLogHighLow = math.pow(math.log(high / low), 2)
sqrtAnnual * math.sqrt(1.0 / period * math.sum(1.0 / (4.0 * LOG2) * powLogHighLow, period))
// Garman Klass Volatility
f_gk(period, sqrtAnnual) =>
var LOG2 = math.log(2)
var SQRT_1_PERIOD = math.sqrt(1 / period)
powLogHighLow = math.pow(math.log(high / low), 2)
powLogCloseOpen = math.pow(math.log(close / open), 2)
tmp = 0.5 * powLogHighLow - (2.0 * LOG2 - 1.0) * powLogCloseOpen
sqrtAnnual * math.sqrt(math.sum(tmp, period)) * SQRT_1_PERIOD
// Rogers Satchell Volatility
f_rsv(period, sqrtAnnual) =>
tmp = math.log(high / close) * math.log(high / open) + math.log(low / close) * math.log(low / open)
sqrtAnnual * math.sqrt(math.sum(tmp, period) / period)
// Garman Klass Yang Zhang Extension Volatility
f_gkyz(period, sqrtAnnual) =>
var LOG2 = math.log(2)
var SQRT_1_PERIOD = math.sqrt(1 / period)
powLogHighLow = math.pow(math.log(high / low), 2)
powLogCloseOpen = math.pow(math.log(close / open), 2)
lastClose = nz(close[1], close)
powLogOpenClose1 = math.pow(math.log(open / lastClose), 2)
tmp = powLogOpenClose1 + 0.5 * powLogHighLow - (2.0 * LOG2 - 1.0) * powLogCloseOpen
sqrtAnnual * math.sqrt(math.sum(tmp, period)) * SQRT_1_PERIOD
// Yang Zhang Volatility
f_yz(a, period, sqrtAnnual) =>
o = math.log(open) - math.log(nz(close[1], close))
u = math.log(high) - math.log(open)
d = math.log(low) - math.log(open)
c = math.log(close) - math.log(open)
nMinusOne = period - 1
avgo = ta.sma(o, period)
avgc = ta.sma(c, period)
so = array.new_float(0)
sc = array.new_float(0)
for i = 0 to period - 1 by 1
array.push(so, math.pow(o[i] - avgo, 2))
array.push(sc, math.pow(c[i] - avgc, 2))
sumo = array.sum(so)
sumc = array.sum(sc)
Vo = sumo / nMinusOne
Vc = sumc / nMinusOne
Vrs = math.sum(u * (u - c) + d * (d - c), period) / period
k = (a - 1.0) / (a + (period + 1.0) / nMinusOne)
sqrtAnnual * math.sqrt(Vo + k * Vc + (1.0 - k) * Vrs)
// Exponentially Weighted Volatility
f_ewma(source, period, sqrtAnnual) =>
var lambda = (period - 1) / (period + 1)
squared = math.pow(source, 2)
float v = na
v := lambda * nz(v[1], squared) + (1.0 - lambda) * squared
sqrtAnnual * math.sqrt(v)
// Mean Absolute Deviation (Adjusted)
f_mad(source, period, sqrtAnnual) =>
var SQRT_HALF_PI = math.sqrt(math.asin(1))
mean = ta.sma(source, period)
S = array.new_float(0)
for i = 0 to period - 1 by 1
array.push(S, math.abs(source[i] - mean))
sumS = array.sum(S)
sqrtAnnual * (sumS / period) * SQRT_HALF_PI
// Median Absolute Deviation
f_mead(source, period, sqrtAnnual) =>
median = ta.percentile_nearest_rank(source, period, 50)
E = 0.0
for i = 0 to period - 1 by 1
E += math.abs(source[i] - median)
E
sqrtAnnual * math.sqrt(2) * (E / period)
//Rescale Function
f_rescale(_src, _size) =>
math.max(0, math.min(_size, int(_src / 100 * _size)))
// label Panel Function
_label(T, color_PnL) =>
label PnL_Label = na
label.delete(PnL_Label[1])
PnL_Label := label.new(time, 0, text=T, color=color_PnL, textcolor=color.white, size=size.normal, style=label.style_label_left, xloc=xloc.bar_time, textalign=text.align_left)
label.set_x(PnL_Label, label.get_x(PnL_Label) + math.round(ta.change(time) * 3))
// Round Function
Round(src, digits) =>
p = math.pow(10, digits)
math.round(math.abs(src) * p) / p * math.sign(src)
//Options for Inputs
ON = 'On'
OFF = 'Off'
CTC = 'Close to Close'
PKS = 'Parkinson'
GK = 'Garman Klass'
RS = 'Rogers Satchell'
GKYZ = 'Garman Klass Yang Zhang Extension'
YZ = 'Yang Zhang'
EWMA = 'EWMA'
MAD = 'Mean Absolute Deviation'
MAAD = 'Median Absolute Deviation'
L = 'Line'
SL = 'StepLine'
Ar = 'Area'
CL = 'Columns'
// Settings
H = EWMA
period = 10
Annual = 365
a = 1.34
Plen = 365
Pco = ON
sma = ON
malen = 55
bsg = OFF
stl = CL
lT = 3
i_invert = OFF
bg = OFF
sp = OFF
// bgcolor(bg ? color.new(#000000, 20) : na, title='Dark Background', transp=90)
var sqrtAnnual = math.sqrt(Annual) * 100
logr = math.log(close / close[1])
// Historical Volatiity Models
Hv = if H == CTC
f_coc(logr, period, sqrtAnnual)
else if H == PKS
f_park(period, sqrtAnnual)
else if H == RS
f_rsv(period, sqrtAnnual)
else if H == GK
f_gk(period, sqrtAnnual)
else if H == GKYZ
f_gkyz(period, sqrtAnnual)
else if H == EWMA
f_ewma(logr, period, sqrtAnnual)
else if H == YZ
f_yz(a, period, sqrtAnnual)
else if H == MAD
f_mad(logr, period, sqrtAnnual)
else
// H == "Median Absolute Deviation"
f_mead(logr, period, sqrtAnnual)
pstyle = stl == L ? plot.style_linebr : stl == SL ? plot.style_stepline : stl == Ar ? plot.style_area : stl == CL ? plot.style_columns : plot.style_line
//Hv Stats
avgHV = ta.sma(Hv, malen)
HVP = ta.percentrank(Hv, Plen)
NearZero = HVP < 1.5 ? 1 : 0
HV50 = ta.percentile_nearest_rank(Hv, Plen, 50)
// // Text Functions
// texthv() =>
// ' HV: ' + str.tostring(Round(Hv, 2))
// textphv() =>
// 'HV 50áµ—Ê° Percentile: ' + str.tostring(Round(HV50, 2))
// texthvp() =>
// 'HV Percentile: ' + str.tostring(Round(HVP, 2)) + 'áµ—Ê°'
// // Coloring
// var c_ = array.new_color(na)
// if barstate.isfirst
// array.push(c_, #0effff)
// array.push(c_, #00fdf6)
// array.push(c_, #00fbee)
// array.push(c_, #00f9e4)
// array.push(c_, #00f6db)
// array.push(c_, #00f4d1)
// array.push(c_, #13f1c6)
// array.push(c_, #24efbc)
// array.push(c_, #31ecb1)
// array.push(c_, #3ce9a6)
// array.push(c_, #47e69b)
// array.push(c_, #51e390)
// array.push(c_, #5adf85)
// array.push(c_, #62dc7a)
// array.push(c_, #6ad96e)
// array.push(c_, #72d563)
// array.push(c_, #7ad157)
// array.push(c_, #81cd4b)
// array.push(c_, #88ca3f)
// array.push(c_, #8fc532)
// array.push(c_, #96c123)
// array.push(c_, #9cbd0e)
// array.push(c_, #a3b800)
// array.push(c_, #a9b300)
// array.push(c_, #b0ae00)
// array.push(c_, #b6a900)
// array.push(c_, #bca300)
// array.push(c_, #c29e00)
// array.push(c_, #c29e00)
// array.push(c_, #c89800)
// array.push(c_, #ce9100)
// array.push(c_, #d48b00)
// array.push(c_, #da8400)
// array.push(c_, #df7c00)
// array.push(c_, #e57400)
// array.push(c_, #ea6c00)
// array.push(c_, #ef6200)
// array.push(c_, #f35800)
// array.push(c_, #f74c00)
// array.push(c_, #fb3e00)
// array.push(c_, #ff2d00)
// if i_invert
// array.reverse(c_)
// var sizeOf = array.size(c_) - 1
// colorHV = Pco ? array.get(c_, f_rescale(HVP, sizeOf)) : color.aqua
// Plots
// plot(Hv, 'HV', color=colorHV, linewidth=lT, style=plot.style_line)
// plot(sma ? avgHV : na, 'sma', color=color.new(#FFFFFF, 25), linewidth=2)
//bgcolor(Hv > avgHV ? color.lime : na)
// if sp
// _label(H + texthv() + '\n' + textphv() + '\n' + texthvp() + '\n\n', #000000c0)
// col2 = HVP >= 1 ? color.yellow : HVP <= 1 and HVP >= 0.5 ? color.orange : HVP <= 0.5 ? #8D0000 : color.silver
// // bgcolor(bsg and NearZero ? col2 : na, transp=50)
//Custrom MAS
maa = avgHV / 100 * 140
mab = avgHV / 100 * 180
mac = avgHV / 100 * 240
mad = avgHV / 100 * 60
mae = avgHV / 100 * 20
// Auto Sensivity Volatility Band Settings
float volatility = 0.0
if Hv < maa and Hv > avgHV // ilk band ust
volatility := 3.15
else if Hv < mab and Hv > maa // ikinci band ust
volatility := 3.5
else if Hv < mac and Hv > mab // ucuncu band ust
volatility := 3.6
else if Hv > mac // volatilite en ust degerde
volatility := 4
else if Hv < maa and Hv > mad // altdaki ilk band
volatility := 3
else if Hv < mad and Hv > mae // altdaki ikinci band
volatility := 2.85
else if Hv < mae // volatilite butun bandlarin anltinda
volatility := 3
//plot(volatility,color = color.red)
// plot(maa, 'maa', color=color.new(color.aqua, 25))
// plot(mab, 'mab', color=color.new(color.aqua, 25))
// plot(mac, 'mac', color=color.new(color.aqua, 25))
// plot(mad, 'mad', color=color.new(color.aqua, 25))
// plot(mae, 'mae', color=color.new(color.aqua, 25))
//-------------- Elite Algo v22 | https://elitesignals.com -----------------//
// Get user input
enableDashboard = input(true, "Enable Dashboard", group="DASHBOARD SETTINGS")
locationDashboard = input.string("Middle right", "Location", ["Top right", "Top left", "Middle right", "Middle left", "Bottom right", "Bottom left"], group="DASHBOARD SETTINGS")
sizeDashboard = input.string("Tiny", "Size", ["Tiny", "Small", "Normal"], group="DASHBOARD SETTINGS")
colorBackground = input(#2A2E39, "Bg color", group="DASHBOARD SETTINGS")
colorFrame = input(#2A2E39, "Frame color", group="DASHBOARD SETTINGS")
colorBorder = input(#363A45, "Border color", group="DASHBOARD SETTINGS")
showSignals = input(true, "Show signals", group="BUY AND SELL SIGNALS SETTINGS")
strategy = input.string("Normal", "Strategy", ["Normal", "Confirmed", "Trend scalper"], group="BUY AND SELL SIGNALS SETTINGS")
sensitivity11 = input.float(defval=1.8, title="Sensitivity", minval=1, maxval=20, group = 'Signals')
sensitivity = sensitivity11
auto_button = input.bool(defval = true , title = "Auto Sensitivity", group = 'Signals')
consSignalsFilter = input(false, "Consolidation signals filter", group="BUY AND SELL SIGNALS SETTINGS")
smartSignalsOnly = input(false, "Smart signals only", group="BUY AND SELL SIGNALS SETTINGS")
candleColors = input(false, "Candle colors", group="BUY AND SELL SIGNALS SETTINGS")
momentumCandles = input(false, "Momentum candles", group="BUY AND SELL SIGNALS SETTINGS")
highVolSignals = input(false, "High volume signals only", group="BUY AND SELL SIGNALS SETTINGS")
enableTrailingSL = input(false, "Enable trailing stop-loss", group="RISK MANAGEMENT SETTINGS")
usePercSL = input(false, "% Trailing sl", inline="2", group="RISK MANAGEMENT SETTINGS")
percTrailingSL = input.float(1, "", 0, step=0.1, inline="2", group="RISK MANAGEMENT SETTINGS")
enableSwings = input(false, "Enable Swing High's & Swing's Low's", inline="3", group="RISK MANAGEMENT SETTINGS")
periodSwings = input.int(10, "", 2, inline="3", group="RISK MANAGEMENT SETTINGS")
enableTpSlAreas = input(false, "Enable take profit/stop-loss areas", group="RISK MANAGEMENT SETTINGS")
useTP1 = input(true, "", inline="4", group="RISK MANAGEMENT SETTINGS")
multTP1 = input.float(1, "TP 1", 0, inline="4", group="RISK MANAGEMENT SETTINGS")
useTP2 = input(true, "", inline="5", group="RISK MANAGEMENT SETTINGS")
multTP2 = input.float(2, "TP 2", 0, inline="5", group="RISK MANAGEMENT SETTINGS")
useTP3 = input(true, "", inline="6", group="RISK MANAGEMENT SETTINGS")
multTP3 = input.float(3, "TP 3", 0, inline="6", group="RISK MANAGEMENT SETTINGS")
tpLabels = input(true, "Take profit labels", group="RISK MANAGEMENT SETTINGS")
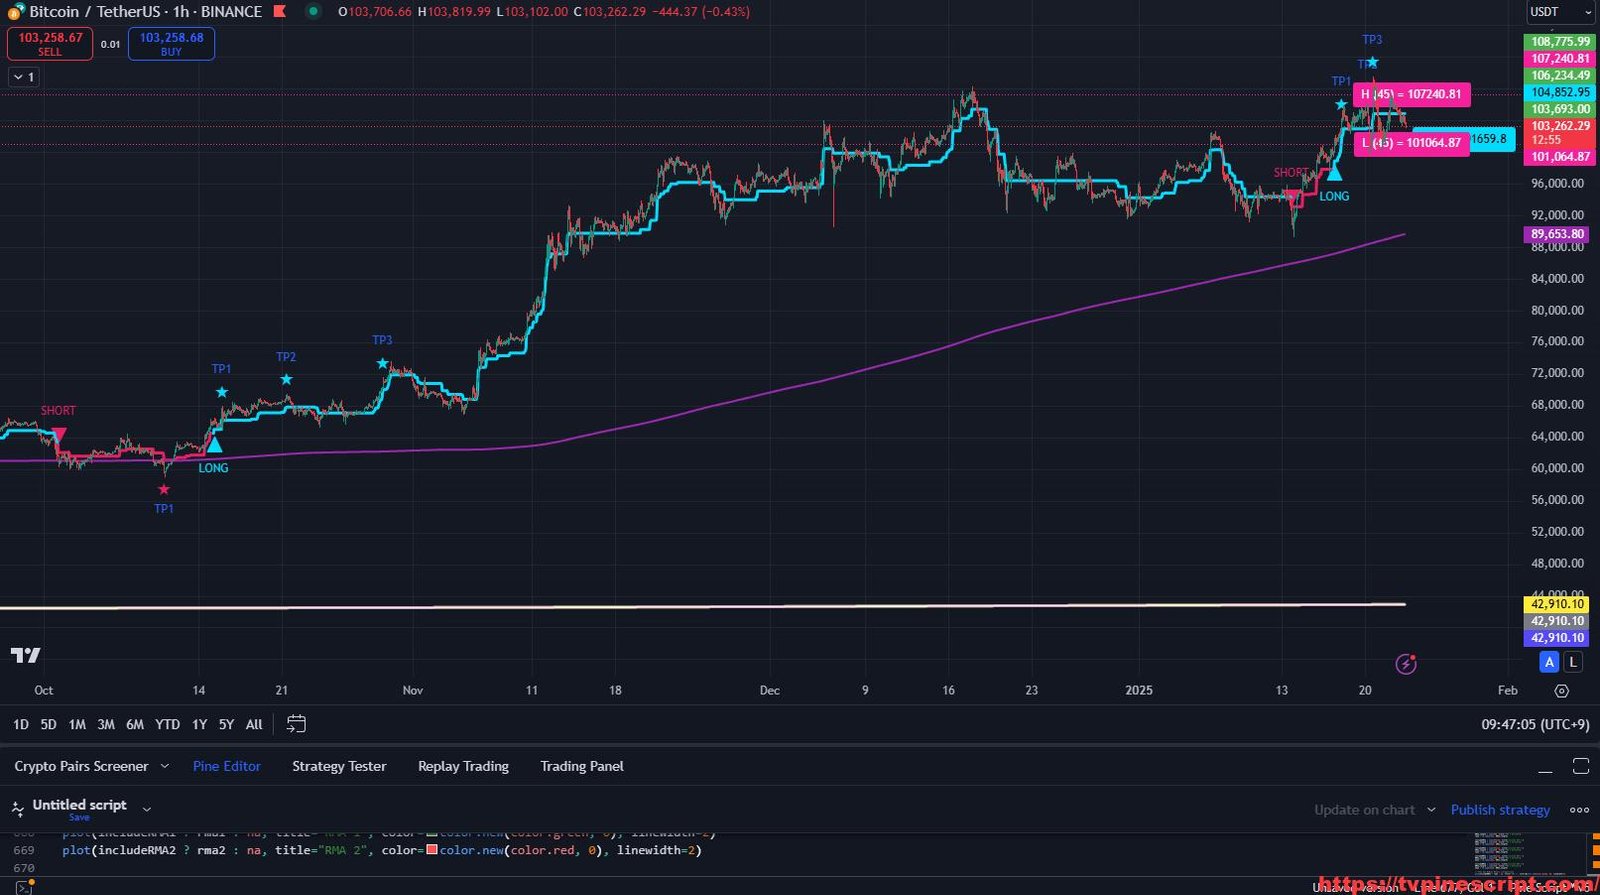
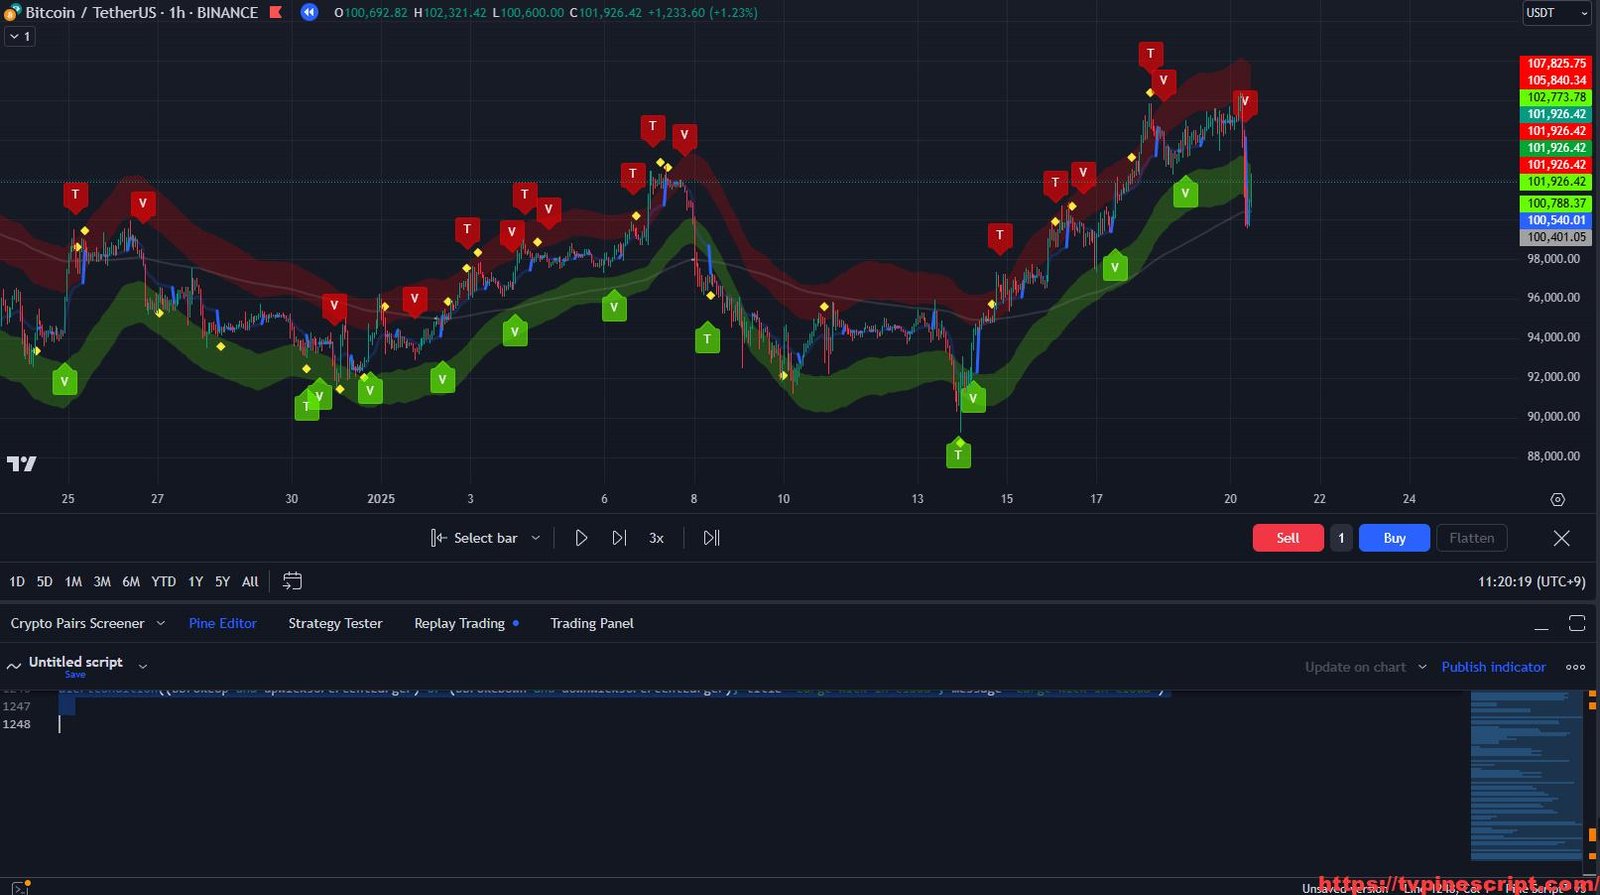
showTrendCloud = input(true, "Show Trend cloud", group="TREND CLOUD SETTINGS")
periodTrendCloud = input.string("New", "Trend cloud period", ["Short term", "Long term", "New"], group="TREND CLOUD SETTINGS")
signalsTrendCloud = input(false, "Trend only signals", group="TREND CLOUD SETTINGS")
fastTrendCloud = input(false, "Fast trend cloud", group="TREND CLOUD SETTINGS")
fastTrendCloudLen = input.int(55, "Fast trend cloud", 2, group="TREND CLOUD SETTINGS")
enableAutoTrend = input(false, "Enable Auto Trendlines", group="AUTO TRENDLINES SETTINGS")
srcTrendChannel = input(close, "Trend channel source", group="AUTO TRENDLINES SETTINGS")
lenTrendChannel = input.int(200, "Trend channel loopback", 2, group="AUTO TRENDLINES SETTINGS")
enableSR = input(false, "Enable support and resistance", group="AUTO SUPPORT AND RESISTANCE SETTINGS")
lineSrStyle = input.string("Dashed", "Line Style", ["Solid", "Dotted", "Dashed"], group="AUTO SUPPORT AND RESISTANCE SETTINGS")
lineSrWidth = input.int(2, "Line Width", 1, 4, group="AUTO SUPPORT AND RESISTANCE SETTINGS")
showCons = input(false, "Consolidation Zones", group="CONSOLIDATION ZONES")
lbPeriod = input.int(10, "Loopback Period", 2, 50, group="CONSOLIDATION ZONES")
lenCons = input.int(5, "Min Consolidation Length", 2, 20, group="CONSOLIDATION ZONES")
paintCons = input(true, "Paint Consolidation Area", group="CONSOLIDATION ZONES")
colorZone = input(color.new(color.blue, 70), "Zone Color", group="CONSOLIDATION ZONES")
box_ob = input.bool(false, "Toggle Order Block", group="ORDER BLOCK")
box_hide_gray = input.bool(false, "Hide gray boxes", group="ORDER BLOCK")
bos_type = input.string("High and Low", "MSB trigger", ["High and Low", "Close and Open"], group="ORDER BLOCK")
box_sv = input.bool(true, "Plot demand boxes", group="ORDER BLOCK")
box_test_delay = input.int(3, "Delay to count test of demand box", 1, group="ORDER BLOCK")
box_fill_delay = input.int(3, "Delay to count fill of demand box", 1, group="ORDER BLOCK")
box_test_sv = input.bool(true, "Dim tested demand boxes", group="ORDER BLOCK")
box_stop_sv = input.bool(true, "Stop plotting filled demand boxes", group="ORDER BLOCK")
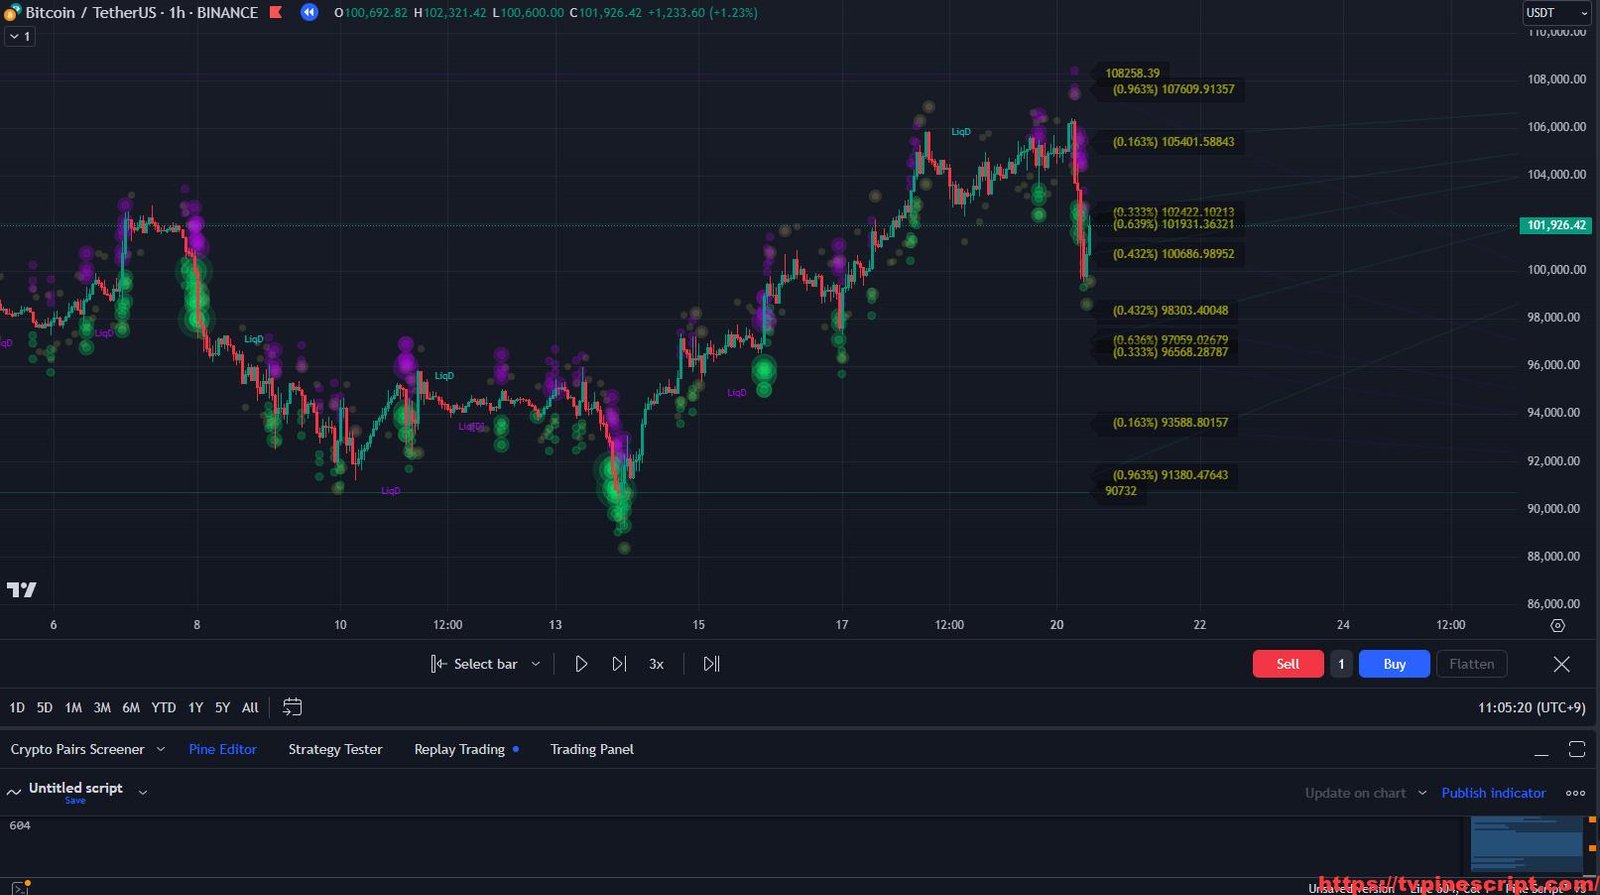
eliteVP = input(false, "Elite volume profile", group="ELITE VOLUME PROFILE")
colorBorderVP = input(color.new(color.black, 80), "Border color", group="ELITE VOLUME PROFILE")
colorBuyVP = input(#7F1623, "Buy volume", group="ELITE VOLUME PROFILE")
colorSellVP = input(#00DD00, "Sell volume", group="ELITE VOLUME PROFILE")
offset = input.int(2, "Offset", 2, 20, group="ELITE VOLUME PROFILE")
lookback = input.int(100, "Lookback", 14, 10000, group="ELITE VOLUME PROFILE")
levelNum = input.int(100, "Number of levels", 10, 1000, group="ELITE VOLUME PROFILE")
levelWidth = input.int(50, "Level width", 2, 100, group="ELITE VOLUME PROFILE")
if auto_button == false
sensitivity
else if auto_button == true
sensitivity := volatility
// Functions
f_chartTfInMinutes() =>
float _resInMinutes = timeframe.multiplier * (
timeframe.isseconds ? 1. / 60 :
timeframe.isminutes ? 1. :
timeframe.isdaily ? 60. * 24 :
timeframe.isweekly ? 60. * 24 * 7 :
timeframe.ismonthly ? 60. * 24 * 30.4375 : na)
atr(len) =>
tr = ta.tr
atr = 0.0
atr := nz(atr[1] + (tr - atr[1]) / len, tr)
supertrend(src, factor, len) =>
atr = ta.atr(len)
upperBand = src + factor * atr
lowerBand = src - factor * atr
prevLowerBand = nz(lowerBand[1])
prevUpperBand = nz(upperBand[1])
lowerBand := lowerBand > prevLowerBand or close[1] < prevLowerBand ? lowerBand : prevLowerBand
upperBand := upperBand < prevUpperBand or close[1] > prevUpperBand ? upperBand : prevUpperBand
int direction = na
float superTrend = na
prevSuperTrend = superTrend[1]
if prevSuperTrend == prevUpperBand
direction := close > upperBand ? 1 : -1
else
direction := close < lowerBand ? -1 : 1
superTrend := direction == 1 ? lowerBand : direction == -1 ? upperBand : na
dchannel(len)=>
hh = ta.highest(len)
ll = ta.lowest (len)
trend = 0
trend := close > hh[1] ? 1 : close < ll[1] ? -1 : nz(trend[1])
trendScalper(show, len1, len2, len3, colorBull, colorBear, colorBarBull, colorBarBear) =>
avgOC = math.avg(open, close)
ha_o = 0.0, ha_o := na(ha_o[1]) ? avgOC : (ha_o[1] + ohlc4[1]) / 2
ema1 = ta.ema(ha_o, len1), ema2 = ta.ema(ha_o, len2), ema3 = ta.ema(ha_o, len3)
ris1 = ema1 > ema1[1], ris2 = ema2 > ema2[1], ris3 = ema3 > ema3[1]
fal1 = ema1 < ema1[1], fal2 = ema2 < ema2[1], fal3 = ema3 < ema3[1]
colorEma1 = ris1 ? colorBull : fal1 ? colorBear : na, colorEma2 = ris2 ? colorBull : fal2 ? colorBear : na, colorEma3 = ris3 ? colorBull : fal3 ? colorBear : na
fillEma1 = avgOC > ema1 ? colorBull : avgOC < ema1 ? colorBear : na, fillEma2 = ema1 > ema2 ? colorBull : ema1 < ema2 ? colorBear : na, fillEma3 = ema2 > ema3 ? colorBull : ema2 < ema3 ? colorBear : na
colorBar = close < ema1 and close < ema2 ? colorBarBear : colorBarBull
[avgOC, show ? ema1 : na, show ? ema2 : na, show ? ema3 : na, color.new(colorEma1, 55), color.new(colorEma2, 45), color.new(colorEma3, 35), color.new(fillEma1, 85), color.new(fillEma2, 80), color.new(fillEma3, 75), colorBar]
candlesMom() =>
[_, _, macd] = ta.macd(close, 12, 26, 9)
(macd > 0 and macd > macd[1]) or (macd < 0 and macd < macd[1])
trailingSL(buy, sell, factor, len, usePerc, perc) =>
atr = atr(len)
upperBand = high + (usePerc ? high * (perc / 100) : factor * atr)
lowerBand = low - (usePerc ? low * (perc / 100) : factor * atr)
prevLowerBand = nz(lowerBand[1])
prevUpperBand = nz(upperBand[1])
lowerBand := lowerBand > prevLowerBand or buy ? lowerBand : prevLowerBand
upperBand := upperBand < prevUpperBand or sell ? upperBand : prevUpperBand
int direction = na
float stop = na
prevSuperTrend = stop[1]
if prevSuperTrend == prevUpperBand
direction := buy ? 1 : -1
else
direction := sell ? -1 : 1
stop := direction == 1 ? lowerBand : direction == -1 ? upperBand : na
add_to_zz(zz, val, bi) =>
array.unshift(zz, bi)
array.unshift(zz, val)
if array.size(zz) > 12
array.pop(zz)
update_zz(zz, val, bi, dir) =>
if array.size(zz) == 0
add_to_zz(zz, val, bi)
else
if dir == 1 and val > array.get(zz, 0) or dir == -1 and val < array.get(zz, 0)
array.set(zz, 0, val)
array.set(zz, 1, bi)
0
float ph = ta.pivothigh(high, 10, 10)
float pl = ta.pivotlow (low , 10, 10)
LSRstyle = lineSrStyle == "Dashed" ? line.style_dashed : lineSrStyle == "Solid" ? line.style_solid : line.style_dotted
prdhighest = ta.highest(300)
prdlowest = ta.lowest (300)
cwidth = (prdhighest - prdlowest) * 10 / 100
var pivotvals = array.new_float(0)
if ph or pl
array.unshift(pivotvals, ph ? ph : pl)
if array.size(pivotvals) > 20
array.pop(pivotvals)
get_sr_vals(ind) =>
float lo = array.get(pivotvals, ind)
float hi = lo
int numpp = 0
for y = 0 to array.size(pivotvals) - 1 by 1
float cpp = array.get(pivotvals, y)
float wdth = cpp <= lo ? hi - cpp : cpp - lo
if wdth <= cwidth
lo := cpp <= lo ? cpp : lo
hi := cpp > lo ? cpp : hi
numpp += 1
numpp
[hi, lo, numpp]
var sr_up_level = array.new_float(0)
var sr_dn_level = array.new_float(0)
sr_strength = array.new_float(0)
find_loc(strength) =>
ret = array.size(sr_strength)
for i = ret > 0 ? array.size(sr_strength) - 1 : na to 0 by 1
if strength <= array.get(sr_strength, i)
break
ret := i
ret
ret
check_sr(hi, lo, strength) =>
ret = true
for i = 0 to array.size(sr_up_level) > 0 ? array.size(sr_up_level) - 1 : na by 1
if array.get(sr_up_level, i) >= lo and array.get(sr_up_level, i) <= hi or array.get(sr_dn_level, i) >= lo and array.get(sr_dn_level, i) <= hi
if strength >= array.get(sr_strength, i)
array.remove(sr_strength, i)
array.remove(sr_up_level, i)
array.remove(sr_dn_level, i)
ret
else
ret := false
ret
break
ret
// Get components
rsi = ta.rsi(close, 14)
vosc = ta.obv - ta.ema(ta.obv, 20)
bs = ta.ema(nz(math.abs((open - close) / (high - low) * 100)), 3)
ema = ta.ema(close, 200)
emaBull = close > ema
equal_tf(res) => str.tonumber(res) == f_chartTfInMinutes()
higher_tf(res) => str.tonumber(res) > f_chartTfInMinutes()
too_small_tf(res) => (timeframe.isweekly and res=="1") or (timeframe.ismonthly and str.tonumber(res) < 10)
securityNoRep(sym, res, src) =>
bool bull = na
bull := equal_tf(res) ? src : bull
bull := higher_tf(res) ? request.security(sym, res, src, barmerge.gaps_off, barmerge.lookahead_on) : bull
bull_array = request.security_lower_tf(syminfo.tickerid, higher_tf(res) ? str.tostring(f_chartTfInMinutes()) : too_small_tf(res) ? (timeframe.isweekly ? "3" : "10") : res, src)
if array.size(bull_array) > 1 and not equal_tf(res) and not higher_tf(res)
bull := array.pop(bull_array)
array.clear(bull_array)
bull
TF1Bull = securityNoRep(syminfo.tickerid, "1" , emaBull)
TF3Bull = securityNoRep(syminfo.tickerid, "3" , emaBull)
TF5Bull = securityNoRep(syminfo.tickerid, "5" , emaBull)
TF10Bull = securityNoRep(syminfo.tickerid, "10" , emaBull)
TF15Bull = securityNoRep(syminfo.tickerid, "15" , emaBull)
TF30Bull = securityNoRep(syminfo.tickerid, "30" , emaBull)
TF60Bull = securityNoRep(syminfo.tickerid, "60" , emaBull)
TF120Bull = securityNoRep(syminfo.tickerid, "120" , emaBull)
TF240Bull = securityNoRep(syminfo.tickerid, "240" , emaBull)
TF720Bull = securityNoRep(syminfo.tickerid, "720" , emaBull)
TFDBull = securityNoRep(syminfo.tickerid, "1440", emaBull)
ema150 = ta.ema(close, 150)
ema250 = ta.ema(close, 250)
hma55 = ta.hma(close, 55 )
[_, _, macd] = ta.macd(close, 12, 26, 9)
supertrend = supertrend(ohlc4, sensitivity, 10)
maintrend = dchannel(30)
confBull = (ta.crossover (close, supertrend) or (ta.crossover (close, supertrend)[1] and maintrend[1] < 0)) and macd > 0 and macd > macd[1] and ema150 > ema250 and hma55 > hma55[2] and maintrend > 0
confBear = (ta.crossunder(close, supertrend) or (ta.crossunder(close, supertrend)[1] and maintrend[1] > 0)) and macd < 0 and macd < macd[1] and ema150 < ema250 and hma55 < hma55[2] and maintrend < 0
trendcloud = supertrend(ohlc4, periodTrendCloud == "Long term" ? 7 : 4, 10)
hma = fastTrendCloud ? ta.hma(close, fastTrendCloudLen) : na
none = close > 0
[_, _, adx] = ta.dmi(14, 14)
consFilter = adx > 20
smartFilter = ta.ema(close, 200)
volFilter = (ta.ema(volume, 25) - ta.ema(volume, 26)) / ta.ema(volume, 26) > 0
trendFilter = trendcloud
bull = (strategy == "Normal" ? ta.crossover (close, supertrend) : confBull and not confBull[1]) and strategy != "Trend scalper" and (smartSignalsOnly ? close > smartFilter : none) and (consSignalsFilter ? consFilter : none) and (highVolSignals ? volFilter : none) and (signalsTrendCloud ? (periodTrendCloud == "New" ? ema150 > ema250 : close > trendFilter) : none)
bear = (strategy == "Normal" ? ta.crossunder(close, supertrend) : confBear and not confBear[1]) and strategy != "Trend scalper" and (smartSignalsOnly ? close < smartFilter : none) and (consSignalsFilter ? consFilter : none) and (highVolSignals ? volFilter : none) and (signalsTrendCloud ? (periodTrendCloud == "New" ? ema150 < ema250 : close < trendFilter) : none)
countBull = ta.barssince(bull)
countBear = ta.barssince(bear)
trigger = nz(countBull, bar_index) < nz(countBear, bar_index) ? 1 : 0
[avgOC, ema5, ema9, ema21, colorEma5, colorEma9, colorEma21, fillEma5, fillEma9, fillEma21, colorBar] = trendScalper(strategy == "Trend scalper" ? true : false, 5, 9, 21, color.green, color.red, #00DD00, #DD0000)
trailingStop = trailingSL(bull, bear, 2.2, 14, usePercSL, percTrailingSL)
float _ph = ta.highestbars(high, periodSwings) == 0 ? high : na
float _pl = ta.lowestbars (low, periodSwings) == 0 ? low : na
var _dir = 0, dir_ = _pl and na(_ph) ? -1 : _dir, _dir := _ph and na(_pl) ? 1 : dir_, dirChg = ta.change(_dir)
var zz = array.new_float(0), zzOld = array.copy(zz)
float zzLive = _ph or _pl ? (dirChg ? add_to_zz(zz, _dir == 1 ? _ph : _pl, bar_index) : update_zz(zz, _dir == 1 ? _ph : _pl, bar_index, _dir)) : na
aA = ta.wma(srcTrendChannel, lenTrendChannel), b = ta.sma(srcTrendChannel, lenTrendChannel)
A = 4 * b - 3 * aA, B = 3 * aA - 2 * b
m = (A - B) / (lenTrendChannel - 1)
d = 0., for i = 0 to lenTrendChannel - 1 by 1
l = B + m * i
d += math.pow(srcTrendChannel[i] - l, 2)
rmse = math.sqrt(d / (lenTrendChannel - 1)) * 2
float hb_ = ta.highestbars(lbPeriod) == 0 ? high : na
float lb_ = ta.lowestbars (lbPeriod) == 0 ? low : na
var int dir = 0
float zz_ = na
float pp = na
var int consCnt = 0
var float condHi = na
var float condLo = na
float H_ = ta.highest(lenCons)
float L_ = ta.lowest (lenCons)
var line lineUp = na
var line lineDn = na
bool breakUp = false
bool breakDn = false
var float[] pvh1_price = array.new_float(1000, na)
var int[] pvh1_time = array.new_int (1000, na)
var float[] pvl1_price = array.new_float(1000, na)
var int[] pvl1_time = array.new_int (1000, na)
var float[] pvh2_price = array.new_float(1000, na)
var int[] pvh2_time = array.new_int (1000, na)
var float[] pvl2_price = array.new_float(1000, na)
var int[] pvl2_time = array.new_int (1000, na)
var float htcmrll_price = na
var int htcmrll_time = na
var float ltcmrhh_price = na
var int ltcmrhh_time = na
var box[] long_boxes = array.new_box()
var box[] short_boxes = array.new_box()
var float temp_pv_0 = na
var float temp_pv_1 = na
var float temp_pv_2 = na
bool pvh = high < high[1] and high[1] > high[2]
bool pvl = low > low [1] and low [1] < low [2]
int pv1_time = bar_index[1]
float pv1_high = high[1]
float pv1_low = low [1]
float trigger_high = bos_type == "High and Low" ? high : math.max(open, close)
float trigger_low = bos_type == "High and Low" ? low : math.min(open, close)
rangeHigh = ta.highest(high, lookback)
rangeLow = ta.lowest(low, lookback)
rangeHeight = rangeHigh - rangeLow
histogramHeight = rangeHeight / levelNum
histogramLowList = array.new_float(levelNum, na)
histogramHighList = array.new_float(levelNum, na)
histogramBuyVolumeList = array.new_float(levelNum, 0.0)
histogramSellVolumeList = array.new_float(levelNum, 0.0)
var buyBars = array.new_box(365, na)
for i = 0 to 364
box.delete(array.get(buyBars, i))
var sellBars = array.new_box(365, na)
for i = 0 to 364
box.delete(array.get(sellBars, i))
// Colors
green = #f7f9f7, green50 = color.new(green, 50), green20 = color.new(green, 80)
red = #f8f1f1, red50 = color.new(red, 50), red20 = color.new(red, 80)
silver = #B2B5BE, silver50 = color.new(silver, 50), silver20 = color.new(silver, 80)
// Plots
atrBand = usePercSL ? (trigger ? low : high) * (percTrailingSL / 100) : ta.atr(14) * 2.2
atrStop = trigger ? low - atrBand : high + atrBand
lastTrade(src) => ta.valuewhen(bull or bear, src, 0)
entry_y = lastTrade(close)
stop_y = lastTrade(atrStop)
tp1_y = (entry_y-lastTrade(atrStop))*multTP1 + entry_y
tp2_y = (entry_y-lastTrade(atrStop))*multTP2 + entry_y
tp3_y = (entry_y-lastTrade(atrStop))*multTP3 + entry_y
labelTpSl(cond, y, txt, color) =>
label labelTpSl = enableTpSlAreas and cond ? label.new(bar_index + 1, y, txt, xloc.bar_index, yloc.price, color, label.style_label_left, color.white, size.normal) : na
label.delete(labelTpSl[1])
labelTpSl(none, entry_y, "Entry : " + str.tostring(math.round_to_mintick(entry_y)), color.orange)
labelTpSl(none, stop_y , "Stop loss : " + str.tostring(math.round_to_mintick(atrStop)), color.red)
labelTpSl(useTP1 and multTP1 != 0, tp1_y, "TP 1 : " + str.tostring(math.round_to_mintick(tp1_y)), color.green)
labelTpSl(useTP2 and multTP2 != 0, tp2_y, "TP 2 : " + str.tostring(math.round_to_mintick(tp2_y)), color.green)
labelTpSl(useTP3 and multTP3 != 0, tp3_y, "TP 3 : " + str.tostring(math.round_to_mintick(tp3_y)), color.green)
lineTpSl(cond, y, color, style) =>
line lineTpSl = enableTpSlAreas and cond ? line.new(bar_index - (trigger ? countBull : countBear), y, bar_index + 1, y, xloc.bar_index, extend.none, color, style) : na
line.delete(lineTpSl[1])
lineTpSl(none, entry_y, color.orange, line.style_dashed)
lineTpSl(none, stop_y , color.red , line.style_solid )
lineTpSl(useTP1 and multTP1 != 0, tp1_y, color.green, line.style_dotted)
lineTpSl(useTP2 and multTP2 != 0, tp2_y, color.green, line.style_dotted)
lineTpSl(useTP3 and multTP3 != 0, tp3_y, color.green, line.style_dotted)
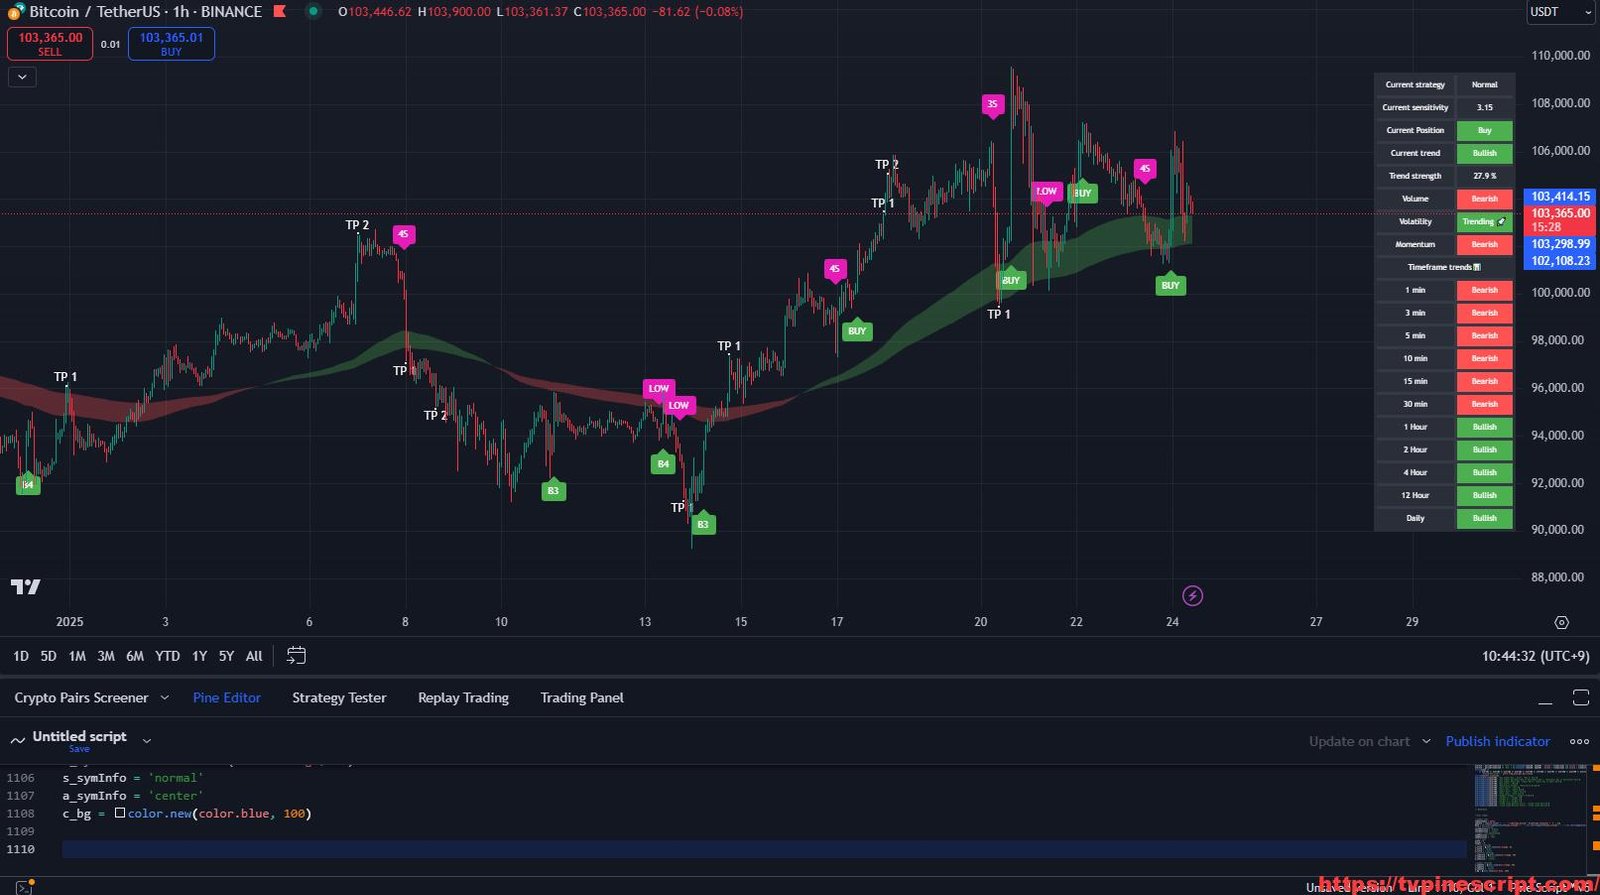
var dashboard_loc = locationDashboard == "Top right" ? position.top_right : locationDashboard == "Top left" ? position.top_left : locationDashboard == "Middle right" ? position.middle_right : locationDashboard == "Middle left" ? position.middle_left : locationDashboard == "Bottom right" ? position.bottom_right : position.bottom_left
var dashboard_size = sizeDashboard == "Tiny" ? size.tiny : sizeDashboard == "Small" ? size.small : size.normal
var dashboard = table.new(dashboard_loc, 2, 20, colorBackground, colorFrame, 3, colorBorder, 3)
dashboard_cell(column, row, txt) => table.cell(dashboard, column, row, txt, 0, 0, color.white, text_size=dashboard_size)
dashboard_cell_bg(column, row, col) => table.cell_set_bgcolor(dashboard, column, row, col)
if barstate.islast and enableDashboard
dashboard_cell(0, 0 , "Current strategy")
dashboard_cell(0, 1 , "Current sensitivity")
dashboard_cell(0, 2 , "Current Position")
dashboard_cell(0, 3 , "Current trend")
dashboard_cell(0, 4 , "Trend strength")
dashboard_cell(0, 5 , "Volume")
dashboard_cell(0, 6 , "Volatility")
dashboard_cell(0, 7 , "Momentum")
dashboard_cell(0, 8 , "Timeframe trends📊"), table.merge_cells(dashboard, 0, 8, 1, 8)
dashboard_cell(0, 9 , "1 min")
dashboard_cell(0, 10, "3 min")
dashboard_cell(0, 11, "5 min")
dashboard_cell(0, 12, "10 min")
dashboard_cell(0, 13, "15 min")
dashboard_cell(0, 14, "30 min")
dashboard_cell(0, 15, "1 Hour")
dashboard_cell(0, 16, "2 Hour")
dashboard_cell(0, 17, "4 Hour")
dashboard_cell(0, 18, "12 Hour")
dashboard_cell(0, 19, "Daily")
dashboard_cell(1, 0 , strategy)
dashboard_cell(1, 1 , str.tostring(sensitivity))
dashboard_cell(1, 2 , strategy != "Trend scalper" ? (trigger ? "Buy" : "Sell") : ""), dashboard_cell_bg(1, 2, strategy != "Trend scalper" ? (trigger ? color.green : color.red) : colorBackground)
dashboard_cell(1, 3 , emaBull ? "Bullish" : "Bearish"), dashboard_cell_bg(1, 3, emaBull ? color.green : color.red)
dashboard_cell(1, 4 , str.tostring(bs, "0.0") + " %")
dashboard_cell(1, 5 , vosc > 0 ? "Bullish" : "Bearish"), dashboard_cell_bg(1, 5, vosc > 0 ? color.green : color.red)
dashboard_cell(1, 6 , adx > 20 ? "Trending 🚀" : "Ranging ⚠️"), dashboard_cell_bg(1, 6, adx > 20 ? color.green : color.orange)
dashboard_cell(1, 7 , rsi > 50 ? "Bullish" : "Bearish"), dashboard_cell_bg(1, 7, rsi > 50 ? color.green : color.red)
dashboard_cell(1, 9 , TF1Bull ? "Bullish" : "Bearish"), dashboard_cell_bg(1, 9 , TF1Bull ? color.green : color.red)
dashboard_cell(1, 10, TF3Bull ? "Bullish" : "Bearish"), dashboard_cell_bg(1, 10, TF3Bull ? color.green : color.red)
dashboard_cell(1, 11, TF5Bull ? "Bullish" : "Bearish"), dashboard_cell_bg(1, 11, TF5Bull ? color.green : color.red)
dashboard_cell(1, 12, TF10Bull ? "Bullish" : "Bearish"), dashboard_cell_bg(1, 12, TF10Bull ? color.green : color.red)
dashboard_cell(1, 13, TF15Bull ? "Bullish" : "Bearish"), dashboard_cell_bg(1, 13, TF15Bull ? color.green : color.red)
dashboard_cell(1, 14, TF30Bull ? "Bullish" : "Bearish"), dashboard_cell_bg(1, 14, TF30Bull ? color.green : color.red)
dashboard_cell(1, 15, TF60Bull ? "Bullish" : "Bearish"), dashboard_cell_bg(1, 15, TF60Bull ? color.green : color.red)
dashboard_cell(1, 16, TF120Bull ? "Bullish" : "Bearish"), dashboard_cell_bg(1, 16, TF120Bull ? color.green : color.red)
dashboard_cell(1, 17, TF240Bull ? "Bullish" : "Bearish"), dashboard_cell_bg(1, 17, TF240Bull ? color.green : color.red)
dashboard_cell(1, 18, TF720Bull ? "Bullish" : "Bearish"), dashboard_cell_bg(1, 18, TF720Bull ? color.green : color.red)
dashboard_cell(1, 19, TFDBull ? "Bullish" : "Bearish"), dashboard_cell_bg(1, 19, TFDBull ? color.green : color.red)
l(css, k) =>
line lr = enableAutoTrend ? line.new(bar_index - lenTrendChannel + 1, A + k, bar_index, B + k, extend=extend.right, color=css) : na
line.delete(lr[1])
l(color.blue, rmse), l(color.blue, 0), l(color.blue, -rmse)
//
//=============================================================================
// INDICATOR 11 - Trend Confidence
//============================================================================
// CCI
TM_Long = ta.cci(close, 14) > 0
TM_Short = ta.cci(close, 14) < 0
//color1 = ta.cci(close, 5) >= 0 ? #0022FC : #FC0400
//plot(MagicTrend, color=color1, linewidth=3)
// ADX
lenadx = 21
lensig = 21
limadx = 34
ADX_up = ta.change(high)
ADX_down = -ta.change(low)
trur = ta.rma(ta.tr, lenadx)
plus = fixnan(100 * ta.rma(ADX_up > ADX_down and ADX_up > 0 ? ADX_up : 0, lenadx) / trur)
minus = fixnan(100 * ta.rma(ADX_down > ADX_up and ADX_down > 0 ? ADX_down : 0, lenadx) / trur)
sum = plus + minus
adxxs = 100 * ta.rma(math.abs(plus - minus) / (sum == 0 ? 1 : sum), lensig)
macol = adxxs > limadx and plus > minus ? color.lime : adxxs > limadx and plus < minus ? color.red : color.black
ADX_Long = adxxs > limadx and plus > minus
ADX_Short = adxxs > limadx and plus < minus
//Acumulation/Distribution
ACC_Dist = ta.sma(ta.accdist, 34)
ACC_Long = ta.accdist > ACC_Dist
ACC_Short = ta.accdist < ACC_Dist
// MFI
MFI = ta.mfi(close , 21)
MFI_SMA = ta.sma (MFI, 13)
MFI_Long = MFI > MFI_SMA
MFI_Short = MFI < MFI_SMA
// Momentum Linear Regression
mom = ta.mom(close, 21)
lrmom = ta.linreg(mom, 28, 0)
MOML_Long = lrmom > lrmom[1]
MOML_Short = lrmom < lrmom[1]
//
entry_long = true
entry_short = true
Long_Signal_Strength = 0
Short_Signal_Strength = 0
if entry_long
if TM_Long
Long_Signal_Strength += 1
if ADX_Long
Long_Signal_Strength += 1
if ACC_Long
Long_Signal_Strength += 1
if MFI_Long
Long_Signal_Strength += 1
if MOML_Long
Long_Signal_Strength += 1
if entry_short
if TM_Short
Short_Signal_Strength += 1
if ADX_Short
Short_Signal_Strength += 1
if ACC_Short
Short_Signal_Strength += 1
if MFI_Short
Short_Signal_Strength += 1
if MOML_Short
Short_Signal_Strength += 1
//Plot Buy/Sell Signals on chart
smartbuysigtex = str.tostring("BUY")
smartselsigtex = str.tostring ("LOW")
buysigtex = "B" + str.tostring(Long_Signal_Strength) + ""
selsigtex = str.tostring(Short_Signal_Strength) + "" + "S"
enter_Long_Text = close > smartFilter ? smartbuysigtex : buysigtex
enter_Short_Text = close < smartFilter ? smartselsigtex : selsigtex
//
buy = showSignals and bull ? label.new(bar_index, low ,enter_Long_Text , xloc.bar_index, yloc.belowbar, color.green, label.style_label_up , color.white, size.small) : na
sell = showSignals and bear ? label.new(bar_index, high,enter_Short_Text , xloc.bar_index, yloc.abovebar, #e71cb8 , label.style_label_down, color.white, size.small) : na
//
tpLabels(tp) =>
tp1Bull = ta.crossover (rsi, 70), tp2Bull = ta.crossover (rsi, 75), tp3Bull = ta.crossover (rsi, 80)
tp1Bear = ta.crossunder(rsi, 30), tp2Bear = ta.crossunder(rsi, 25), tp3Bear = ta.crossunder(rsi, 20)
tp1Bull := tp1Bull and (nz(ta.barssince(tp1Bull)[1], 9999) > countBull), tp2Bull := tp2Bull and (ta.barssince(tp1Bull)[1] <= countBull), tp2Bull := tp2Bull and (nz(ta.barssince(tp2Bull)[1], 9999) > countBull), tp3Bull := tp3Bull and (ta.barssince(tp2Bull)[1] <= countBull), tp3Bull := tp3Bull and (nz(ta.barssince(tp3Bull)[1], 9999) > countBull)
tp1Bear := tp1Bear and (nz(ta.barssince(tp1Bear)[1], 9999) > countBear), tp2Bear := tp2Bear and (ta.barssince(tp1Bear)[1] <= countBear), tp2Bear := tp2Bear and (nz(ta.barssince(tp2Bear)[1], 9999) > countBear), tp3Bear := tp3Bear and (ta.barssince(tp2Bear)[1] <= countBear), tp3Bear := tp3Bear and (nz(ta.barssince(tp3Bear)[1], 9999) > countBear)
if strategy != "Trend scalper" and tpLabels
trigger ? (tp == 1 ? tp1Bull : tp == 2 ? tp2Bull : tp3Bull) : (tp == 1 ? tp1Bear : tp == 2 ? tp2Bear : tp3Bear)
plotshape(tpLabels(1), "", shape.cross, location.abovebar, trigger ? green : na , 0, "TP 1", trigger ? green : na , false)
plotshape(tpLabels(2), "", shape.cross, location.abovebar, trigger ? green : na , 0, "TP 2", trigger ? green : na , false)
plotshape(tpLabels(3), "", shape.cross, location.abovebar, trigger ? green : na , 0, "TP 3", trigger ? green : na , false)
plotshape(tpLabels(1), "", shape.cross, location.belowbar, trigger ? na : red, 0, "TP 1", trigger ? na : red, false)
plotshape(tpLabels(2), "", shape.cross, location.belowbar, trigger ? na : red, 0, "TP 2", trigger ? na : red, false)
plotshape(tpLabels(3), "", shape.cross, location.belowbar, trigger ? na : red, 0, "TP 3", trigger ? na : red, false)
var label zzLabel = na
if array.size(zz) > 12 and enableSwings
if array.get(zz, 0) != array.get(zzOld, 0) or array.get(zz, 1) != array.get(zzOld, 1)
if array.get(zz, 2) == array.get(zzOld, 2) and array.get(zz, 3) == array.get(zzOld, 3)
label.delete(zzLabel)
zzLabel := label.new(math.round(array.get(zz, 1)), array.get(zz, 0), _dir == 1 ? array.get(zz, 0) > array.get(zz, 4) ? ((array.get(zz, 4) < array.get(zz, 8)) ? "High" : "HH") : "LH" : array.get(zz, 0) < array.get(zz, 4) ? ((array.get(zz, 4) > array.get(zz, 8)) ? "Low" : "LL") : "HL", xloc.bar_index, yloc.price, color.new(color.white, 100), _dir == 1 ? label.style_label_down : label.style_label_up, _dir == 1 ? color.green : color.red)
var sr_lines = array.new_line(11, na)
for x = 1 to 10 by 1
line.set_color(array.get(sr_lines, x), color=line.get_y1(array.get(sr_lines, x)) >= close ? color.red : color.lime)
if ph or pl
array.clear(sr_up_level)
array.clear(sr_dn_level)
array.clear(sr_strength)
for x = 0 to array.size(pivotvals) - 1 by 1
[hi, lo, strength] = get_sr_vals(x)
if check_sr(hi, lo, strength)
loc = find_loc(strength)
if loc < 5 and strength >= 2
array.insert(sr_strength, loc, strength)
array.insert(sr_up_level, loc, hi)
array.insert(sr_dn_level, loc, lo)
if array.size(sr_strength) > (enableSR ? 5 : 0)
array.pop(sr_strength)
array.pop(sr_up_level)
array.pop(sr_dn_level)
for x = 1 to 10 by 1
line.delete(array.get(sr_lines, x))
for x = 0 to array.size(sr_up_level) > 0 ? array.size(sr_up_level) - 1 : na by 1
float mid = math.round_to_mintick((array.get(sr_up_level, x) + array.get(sr_dn_level, x)) / 2)
rate = 100 * (mid - close) / close
array.set(sr_lines, x + 1, line.new(x1=bar_index, y1=mid, x2=bar_index - 1, y2=mid, extend=extend.both, color=mid >= close ? color.red : color.lime, style=LSRstyle, width=lineSrWidth))
if showCons and barstate.isconfirmed
dir := hb_ and na(lb_) ? 1 : lb_ and na(hb_) ? -1 : dir
if hb_ and lb_
if dir == 1
zz_ := hb_
else
zz_ := lb_
else
zz_ := hb_ ? hb_ : lb_ ? lb_ : na
for x = 0 to 1000
if na(close) or dir != dir[x]
break
if zz_[x]
if na(pp)
pp := zz_[x]
else
if dir[x] == 1 and zz_[x] > pp
pp := zz_[x]
if dir[x] == -1 and zz_[x] < pp
pp := zz_[x]
if pp != pp[1]
if consCnt > lenCons
if pp > condHi
breakUp := true
if pp < condLo
breakDn := true
if consCnt > 0 and pp <= condHi and pp >= condLo
consCnt += 1
else
consCnt := 0
else
consCnt += 1
if consCnt >= lenCons
if consCnt == lenCons
condHi := H_
condLo := L_
else
line.delete(lineUp)
line.delete(lineDn)
condHi := math.max(condHi, high)
condLo := math.min(condLo, low )
lineUp := line.new(bar_index, condHi , bar_index - consCnt, condHi , color=color.red , style=line.style_dashed)
lineDn := line.new(bar_index, condLo , bar_index - consCnt, condLo , color=color.lime, style=line.style_dashed)
fill(plot(condHi, "", na, 1, plot.style_stepline, editable=false), plot(condLo, "", na, 1, plot.style_stepline, editable=false), paintCons and consCnt > lenCons ? colorZone : na, "", false)
if box_ob and barstate.isconfirmed
if pvh
array.pop(pvh1_price)
array.pop(pvh1_time)
array.unshift(pvh1_price, pv1_high)
array.unshift(pvh1_time, pv1_time)
if array.size(pvh1_price) > 2
temp_pv_0 := array.get(pvh1_price, 0)
temp_pv_1 := array.get(pvh1_price, 1)
temp_pv_2 := array.get(pvh1_price, 2)
if temp_pv_0 > temp_pv_1
for i = 0 to array.size(pvl1_time) - 1 by 1
temp_ltcmrhh_time = array.get(pvl1_time, i)
if temp_ltcmrhh_time < array.get(pvh1_time, 0)
ltcmrhh_price := array.get(pvl1_price, i)
ltcmrhh_time := temp_ltcmrhh_time
break
if temp_pv_0 < temp_pv_1 and temp_pv_1 > temp_pv_2
array.pop(pvh2_price)
array.pop(pvh2_time)
array.unshift(pvh2_price, temp_pv_1)
array.unshift(pvh2_time, array.get(pvh1_time, 1))
if pvl
array.pop(pvl1_price)
array.pop(pvl1_time)
array.unshift(pvl1_price, pv1_low)
array.unshift(pvl1_time, pv1_time)
if array.size(pvl1_price) > 2
temp_pv_0 := array.get(pvl1_price, 0)
temp_pv_1 := array.get(pvl1_price, 1)
temp_pv_2 := array.get(pvl1_price, 2)
if temp_pv_0 < temp_pv_1
for i = 0 to array.size(pvh1_time) - 1 by 1
temp_htcmrll_time = array.get(pvh1_time, i)
if temp_htcmrll_time < array.get(pvl1_time, 0)
htcmrll_price := array.get(pvh1_price, i)
htcmrll_time := temp_htcmrll_time
break
if temp_pv_0 > temp_pv_1 and temp_pv_1 < temp_pv_2
array.pop(pvl2_price)
array.pop(pvl2_time)
array.unshift(pvl2_price, temp_pv_1)
array.unshift(pvl2_time, array.get(pvl1_time, 1))
if trigger_high > htcmrll_price
if box_sv
loBox = box.new(left=array.get(pvl1_time, 0), top=math.min(high[bar_index - array.get(pvl1_time, 0)], high[bar_index - array.get(pvl1_time, 0) + 1]), right=bar_index, bottom=array.get(pvl1_price, 0), bgcolor=color.rgb(0, 255, 0, 80), border_color=color.rgb(0, 255, 0, 80), extend=extend.right)
if array.size(long_boxes) >= 25
box.delete(array.shift(long_boxes))
array.push(long_boxes, loBox)
htcmrll_price := na
htcmrll_price
if trigger_low < ltcmrhh_price
if box_sv
hiBox = box.new(left=array.get(pvh1_time, 0), top=array.get(pvh1_price, 0), right=bar_index, bottom=math.max(low[bar_index - array.get(pvh1_time, 0)], low[bar_index - array.get(pvh1_time, 0) + 1]), bgcolor=color.rgb(255, 0, 0, 80), border_color=color.rgb(255, 0, 0, 80), extend=extend.right)
if array.size(short_boxes) >= 25
box.delete(array.shift(short_boxes))
array.push(short_boxes, hiBox)
ltcmrhh_price := na
ltcmrhh_price
if array.size(short_boxes) > 0
for i = array.size(short_boxes) - 1 to 0 by 1
tbox = array.get(short_boxes, i)
top = box.get_top(tbox)
bottom = box.get_bottom(tbox)
if trigger_high > bottom and box.get_left(tbox) + box_test_delay < bar_index and box_test_sv
if box_hide_gray
box.set_bgcolor(tbox, #00000000)
box.set_border_color(tbox, #00000000)
else
box.set_bgcolor(tbox, color.rgb(192, 192, 192, 80))
box.set_border_color(tbox, color.rgb(192, 192, 192, 80))
if trigger_high > top and box.get_left(tbox) + box_fill_delay < bar_index
if box_stop_sv
box.set_right(tbox, bar_index)
box.set_extend(tbox, extend.none)
array.remove(short_boxes, i)
if array.size(long_boxes) > 0
for i = array.size(long_boxes) - 1 to 0 by 1
lbox = array.get(long_boxes, i)
top = box.get_top(lbox)
bottom = box.get_bottom(lbox)
if trigger_low < top and box.get_left(lbox) + box_test_delay < bar_index and box_test_sv
if box_hide_gray
box.set_bgcolor(lbox, #00000000)
box.set_border_color(lbox, #00000000)
else
box.set_bgcolor(lbox, color.rgb(192, 192, 192, 80))
box.set_border_color(lbox, color.rgb(192, 192, 192, 80))
if trigger_low < bottom and box.get_left(lbox) + box_fill_delay < bar_index
if box_stop_sv
box.set_right(lbox, bar_index)
box.set_extend(lbox, extend.none)
array.remove(long_boxes, i)
if barstate.islast and eliteVP
for i = 0 to levelNum - 1
histogramLow = rangeLow + histogramHeight * i
histogramHigh = rangeLow + histogramHeight * (i + 1)
array.set(histogramLowList, i, histogramLow)
array.set(histogramHighList, i, histogramHigh)
for i = 0 to lookback - 1
currentBarHeight = high[i] - low[i]
currentBuyVolume = high[i] == low[i] ? 0 : volume[i] * (close[i] - low [i]) / currentBarHeight
currentSellVolume = high[i] == low[i] ? 0 : volume[i] * (high [i] - close[i]) / currentBarHeight
for j = 0 to levelNum - 1
histogramLow = array.get(histogramLowList, j)
histogramHigh = array.get(histogramHighList, j)
target = math.max(histogramHigh, high[i]) - math.min(histogramLow, low[i]) - (math.max(histogramHigh, high[i]) - math.min(histogramHigh, high[i])) - (math.max(histogramLow, low[i]) - math.min(histogramLow, low[i]))
histogramVolumePercentage = target / currentBarHeight
histogramBuyVolume = array.get(histogramBuyVolumeList, j)
histogramSellVolume = array.get(histogramSellVolumeList, j)
if histogramVolumePercentage > 0
array.set(histogramBuyVolumeList, j, histogramBuyVolume + currentBuyVolume * histogramVolumePercentage)
array.set(histogramSellVolumeList, j, histogramSellVolume + currentSellVolume * histogramVolumePercentage)
highestHistogramVolume = 0.0
for i = 0 to levelNum - 1
histogramBuyVolume = array.get(histogramBuyVolumeList, i)
histogramSellVolume = array.get(histogramSellVolumeList, i)
histogramVolume = histogramBuyVolume + histogramSellVolume
highestHistogramVolume := math.max(highestHistogramVolume, histogramVolume)
highestHistogramVolume
for i = 0 to levelNum - 1
histogramLow = array.get(histogramLowList, i)
histogramHigh = array.get(histogramHighList, i)
histogramBuyVolume = array.get(histogramBuyVolumeList, i)
histogramSellVolume = array.get(histogramSellVolumeList, i)
histogramVolume = histogramBuyVolume + histogramSellVolume
histogramWidth = levelWidth * histogramVolume / highestHistogramVolume
histogramBuyWidth = math.floor(histogramWidth * histogramBuyVolume / histogramVolume)
histogramSellWidth = math.floor(histogramWidth * histogramSellVolume / histogramVolume)
array.set(buyBars , i, box.new(bar_index + offset + levelWidth - 1 - histogramBuyWidth, histogramHigh, bar_index + offset + levelWidth - 1 , histogramLow, colorBorderVP, bgcolor=colorBuyVP ))
array.set(sellBars, i, box.new(bar_index + offset + levelWidth - 1 - histogramBuyWidth, histogramHigh, bar_index + offset + levelWidth - 1 - histogramBuyWidth - histogramSellWidth, histogramLow, colorBorderVP, bgcolor=colorSellVP))
barcolor(momentumCandles and candlesMom() ? color.purple : candleColors ? (strategy == "Trend scalper" ? colorBar : na(countBull) and na(countBear) ? color.gray : trigger ? green : red) : na, editable=false)
fill(plot(showTrendCloud and periodTrendCloud == "New" ? ema150 : na, "", na, editable=false), plot(showTrendCloud and periodTrendCloud == "New" ? ema250 : na, "", na, editable=false), ema150 > ema250 ? color.new(color.green, 70) : ema150 < ema250 ? color.new(color.red, 70) : na)
plot(enableTrailingSL and trigger and nz(ta.barssince(low < trailingStop), bar_index) > countBull ? trailingStop : na, "", green, 1, plot.style_linebr, editable=false)
plot(enableTrailingSL and not trigger and nz(ta.barssince(high > trailingStop), bar_index) > countBear ? trailingStop : na, "", red , 1, plot.style_linebr, editable=false)
p0 = plot(avgOC, "", na , editable=false)
p1 = plot(ema5 , "", colorEma5 , editable=false)
p2 = plot(ema9 , "", colorEma9 , editable=false)
p3 = plot(ema21, "", colorEma21, editable=false)
fill(p0, p1, fillEma5 )
fill(p1, p2, fillEma9 )
fill(p2, p3, fillEma21)
fill(plot(showTrendCloud and periodTrendCloud != "New" and trendcloud != 0 and close > trendcloud ? trendcloud : na, "", color.green, 1, plot.style_linebr, editable=false), p0, color.new(color.green, 90))
fill(plot(showTrendCloud and periodTrendCloud != "New" and trendcloud != 0 and close < trendcloud ? trendcloud : na, "", color.red , 1, plot.style_linebr, editable=false), p0, color.new(color.red , 90))
fill(plot(hma, "", hma > hma[2] ? green : hma < hma[2] ? red : na, editable=false), plot(hma[2], "", hma > hma[2] ? green : hma < hma[2] ? red : na, editable=false), hma > hma[2] ? green : hma < hma[2] ? red : na)
// Alerts
f_crossed_over() =>
ret = false
for x = 0 to array.size(sr_up_level) > 0 ? array.size(sr_up_level) - 1 : na by 1
float mid = math.round_to_mintick((array.get(sr_up_level, x) + array.get(sr_dn_level, x)) / 2)
if close[1] <= mid and close > mid
ret := true
ret
ret
f_crossed_under() =>
ret = false
for x = 0 to array.size(sr_up_level) > 0 ? array.size(sr_up_level) - 1 : na by 1
float mid = math.round_to_mintick((array.get(sr_up_level, x) + array.get(sr_dn_level, x)) / 2)
if close[1] >= mid and close < mid
ret := true
ret
ret
f_sl_crossed() =>
ret = false
stop = enableTrailingSL ? trailingStop : stop_y
crossBull = low [1] >= stop[1] and low < stop[1] and ta.barssince(low [1] >= stop[1] and low < stop[1])[1] >= countBull - 1
crossBear = high[1] <= stop[1] and high > stop[1] and ta.barssince(high[1] <= stop[1] and high > stop[1])[1] >= countBear - 1
ret := trigger[1] ? crossBull : crossBear
f_tp_crossed(tp) =>
ret = false
profit = tp
crossBull = high[1] <= profit[1] and high > profit[1] and ta.barssince(high[1] <= profit[1] and high > profit[1])[1] >= countBull - 1
crossBear = low [1] >= profit[1] and low < profit[1] and ta.barssince(low [1] >= profit[1] and low < profit[1])[1] >= countBear - 1
ret := trigger[1] ? crossBull : crossBear
alert01 = (bull and close <= smartFilter) or (bear and close >= smartFilter)
alert02 = bull or bear
alert03 = (bull and close > smartFilter) or (bear and close < smartFilter)
alert04 = bull and close <= smartFilter
alert05 = f_crossed_over()
alert06 = bear and close >= smartFilter
alert07 = bull and close > smartFilter
alert08 = bear and close < smartFilter
alert09 = f_sl_crossed()
alert10 = f_crossed_under()
alert11 = f_tp_crossed(tp1_y)
alert12 = f_tp_crossed(tp2_y)
alert13 = f_tp_crossed(tp3_y)
alert14 = periodTrendCloud == "New" ? ta.crossunder(ema150, ema250) : (close < trendcloud) and (close > trendcloud)[1]
alert15 = periodTrendCloud == "New" ? ta.crossover (ema150, ema250) : (close > trendcloud) and (close < trendcloud)[1]
alerts(sym) =>
if alert01 or alert02 or alert03 or alert04 or alert05 or alert06 or alert07 or alert08 or alert09 or alert10 or alert11 or alert12 or alert13 or alert14 or alert15
alert("NEW ALERT", alert.freq_once_per_bar_close)
alerts(syminfo.tickerid)
alertcondition(alert01, "Any Signal Buy / sell", "Buy or Sell")
alertcondition(alert02, "Any signal Buy/Smart Buy or Sell/Smart Sell", "Buy/Smart Buy or Sell/Smart Sell")
alertcondition(alert03, "Any signal Smart Buy / Smart Sell", "Smart Buy or Smart Sell")
alertcondition(alert04, "Buy alert", "Buy")
alertcondition(alert05, "Resistance Broken", "Resistance Broken")
alertcondition(alert06, "Sell alert", "Sell")
alertcondition(alert07, "Smart Buy", "Smart Buy")
alertcondition(alert08, "Smart Sell", "Smart Sell")
alertcondition(alert09, "Stop loss", "Stop loss")
alertcondition(alert10, "Support Broken", "Support Broken")
alertcondition(alert11, "Target 1", "Target 1")
alertcondition(alert12, "Target 2", "Target 2")
alertcondition(alert13, "Target 3", "Target 3")
alertcondition(alert14, "Trend cloud Bearish Alert", "Trend cloud Bearish")
alertcondition(alert15, "Trend cloud Bullish Alert", "Trend cloud Bullish")
// Watermark
//text inputs
//symbol info
symInfoCheck = false
symInfo = syminfo.ticker + ' | ' + timeframe.period + (timeframe.isminutes ? 'M' : na)
date = str.tostring(dayofmonth(time_close)) + '/' + str.tostring(month(time_close)) + '/' + str.tostring(year(time_close))
//text positioning
textVPosition = 'middle'
textHPosition = 'center'
//symbol info positioning
symVPosition = 'top'
symHPosition = 'left'
//cell size
width = 0
height = 0
//title settings
c_title = color.new(color.orange, 0)
s_title = 'large'
a_title = 'center'
//subtitle settings
c_subtitle = color.new(color.orange, 50)
s_subtitle = 'normal'
a_subtitle = 'center'
//symbol settings
c_symInfo = color.new(color.orange, 50)
s_symInfo = 'normal'
a_symInfo = 'center'
c_bg = color.new(color.blue, 100)
🛠 How to Apply the ELITE SMART Indicator in TradingView
- Open TradingView and log in.
- Navigate to the Pine Script Editor at the bottom.
- Copy and paste the provided script code.
- Click Save, then name the script (e.g., “ELITE SMART Strategy”).
- Click Add to Chart to activate the indicator.
- Customize input settings based on your preferred trading style.
💡 Additional Trading Tips
- Combine with Volume Analysis:
Use alongside volume indicators to validate buy/sell signals and avoid weak trades. - Follow Trend Confirmation:
Always ensure alignment with higher timeframes before entering trades. - Optimize Stop-Loss Settings:
Adjust stop levels according to market volatility to minimize potential losses.
🎯 Final Thoughts
The ELITE SMART indicator offers a reliable and efficient trading solution by integrating smart signal generation, trend confirmation, and risk management features. Whether you’re a scalper or swing trader, this tool can enhance your decision-making process with minimal chart noise.
However, no indicator is foolproof—combining it with proper analysis and risk control is essential for long-term success.
Boost your trading confidence with ELITE SMART – the ultimate trading companion for strategic execution! 🚀
RELATED POSTS
View all
GG SH0T Trading Strategy: Comprehensive Multi-Signal Approach for Precision Trading
January 23, 2025 | by admin
TraderOracle Method v2.1: A Comprehensive Indicator for Smart Trading Decisions
January 21, 2025 | by admin
Master Market Liquidity with LiqD Liquidation Heatmap SB[ɅI]: A Game-Changer for Smart Trading Decisions
January 21, 2025 | by admin