Final 15 Strategy: A Comprehensive Trading System Combining Adaptive Indicators
January 21, 2025 | by admin
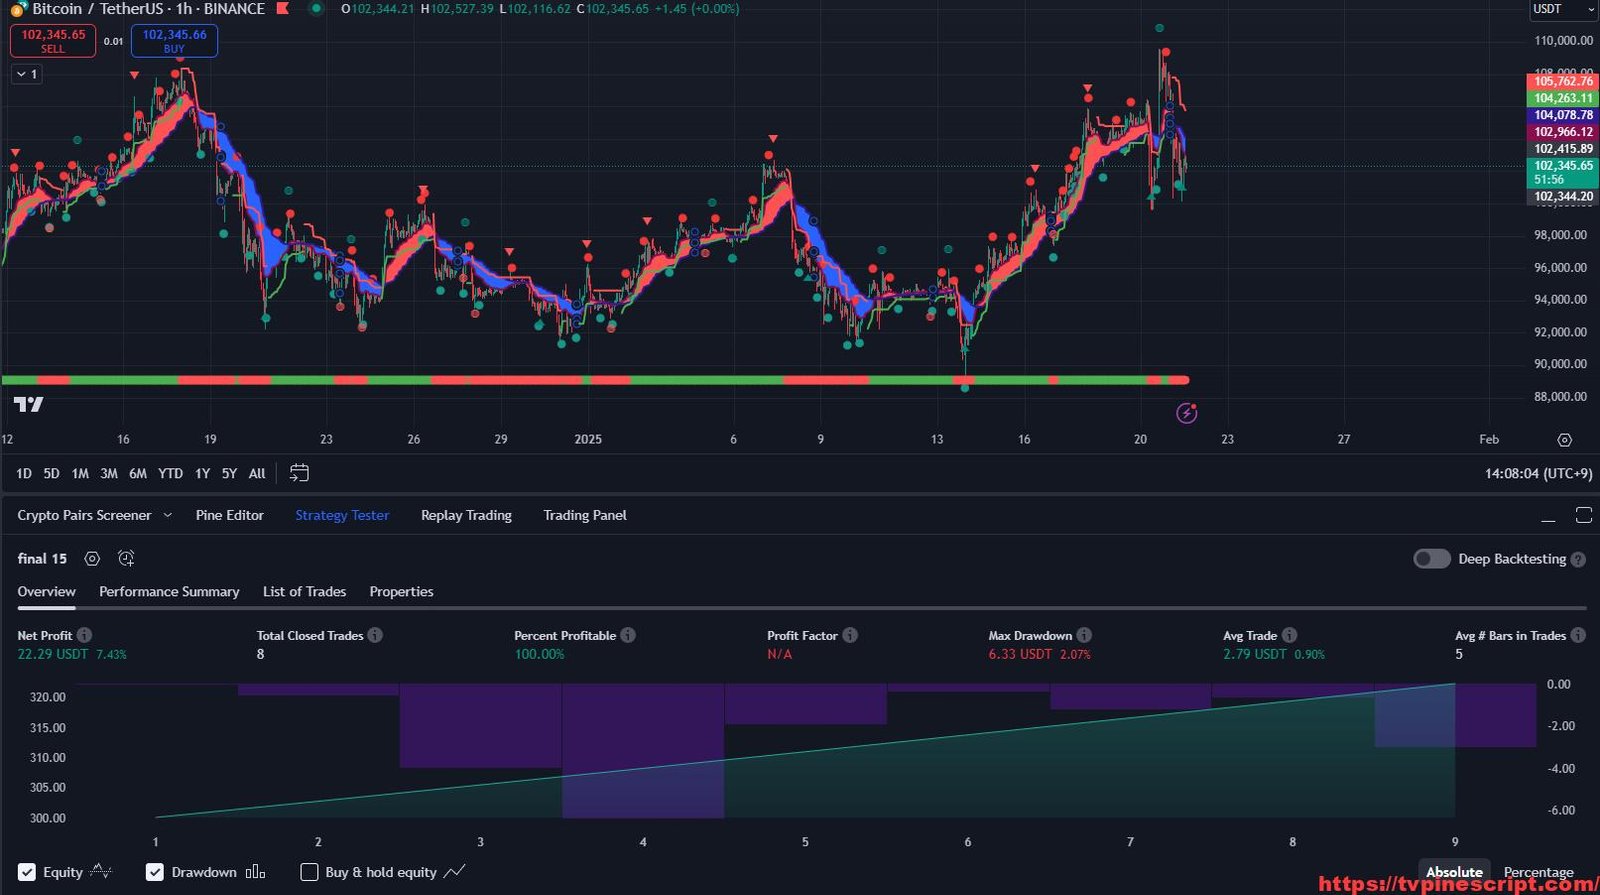
Successful trading requires a strategic approach that leverages multiple market indicators for precise entry and exit decisions. Final 15, a Pine Script-based strategy, offers traders a robust trading system incorporating advanced indicators such as cRSI, HTF MESA MA, ALMA, and MACD, along with built-in risk management features. This strategy aims to help traders capitalize on market movements effectively while minimizing risk.
However, it’s essential to remember that no trading indicator guarantees profits. Final 15 should be used as a guide within a well-structured trading plan that includes risk management and proper market analysis.
Key Features of the Script:
- Comprehensive Indicator Integration:
- Combines multiple indicators, including:
- cRSI (Cumulative RSI) for trend confirmation.
- HTF MESA MA (Adaptive Moving Average) for high-timeframe trend filtering.
- ALMA (Arnaud Legoux Moving Average) for smooth trend tracking.
- MACD for momentum analysis and trend validation.
- Combines multiple indicators, including:
- Automated Trade Execution:
- Implements an automated trading strategy using percentage-based position sizing, ensuring consistent risk allocation.
- Includes configurable commission settings to simulate real trading conditions.
- Advanced Stop-Loss and Take-Profit Mechanism:
- Customizable stop-loss (SL) and take-profit (TP) percentages, allowing traders to adapt risk-reward ratios to market conditions.
- Automatic trailing features based on ATR and MESA pivots.
- Multi-Timeframe Analysis (MTF):
- Supports trading decisions based on higher timeframes, improving accuracy by filtering noise from lower timeframes.
- The HTF MESA MA component allows trend alignment across multiple timeframes.
- Market Structure Recognition:
- Identifies key pivot highs and lows using MESA pivots, offering a dynamic support/resistance system.
- Plots potential breakout and reversal zones based on historical price action.
- Zigzag and Reversal Detection:
- Uses a zigzag pattern algorithm to identify key swing points and potential reversal areas.
- Provides visual alerts for bullish and bearish reversals.
- Dynamic Trend Filtering with ALMA and MACD:
- Filters false signals by aligning trades with trend direction confirmed by ALMA and MACD.
- Avoids trading against the primary market trend.
- Chandelier Exit Integration:
- Incorporates the Chandelier Exit system for dynamic stop placement.
- Can be used as an additional filter for trade entries and exits.
- Real-Time Alerts and Notifications:
- Alerts for buy and sell signals, as well as stop-loss triggers, ensuring traders never miss an opportunity.
- Push notifications for mobile trading convenience.
- User-Friendly Customization:
- Easily adjustable input parameters such as trade direction, timeframe, ATR settings, and commission values.
- Clean visual representation with trend color coding.
Recommended Usage:
- Scalping:
- Best suited for 5-minute to 15-minute charts.
- Use with ALMA and MACD filters for quick in-and-out trades.
- Day Trading:
- Effective on 30-minute to 1-hour charts.
- Combines MESA pivots and cRSI to find optimal entry points.
- Swing Trading:
- Recommended for 4-hour to daily charts.
- HTF MESA and Chandelier Exit help manage longer-term trades with precise stop levels.
- Risk Management Strategy:
- Leverage ATR-based stop-loss levels to avoid unnecessary risk.
- Utilize take-profit levels to lock in gains and avoid emotional decision-making.
Script Evaluation:
- Functionality: 4.8/5
A well-designed trading strategy with advanced indicator integration and automated execution. - Ease of Use: 4.3/5
The script includes extensive customization options, making it versatile but requiring some learning for beginners. - Accuracy: 4.6/5
Offers reliable trade signals when applied with trend-following principles and proper risk management. - Repainting Analysis:
This script does not repaint.
All calculations are based on confirmed bar data, ensuring accuracy during live trading and backtesting. - Optimal Timeframes:
- Scalping: 5-minute to 15-minute charts.
- Day Trading: 30-minute to 1-hour charts.
- Swing Trading: 4-hour to daily charts.
- Author and Development Quality:
The script appears well-coded with professional-level logic, although no specific author attribution is provided. - Overall Score: 4.7/5
A highly adaptable tool for traders looking to optimize entries and exits with advanced trend-following and risk management techniques.
// @version=5
strategy(" final 15", shorttitle="final 15 ", overlay=true,  pyramiding = 0, default_qty_type = strategy.percent_of_equity, default_qty_value = 100, commission_type = strategy.commission.percent, commission_value = 0.05, initial_capital = 300)

GROUP_GLOBAL_OPTIONS = "Global Options"
GROUP_TIME_LIMITED_BACKTESTS = "Time-Limit BackTests (0 = disable)"
GROUP_CRSI_OPTIONS = "cRSI Options"
GROUP_HTF_MESA_MA = "HTF Adaptive MESA MA Options"
GROUP_ALMA = "ALMA Trend Direction Options"
GROUP_MACD = "MACD Options"
GROUP_MESA = "MESA Pivots Options"

i_sl_perc = input(4, title="Stop Loss Percentage")
i_tp_perc = input.float(1, title="Take Profit Percentage") // Cambiamos 'var float' a 'input.float' para hacerlo más claro


SLPerc=i_sl_perc

TPPerc = i_tp_perc

i_use_crsi = input.bool( true, "Trade by cRSI", group = GROUP_CRSI_OPTIONS )
i_show_crsi = input.bool( true, "Show cRSI Pivots", group = GROUP_CRSI_OPTIONS )
i_i_len   = input( 21, "cRSI EMA period", group = GROUP_CRSI_OPTIONS )
i_src     = input.source( close, 'cRSI Source',  group = GROUP_CRSI_OPTIONS )
i_trade_trend_direction = input( true, "cRSI trade in trend direction only", group = GROUP_CRSI_OPTIONS )
i_trade_trend_direction_change_percent_cancel = input.float( 3, "cRSI price change (%) to cancel trade in trend direction", group = GROUP_CRSI_OPTIONS )

i_use_htf_mesa = input.bool( true, "Trade by HTF Adaptive MESA MA", group = GROUP_HTF_MESA_MA )
i_show_htf_mesa = input.bool(true, "Show HFT Adaptive MESA MA", group = GROUP_HTF_MESA_MA )
_tf = input.timeframe( '60', "HTF Adaptive MESA MA Resolution", group = GROUP_HTF_MESA_MA )

i_use_alma = input.bool( true, "Trade by ALMA Trend Direction", group = GROUP_ALMA )
i_show_alma = input.bool(true, "Show ALMA", group = GROUP_ALMA )
alma_len = input.int( 50, "Arnaud Legoux MA Length", minval = 1, group = GROUP_ALMA )
alma_offset = input.float( 2, "ALMA Offset", minval = 0.0001, group = GROUP_ALMA )
alma_sigma = input.int( 10, title="ALMA Sigma Value", minval = 1, group = GROUP_ALMA )

i_use_macd = input.bool( true, "Trade by MACD", group = GROUP_MACD )
macd_fast = input.int( 10, "MACD Fast Length", minval = 1, group = GROUP_MACD )
macd_slow = input.int( 25, "MACD Slow Length", minval = 1, group = GROUP_MACD )
macd_smooth = input.int( 10, "MACD Signal Smoothing", minval = 0, group = GROUP_MACD )

i_use_mesa = input.bool( true, "Trade by MESA Pivots", group = GROUP_MESA )
i_show_mesa = input.bool( true, "Show MESA Pivots", group = GROUP_MESA )
offsetNum = input( 0, "MESA offset", group = GROUP_MESA)
pivot_zone_upper = input.float( 0.4, "MESA pivot zone upper", step=0.1, group = GROUP_MESA )
pivot_zone_lower = input.float( -0.4, "MESA pivot zone lower", step=0.1, group = GROUP_MESA )
min_mesa_pivots_gap_minutes = input( 20, "MESA minimum pivots gap (minutes)", group = GROUP_MESA)


inDateRange = true

// Look if the close time of the current bar falls inside the date range

//------------------------------------------------------------------------------
// persisting variables
//------------------------------------------------------------------------------

var cRSI_high_extreme_found = 0.0
var cRSI_high_extreme_valid = true
var cRSI_low_extreme_found = 0.0
var cRSI_low_extreme_valid = true
var last_cRSI_extreme = ""
var last_pivot_ts = time
var last_trade_ts = time
var mesa_ma_trend_direction = ""
var alma_trend_direction = ""
var macd_trend_direction = ""
var min_trade_gap_minutes = 2

//------------------------------------------------------------------------------
// MESA calculations from the MESA indicator
//------------------------------------------------------------------------------
// Basic
//------------------------------------------------------------------------------

DomCycle = 15
RealPart = 0.0
ImagPart = 0.0

for J = 0 to DomCycle - 1
    Weight = (close[J] + close[J] + high[J] + low[J]) * 10000
    if DomCycle != 0
        RealPart := RealPart + math.cos(90 * J / DomCycle) * Weight * 2
        ImagPart := ((ImagPart + math.sin(90 * J / DomCycle) * Weight) + (ImagPart + math.sin(180 * J / DomCycle) * Weight)) / 2

Phase = ((math.atan(ImagPart / RealPart)) - 0.685) * 100

//------------------------------------------------------------------------------
//Pivot
//------------------------------------------------------------------------------

ph_mesa = ta.pivothigh(Phase, 1, 1)
pl_mesa = ta.pivotlow(Phase, 1, 1)

out_zone = Phase[2] < pivot_zone_lower or Phase[2] > pivot_zone_upper

plotshape(i_show_mesa and ph_mesa and out_zone ? ph_mesa : na, title = "Pivot High", color=#f23737, style = shape.circle, location = location.abovebar, offset = -1, size = size.tiny)
plotshape(i_show_mesa and pl_mesa and out_zone ? pl_mesa : na, title = "Pivot Low", color=#169788, style = shape.circle, location = location.belowbar, offset = -1, size = size.tiny)


//------------------------------------------------------------------------------
// MESA adaptive moving average indicator code
//------------------------------------------------------------------------------
tf1 = _tf == '0' ? timeframe.period : _tf
fast = 0.25
slow = 0.05

//Returns scalar difference between current timeframe and requested
ResolutionToMin(tf)=>
    mins = tf=="1M" ? 43830 : tf=="1W" ?   10080: tf=="1D" ?   1440 :tf=="240"?   240 :tf=="180"?   180 :tf=="120"?   120 :tf=="60"?    60  :tf=="45"?    45  :tf=="30"?    30  :tf=="15"?    15  :tf=="5"?     5   :tf=="3"?     3   :tf=="1"?     1   :   -1
    mins
chart_res = ResolutionToMin(timeframe.period)
if(timeframe.isdwm)
    chart_res := ResolutionToMin(str.tostring(timeframe.multiplier) + timeframe.period)
req_res = ResolutionToMin(_tf)
scale = req_res==-1 or chart_res==-1 or chart_res>req_res ? 1 : chart_res/req_res


//MESA Moving Average`
//Args: src - the series to perform MAMA calculations on
//      fast - limit to the fast moving average calc (default 0.5)
//      slow - limit to the slow moving average calc (default 0.05)
//      hide - for usage with multiple MESA plots. set to True to return [na,na]
//##############################################################################
getMESA(src_in, fast, slow, show) =>
    Price = src_in
    FastLimit = fast
    SlowLimit = slow
    MAMA = src_in
    FAMA = src_in
    PI = 3.14159
    Smooth = 0.0
    Detrender = 0.0
    I1 = 0.0
    Q1 = 0.0
    jI = 0.0
    jQ = 0.0
    I2 = 0.0
    Q2 = 0.0
    Re = 0.0
    Im = 0.0
    Period = 0.0
    SmoothPeriod = 0.0
    Phase = 0.0
    DeltaPhase = 0.0
    alpha = 0.0
    if(na(Price))
        MAMA := MAMA[1]
        FAMA := FAMA[1]
        Smooth := Smooth[1]
        Detrender := Detrender[1]
        I1 := I1[1]
        Q1 := Q1[1]
        I2 := I2[1]
        Q2 := Q2[1]
        Re := Re[1]
        Im := Im[1]
        Period := Period[1]
        SmoothPeriod := SmoothPeriod[1]
        Phase := Phase[1]

    if(bar_index > 5 and show and not na(Price))
        Smooth := (4 * Price + 3 * Price[1] + 2 * Price[2] + Price[3]) / 10
        Detrender := (0.0962 * Smooth + 0.5769 * Smooth[2] - 0.5769 * Smooth[4] - 0.0962 * Smooth[6]) *
           (0.075 * Period[1] + 0.54)
        //Get the Inphase & Quadtrature Components
        Q1 := (0.0962 * Detrender + 0.5769 * Detrender[2] - 0.5769 * Detrender[4] -
           0.0962 * Detrender[6]) * (0.075 * Period[1] + 0.54)
        I1 := Detrender[3]
        //Advance phase angle by 90 deg
        jI := (0.0962 * I1 + 0.5769 * I1[2] - 0.5769 * I1[4] - 0.0962 * I1[6]) *
           (0.075 * Period[1] + 0.54)
        jQ := (0.0962 * Q1 + 0.5769 * Q1[2] - 0.5769 * Q1[4] - 0.0962 * Q1[6]) *
           (0.075 * Period[1] + 0.54)
        //Phasor addition for 3-bar averaging
        I2 := I1 - jQ
        Q2 := Q1 + jI
        //Smooth the I and Q components before applying the discriminator
        I2 := 0.2 * I2 + 0.8 * I2[1]
        Q2 := 0.2 * Q2 + 0.8 * Q2[1]
        //Homodyne Discriminator
        Re := I2 * I2[1] + Q2 * Q2[1]
        Im := I2 * Q2[1] - Q2 * I2[1]
        Re := 0.2 * Re + 0.8 * Re[1]
        Im := 0.2 * Im + 0.8 * Im[1]
        if Im != 0 and Re != 0
            Period := 2 * PI / math.atan(Im / Re)
        Period := Period > 1.5 * Period[1] ? 1.5 * Period[1] : Period
        Period := Period > 50 ? 50 : Period
        Period := Period < 0.67 * Period[1] ? 0.67 * Period[1] : Period
        Period := Period < 6 ? 6 : Period
        Period := 0.2 * Period + 0.8 * Period[1]
        SmoothPeriod := 0.33 * Period + 0.67 * SmoothPeriod[1]
        if I1 != 0
            Phase := 180 / PI * math.atan(Q1 / I1)
        DeltaPhase := Phase[1] - Phase
        if DeltaPhase < 1
            DeltaPhase := 1
        alpha := FastLimit / DeltaPhase
        alpha := alpha < SlowLimit ? SlowLimit : alpha
        alpha := alpha > FastLimit ? FastLimit : alpha
        MAMA := alpha * Price + (1 - alpha) * MAMA[1]
        FAMA := 0.5 * alpha * MAMA + (1 - 0.5 * alpha) * FAMA[1]
    if(not show)
        MAMA := na
        FAMA := na
    [MAMA, FAMA]

[M_1, F_1] = getMESA(close, fast*scale, slow*scale, true)

//Simple function to grab the color of the fill given a Mama / Fama tuple
//Args : mama - the Mesa adaptive moving average
//       fama - the follower moving average (generated by prior)
//##############################################################################
fillColor(mama, fama, show) =>
    color_1 = color.new(color.white, 100)
    ret = show ? mama > fama ? color.red : color.blue : color_1
    ret
//##############################################################################

p_m_1 = plot(M_1, "MAMA on HTF Adaptive MESA", i_show_htf_mesa ? color.maroon : na, 2)
p_f_1 = plot(F_1, "FAMA on HTF Adaptive MESA", i_show_htf_mesa ? color.navy : na, 2)
fill_1 = fillColor(M_1, F_1, i_show_htf_mesa)
fill(p_m_1, p_f_1, fill_1, "Fill1")

if mesa_ma_trend_direction == "" or ta.cross( M_1, F_1 )
    if M_1 > F_1
        mesa_ma_trend_direction := "up"
    else
        mesa_ma_trend_direction := "down"


//------------------------------------------------------------------------------
// ALMA Trend Direction indicator code
//------------------------------------------------------------------------------
trendALMA = ta.alma(close, alma_len, alma_offset, alma_sigma)

if low > trendALMA
    alma_trend_direction := "up"
else
    alma_trend_direction := "down"

p0 = plot(i_show_alma ? trendALMA : na, color = color.new( color.black, 100 ))
p1 = plot(i_show_alma ? close : na, color=color.new( color.black, 100 ))
fill(p0, p1, color=low > trendALMA ? color.new( #00ff00, 82) : color.new( #c2185b, 81 ))

//------------------------------------------------------------------------------
// MACD
//------------------------------------------------------------------------------
if i_use_macd
    [ macdLine, signalLine, hist ] = ta.macd(close, macd_fast, macd_slow, macd_smooth)
    if macdLine > signalLine
        macd_trend_direction := "up"
    else
        macd_trend_direction := "down"

crsi       = 0.0
vibration  = 10
torque     = 0.618 / (vibration + 1)
phasingLag = (vibration - 1) / 0.618

rsi        = ta.rsi(i_src, i_i_len)
crsi      := torque * (2 * rsi - rsi[phasingLag]) + (1 - torque) * nz(crsi[1])

float osc = crsi
float ph = ta.highestbars(high, i_i_len) == 0 ? osc : na
float pl = ta.lowestbars(low,   i_i_len) == 0 ? osc : na

var int dir = 0
dir := ph and na(pl) ? 1 : pl and na(ph) ? -1 : dir

var max_array_size = 10
var arr_zz         = array.new_float(0)
older_zz           = array.copy(arr_zz)
dirchanged         = ta.change(dir)

add_to_zigzag(_id, float value, int bindex) =>
    array.unshift(_id, bindex)
    array.unshift(_id, value)
    if array.size(_id) > max_array_size
        array.pop(_id)
        array.pop(_id)

update_zigzag(_id, float value, int bindex, int dir) =>
    if array.size(_id) == 0
        add_to_zigzag(_id, value, bindex)
    else
        if dir == 1 and value > array.get(_id, 0) or dir == -1 and value < array.get(_id, 0)
            array.set(_id, 0, value)
            array.set(_id, 1, bindex)
        0.

if ph or pl
    if dirchanged
        add_to_zigzag(arr_zz, dir == 1 ? ph : pl, bar_index)
    else
        update_zigzag(arr_zz, dir == 1 ? ph : pl, bar_index, dir)

if array.size(arr_zz) >= 6
    // Variables
    var label label_zz = na

    // Bools for or
    bool bool_or_1 = array.get(arr_zz, 0) != array.get(older_zz, 0)
    bool bool_or_2 = array.get(arr_zz, 1) != array.get(older_zz, 1)

    // Bools for and
    bool bool_n_1 = array.get(arr_zz, 2) == array.get(older_zz, 2)
    bool bool_n_2 = array.get(arr_zz, 3) == array.get(older_zz, 3)

    // Bools for more than and less than
    bool bool_0_mt_4 = array.get(arr_zz, 0) > array.get(arr_zz, 4)
    bool bool_0_lt_4 = array.get(arr_zz, 0) < array.get(arr_zz, 4)

    if bool_or_1 or bool_or_2
        if bool_n_1 and bool_n_2
            label.delete(label_zz)
        str_label = dir == 1 ?   bool_0_mt_4 ? '▼'     : '◍' :
                                 bool_0_lt_4 ? '▲'     : '◍'
        col_label = dir == 1 ?   bool_0_mt_4 ? color.red  : color.teal :
                                 bool_0_lt_4 ? color.teal : color.red

        if i_show_crsi
            label_zz := label.new(bar_index, high, text = str_label, color = color.new(color.blue, 100), textcolor = col_label, style=dir == 1 ? label.style_label_down : label.style_label_up )

        if dir == 1
            cRSI_high_extreme_found := close
            cRSI_low_extreme_found := 0.0
            last_cRSI_extreme := "high"
        else
            cRSI_low_extreme_found := close
            cRSI_high_extreme_found := 0.0
            last_cRSI_extreme := "low"

        // if we found a cRSI extreme close any open trades here
        if i_use_crsi and cRSI_high_extreme_found > 0.0
            strategy.close( "Buy", comment = "close buy (cRSI)" )
        if i_use_crsi and cRSI_low_extreme_found > 0.0
            strategy.close( "Sell", comment = "close sell (cRSI)" )


// check that our last found high extreme is not more than i_trade_trend_direction_change_percent_cancel percent lower than our current price
// in which case we'll mark it as invalid, so we can keep on opening buy entries
if i_use_crsi and i_trade_trend_direction and cRSI_high_extreme_found > 0.0
    if cRSI_high_extreme_found != close
        extreme_distance_from_last_point_percent = ( ( cRSI_high_extreme_found - close ) / cRSI_high_extreme_found ) * 100
        cRSI_high_extreme_valid := close < cRSI_high_extreme_found or math.abs( extreme_distance_from_last_point_percent ) < i_trade_trend_direction_change_percent_cancel

    // reset the high extreme to current price if we found out that we're redrawing it further
    if not cRSI_high_extreme_valid
        cRSI_high_extreme_found := close
        cRSI_high_extreme_valid := false
else
    cRSI_high_extreme_valid := true


// check that our last found low extreme is not more than i_trade_trend_direction_change_percent_cancel percent higher than our current price
// in which case we'll mark it as invalid, so we can keep on opening sell entries
if i_use_crsi and i_trade_trend_direction and cRSI_low_extreme_found > 0.0
    if cRSI_low_extreme_found != close
        extreme_distance_from_last_point_percent = ( ( cRSI_low_extreme_found - close ) / cRSI_low_extreme_found ) * 100
        cRSI_low_extreme_valid := close > cRSI_low_extreme_found or math.abs( extreme_distance_from_last_point_percent ) < i_trade_trend_direction_change_percent_cancel

    // reset the high extreme to current price if we found out that we're redrawing it further
    if not cRSI_low_extreme_valid
        cRSI_low_extreme_found := close
        cRSI_low_extreme_valid := false
else
    cRSI_low_extreme_valid := true


//@version=5

// indicator('Chandelier Exit', shorttitle='CEBTC 1h', overlay=true)

ce(length,mult,useClose,tf_ce,sy_ce)=>
    atr = mult * ta.atr(length)

    longStop_ce = (useClose ? ta.highest(close, length) : ta.highest(length)) - atr
    longStopPrev = nz(longStop_ce[1], longStop_ce)

    shortStop_ce = (useClose ? ta.lowest(close, length) : ta.lowest(length)) + atr
    shortStopPrev = nz(shortStop_ce[1], shortStop_ce)

    var int dir_ce_ = 1
    dir_ce_ := close > shortStopPrev ? 1 : close < longStopPrev ? -1 : dir_ce_
    longStop_ce := close[1] > longStopPrev ? math.max(longStop_ce, longStopPrev) : longStop_ce
    shortStop_ce := close[1] < shortStopPrev ? math.min(shortStop_ce, shortStopPrev) : shortStop_ce

    [dir_ce,longStop,shortStop] = request.security(sy_ce,tf_ce,[dir_ce_,longStop_ce,shortStop_ce])
use_ce4 = input(true, "use as Filter for Entry",group = "Chandelier Exit for Another Symbol")
use_ce3 = input(true, "use as Filter for Reversal Entry",group = "Chandelier Exit for Another Symbol")
length = input(title='ATR Period', defval=14,group = "Chandelier Exit for Another Symbol")
mult = input.float(title='ATR Multiplier', step=0.1, defval=2.5,group = "Chandelier Exit for Another Symbol")
// showLabels = input(title='Show Buy/Sell Labels ?', defval=true,group = "Chandelier Exit for Another Symbol")
useClose = input(title='Use Close Price for Extremums ?', defval=true,group = "Chandelier Exit for Another Symbol")
// highlightState = input(title='Highlight State ?', defval=true,group = "Chandelier Exit for Another Symbol")

tf_ce = input.timeframe("60","Chandelier Exit Timeframe",group = "Chandelier Exit for Another Symbol")
sy_ce = input.symbol("BTC1!","Chandelier Exit Symbol",group = "Chandelier Exit for Another Symbol")

[dir_ce,longStop,shortStop] = ce(length,mult,useClose,tf_ce,sy_ce)
use_ce = input(false, "use as Filter for Entry",group = "Chandelier Exit")
use_ce1 = input(false, "use as Filter for Reversal Entry",group = "Chandelier Exit")
length_ = input(title='ATR Period', defval=14,group = "Chandelier Exit")
mult_ = input.float(title='ATR Multiplier', step=0.1, defval=2.5,group = "Chandelier Exit")
// showLabels_ = input(title='Show Buy/Sell Labels ?', defval=true,group = "Chandelier Exit")
useClose_ = input(title='Use Close Price for Extremums ?', defval=true,group = "Chandelier Exit")
// highlightState_ = input(title='Highlight State ?', defval=true,group = "Chandelier Exit")

tf_ce_ = input.timeframe("60","Chandelier Exit Timeframe",group = "Chandelier Exit")
sy_ce_ = syminfo.tickerid// input.symbol("BTC1!","Chandelier Exit Symbol",group = "Chandelier Exit")

[dir_ce_,longStop_,shortStop_] = ce(length_,mult_,useClose_,tf_ce_,sy_ce_)


// MESA pivot high was found
if ( not i_use_mesa or ( ph_mesa and out_zone ) ? ph_mesa : na )
    // close trade if a cRSI extreme was previously found, otherwise let the cRSI close the trade once it gets there
    if not i_use_crsi or ( cRSI_high_extreme_found > 0.0 and cRSI_high_extreme_valid )
        strategy.close( "Buy", comment = "close buy (" + ( i_use_mesa ? "MESA" : i_use_crsi ? "cRSI" : i_use_htf_mesa ? "HTF MESA" : "unknown" ) + ")" )
        // open a counter-strategy, if:
        //   1) we're not too close to the last trade's TS
        //   2) we're in the correct cRSI trend (if enabled)
        //   3) we're in the correct MESA HTF MA trend (if enabled)
        //   4) we're in the correct ALMA trend (if enabled)
        //   5) we're in the correct MACD trend (if enabled)
        if ( inDateRange and ( ( time - last_trade_ts ) / 1000 >= ( 60 * min_trade_gap_minutes ) ) and ( not i_use_crsi or last_cRSI_extreme == "high" ) and ( not i_use_mesa or ( i_use_mesa and ( time - last_pivot_ts ) / 1000 >= ( 60 * min_mesa_pivots_gap_minutes ) ) ) and ( not i_use_crsi or not i_trade_trend_direction or last_cRSI_extreme == "high" ) and ( not i_use_htf_mesa or mesa_ma_trend_direction == "down" ) and ( not i_use_alma or alma_trend_direction == "down" ) and ( not i_use_macd or macd_trend_direction == "down" ) and ( strategy.opentrades == 0 or strategy.opentrades.entry_id( strategy.opentrades - 1 ) != "Sell" ) )  and (use_ce ? dir_ce_==-1 : true)  and (use_ce4?dir_ce==-1:true)
            stopPrice = close + ( ( SLPerc / 100 ) * close )
            takeProfitPrice = close - ((i_tp_perc / 100) * close) // Nuevo cálculo del Take Profit

            strategy.entry( "Sell", strategy.short, comment = "Sell (SL = " + str.tostring( stopPrice ) + ")" )
            //strategy.exit( "Sell", stop = stopPrice, comment = "closed by SL " + str.tostring(SLPerc) + "%" )
            strategy.exit("Sell", stop=stopPrice, limit=takeProfitPrice, comment="SL " + str.tostring(SLPerc) + "%, TP " + str.tostring(i_tp_perc) + "%") // Línea corregida, orden de salida con Stop Loss y Take Profit

            cRSI_low_extreme_found := 0.0
            last_trade_ts := time
    last_pivot_ts := time

// MESA pivot low was found
if ( not i_use_mesa or ( pl_mesa and out_zone ) ? pl_mesa : na )
    // close trade if a cRSI extreme was previously found, otherwise let the cRSI close the trade once it gets there
    if not i_use_crsi or ( cRSI_low_extreme_found > 0.0 and cRSI_low_extreme_valid )
        strategy.close( "Sell", comment = "close sell (" + ( i_use_mesa ? "MESA" : i_use_crsi ? "cRSI" : i_use_htf_mesa ? "HTF MESA" : "unknown" ) + ")" )
        // open a counter-strategy, if:
        //   1) we're not too close to the last trade's TS
        //   2) we're in the correct cRSI trend (if enabled)
        //   3) we're in the correct MESA HTF MA trend (if enabled)
        //   4) we're in the correct ALMA trend (if enabled)
        //   5) we're in the correct MACD trend (if enabled)
        if ( inDateRange and ( ( time - last_trade_ts ) / 1000 >= ( 60 * min_trade_gap_minutes ) ) and ( not i_use_crsi or last_cRSI_extreme == "low" ) and ( not i_use_mesa or ( i_use_mesa and ( time - last_pivot_ts ) / 1000 >= ( 60 * min_mesa_pivots_gap_minutes ) ) ) and ( not i_use_crsi or not i_trade_trend_direction or last_cRSI_extreme == "low"  ) and ( not i_use_htf_mesa or mesa_ma_trend_direction == "up" ) and ( not i_use_alma or alma_trend_direction == "up" ) and ( not i_use_macd or macd_trend_direction == "down" )  and ( strategy.opentrades == 0 or strategy.opentrades.entry_id( strategy.opentrades - 1 ) != "Buy" ) ) and (use_ce ? dir_ce_==1 : true)  and (use_ce4?dir_ce==1:true)
            stopPrice = close - ( ( SLPerc / 100 ) * close )
            // strategy.entry("Buy", strategy.long, comment = "close: " + str.tostring(close) + ", sl: " + str.tostring(stopPrice) )
            strategy.entry( "Buy", strategy.long, comment = "Buy" )
            strategy.exit( "Buy", stop = stopPrice, comment = "closed by SL " + str.tostring(SLPerc) + "%" )
            cRSI_high_extreme_found := 0.0
            last_trade_ts := time
    last_pivot_ts := time


// Exit open market position when date range ends
if (not inDateRange)
    strategy.close_all()


use_strategy = input(true, "Used Reverse")


// Establecer precio de entrada original de la operación que dio perdida
entry_price = strategy.closedtrades.entry_price(strategy.closedtrades - 1)
// Look if the strategy closed a trade
tradeClosed = strategy.closedtrades > strategy.closedtrades[1]

last_trade_profit = strategy.closedtrades.profit(strategy.closedtrades - 1)

// When the strategy closed a trade whose entry contains 'SMA',
// draw a label with that entry's result on the chart
is_pos_closed = (strategy.position_size[1] != 0 and strategy.position_size == 0) or ((strategy.position_size[1] * strategy.position_size) < 0)
is_long = strategy.position_size > 0
is_short = strategy.position_size < 0
was_long = is_pos_closed and is_long[1]
was_short = is_pos_closed and is_short[1]


var color longColor = color.green
var color shortColor = color.red

// buySignal = dir_ce == 1 and dir_ce[1]==-1
// sellSignal = dir_ce == -1 and dir_ce[1]==1
// longFillColor = highlightState ? dir_ce==1 ? longColor : na : na
// shortFillColor = highlightState ? dir_ce==-1 ? shortColor : na : na
// changeCond = dir_ce != dir_ce[1]


// buySignal_ = dir_ce_ == 1 and dir_ce_[1]==-1
// sellSignal_ = dir_ce_ == -1 and dir_ce_[1]==1
// longFillColor_ = highlightState_ ? dir_ce_==1 ? longColor : na : na
// shortFillColor_ = highlightState_ ? dir_ce_==-1 ? shortColor : na : na
// changeCond_ = dir_ce_ != dir_ce_[1]

longStopPlot = plot(dir_ce_==1 ? longStop_ : na, title='Long Stop', style=plot.style_linebr, linewidth=2, color=color.new(longColor, 0))
// //plotshape(buySignal ? longStop : na, title="Long Stop Start", location=location.absolute, style=shape.circle, size=size.tiny, color=longColor, transp=0)
plotshape(dir_ce==1, title='Buy Trend in Another Chart', text='', location=location.bottom, style=shape.circle, size=size.tiny, color=color.new(longColor, 0), textcolor=color.new(color.white, 0))

shortStopPlot = plot(dir_ce_==1 ? na : shortStop_, title='Short Stop', style=plot.style_linebr, linewidth=2, color=color.new(shortColor, 0))
// plotshape(sellSignal ? shortStop : na, title='Short Stop Start', location=location.absolute, style=shape.circle, size=size.tiny, color=color.new(shortColor, 0))
plotshape(dir_ce==-1, title="Sell Trend in Another Chart", text="", location=location.bottom, style=shape.circle, size=size.tiny, color=shortColor, textcolor=color.white)

// midPricePlot = plot(ohlc4, title='', style=plot.style_circles, linewidth=0, display=display.none, editable=false)

// fill(midPricePlot, longStopPlot, title='Long State Filling', color=color.new(longFillColor, transp=90))
// fill(midPricePlot, shortStopPlot, title='Short State Filling', color=color.new(shortFillColor, transp=90))

// alertcondition(changeCond, title='Alert: CE dir_ceection Change', message='Chandelier Exit has changed dir_ceection!')
// alertcondition(buySignal, title='Alert: CE Buy', message='Chandelier Exit Buy!')
// alertcondition(sellSignal, title='Alert: CE Sell', message='Chandelier Exit Sell!')


sl = input(27, "Stoploss %", group="SL")/100
tp = input(9, "Take Profit %", group="TP/SL")/100

var lsl = 0.0
var ssl = 0.0
var ltp = 0.0
var stp = 0.0

if tradeClosed  and  last_trade_profit < -0.25  and was_short and (use_ce3?dir_ce==-1:true)  and (use_ce1 ? dir_ce_==-1 : true) and use_strategy
    labelText = str.format("SHORTLOSER: {0}",
         strategy.closedtrades.profit(strategy.closedtrades - 1))
    label.new(bar_index, high, labelText, color=color.black,
         textcolor=color.white)
    strategy.entry("SHORTLOSER", strategy.short)
    ssl := close+(close*sl)
    stp := entry_price-(entry_price*tp)
    strategy.exit("SHORTLOSER", stop=ssl ,limit=stp)

if tradeClosed  and  last_trade_profit < -0.25  and was_long and (use_ce3?dir_ce==1:true)  and (use_ce1 ? dir_ce_==1 : true) and use_strategy
    labelText = str.format("LONGLOSER: {0}",
         strategy.closedtrades.profit(strategy.closedtrades - 1))
    label.new(bar_index, high, labelText, color=color.black,
         textcolor=color.white)
    lsl := close-(close*sl)
    ltp := entry_price+(entry_price*tp)
    strategy.entry("LONGLOSER", strategy.long)
    strategy.exit("LONGLOSER",stop=lsl, limit=ltp)
How to Apply Pine Script in TradingView:
- Open TradingView and log in.
- Navigate to the Pine Script Editor at the bottom of the screen.
- Copy and paste the provided script code.
- Click Save, then name the script (e.g., “Final 15 Strategy”).
- Click Add to Chart to apply it.
- Customize parameters to align with your trading strategy.
Additional Trading Tips:
- Combine with Volume Analysis:
Use this strategy alongside volume-based indicators such as OBV or VWAP to confirm trade entries. - Backtest Thoroughly:
Conduct extensive backtesting with different settings to understand the performance across various market conditions. - Avoid Over-Optimization:
Focus on realistic parameter settings that align with current market conditions instead of curve-fitting past data.
Final Thoughts:
The Final 15 Strategy is a versatile trading tool that integrates multiple indicators to provide comprehensive market analysis. Its ability to analyze trends, manage risk, and execute trades makes it suitable for traders across different timeframes.
However, always remember that no strategy guarantees success, and trading should be approached with proper risk management and a disciplined mindset.
RELATED POSTS
View all
GG SH0T Trading Strategy: Comprehensive Multi-Signal Approach for Precision Trading
January 23, 2025 | by admin
Matrix Oscillator: Precision Market Analysis with Divergence Detection
January 23, 2025 | by admin
Bay and Selly Sessions: Comprehensive Session-Based Strategy with Heikin Ashi Insights
January 3, 2025 | by admin