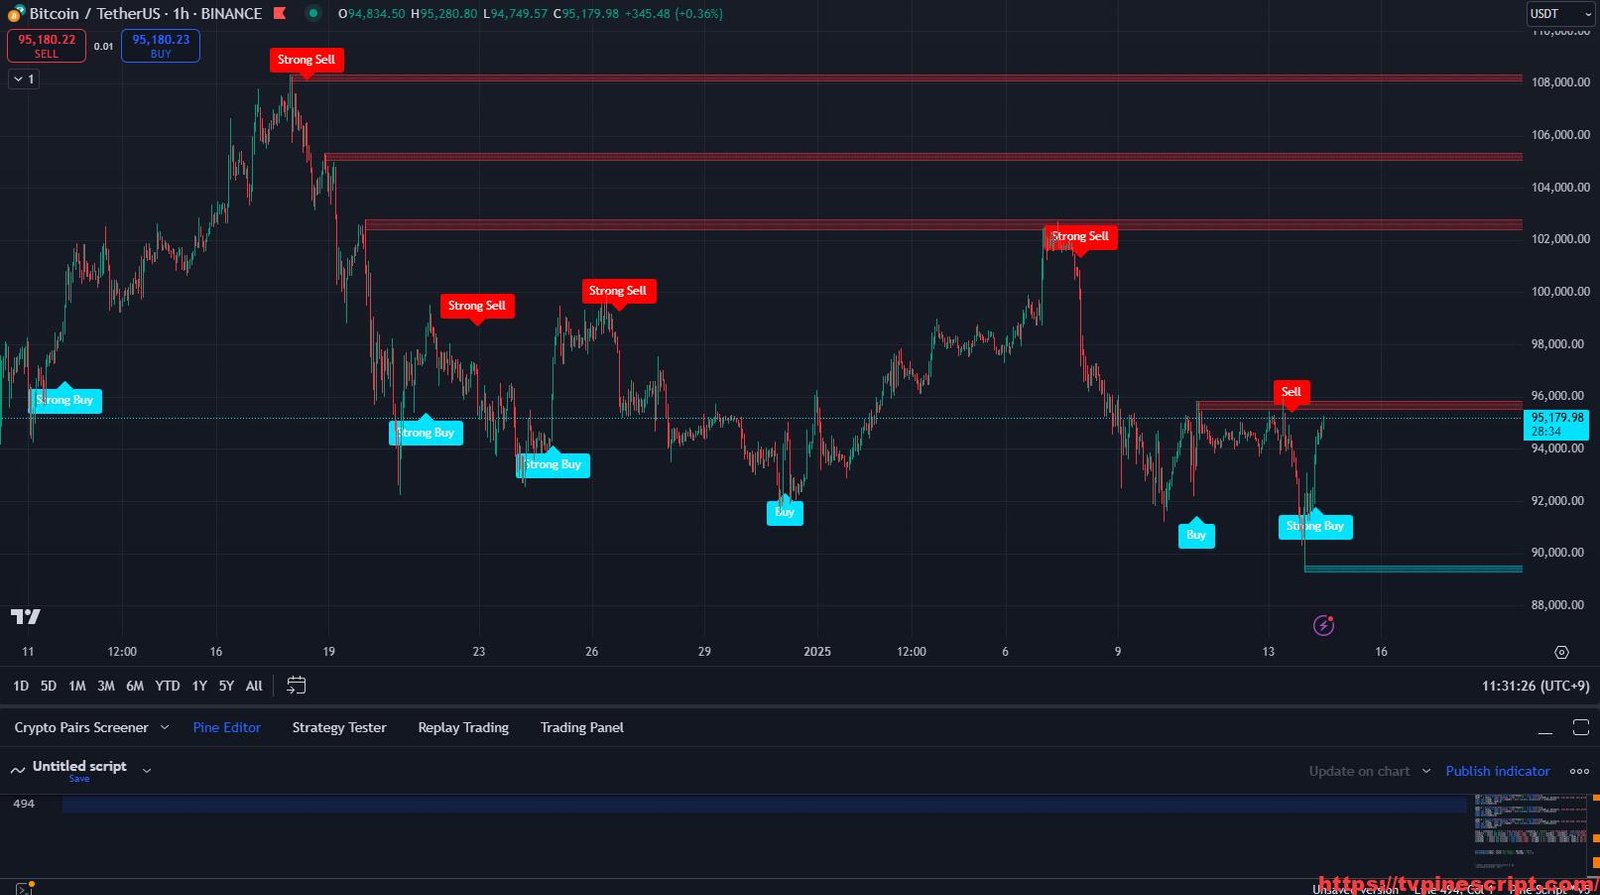
Frost Algo v3.0 : Advanced Multi-Indicator Trading System with Dynamic Risk Management
January 14, 2025 | by admin
Key Features of the Script:
- Dynamic Buy/Sell Signal Generation:
- Generates actionable Buy (“Strong Buy”) and Sell (“Strong Sell”) signals based on Supertrend and SMA crossovers.
- Customizable sensitivity for adjusting signal responsiveness to market conditions.
- Comprehensive Trend Analysis:
- Includes multiple trend-following features, such as Trend Cloud, Comulus Cloud, and Cirrus Cloud.
- Trend visualization tools highlight bullish and bearish market phases with color-coded overlays.
- Risk Management Tools:
- Implements ATR-based stop-loss and multi-level take-profit (1:1, 2:1, 3:1) calculations.
- Displays risk management levels directly on the chart with customizable labels and lines.
- Support and Resistance Levels:
- Plots dynamic support and resistance zones based on pivot highs and lows.
- Highlights unmitigated and mitigated demand/supply zones with visual extensions for better trade planning.
- ADX-Based Sideways Market Detection:
- Uses ADX to identify sideways markets and changes bar colors for easy visualization.
- Helps traders avoid low-volatility ranges and focus on trending conditions.
- Trend Clouds and Moving Averages:
- Features EMAs, SMAs, and advanced trend visualization (e.g., Hull MA) for market direction tracking.
- Includes filters to display bars and clouds based on specific conditions.
- Real-Time Alerts:
- Alerts for buy/sell signals, support/resistance zone interactions, and breakout conditions.
- Configurable notifications ensure timely updates during live trading.
- Customizable Visuals:
- Offers extensive options for adjusting trend cloud opacity, bar colors, line styles, and label positions.
- Supports personalized chart setups for enhanced readability.
Recommended Usage:
- Scalping:
- Best suited for 5-minute to 15-minute charts.
- Use Supertrend and demand/supply zone breakouts for rapid trade setups.
- Swing Trading:
- Effective on 1-hour to 4-hour charts.
- Combine trend clouds, ADX, and ATR stop-loss levels to identify and manage longer-term trades.
- Risk Management:
- Utilize ATR-based stop-loss and take-profit calculations to maintain disciplined trading.
- Monitor support/resistance levels and unmitigated zones for precise entry and exit points.
- Trend Following:
- Leverage color-coded trend clouds and EMA/SMA crossovers to confirm market direction.
- Use ADX for filtering trades during trending or sideways conditions.
Script Evaluation:
- Functionality: 4.8/5
The script integrates a diverse range of tools for trend detection, risk management, and signal generation, catering to various trading styles. - Ease of Use: 4.2/5
While feature-rich, the script requires a learning curve for beginners. A user guide would improve accessibility. - Accuracy: 4.7/5
Reliable signals for trend-following and breakout setups when properly configured. - Repainting Analysis:
This script does not repaint. All calculations are based on confirmed bar data, ensuring consistency and reliability for both backtesting and live trading. - Optimal Timeframes:
- Scalping: 5-minute to 15-minute charts.
- Swing Trading: 1-hour to 4-hour charts.
- Author and Development Quality:
The author is unnamed, but the script demonstrates a deep understanding of trading strategies and Pine Script development. Slight optimization could enhance responsiveness in high-frequency markets. - Overall Score: 4.7/5
A robust tool designed for traders seeking advanced signal generation, trend analysis, and dynamic risk management.
//@version=5
indicator("Frost Algo Version 3.0", overlay = true)

// Get user input
nbuysell   = input.bool(true, 'Buy/Sell Signal', inline = "BSNM",group='BUY/SELL SIGNAL')
nsensitivity = input.float(defval=2, title="-", inline = "BSNM", minval=1, maxval=20, group='BUY/SELL SIGNAL')

//candlecolor   = input.bool(true, 'Buy/Sell Signal', inline = "BSNM",group='BUY/SELL SIGNAL')


// Trend Features
LongTrendAverage  = input(false, 'Trend Cloud', group='TREND FEATURES')
TrendFollower     = input(false, 'Trend Follower', group='TREND FEATURES')
ShowComulus       = input(false, 'Comulus Cloud', group='TREND FEATURES')
CirrusCloud       = input(false, 'Cirrus Cloud', group='TREND FEATURES')


// Risk Management

levels      = input.bool(false, "Show TP/SL Levels" , group = "Risk Management" , inline = "MMDB2")
lvlLines    = input.bool(false, "Show Lines ", inline="levels", group = "Risk Management")
linesStyle  = input.string("SOLID", "", ["SOLID", "DASHED", "DOTTED"], inline="levels", group = "Risk Management")
lvlDistance = input.int(1, "Distance", 1, inline="levels2", group = "Risk Management")
lvlDecimals = input.int(2, "   Decimals", 1, 8, inline="levels2", group = "Risk Management")
atrRisk     = input.int(1, "Risk % ", 1, group = "Risk Management" , inline="levels3")
atrLen      = input.int(14, "  ATR Length", 1, group = "Risk Management" , inline="levels3")
decimals  = lvlDecimals == 1 ? "#.#" : lvlDecimals == 2 ? "#.##" : lvlDecimals == 3 ? "#.###" : lvlDecimals == 4 ? "#.####" : lvlDecimals == 5 ? "#.#####" : lvlDecimals == 6 ? "#.######" : lvlDecimals == 7 ? "#.#######" : "#.########"


// Input settings
history_of_demand_to_keep = 20
show_zigzag = false
show_price_action_labels = false
showsr = input(true, title="Show Support & Resistance", group = 'Support & Resistance')
swing_length = input.int(defval=8, title="Sensitivity", group = 'Support & Resistance')
box_width = input.float(defval=4, title="Zone Width", group = 'Support & Resistance')
box_extend_option = input.string("Right", title="Extend Box", options=["Right", "Both"], group = 'Support & Resistance')
res = input.timeframe(title='Time Frame', defval='', group="Support & Resistance")
s1 = request.security(syminfo.tickerid, res, showsr, gaps=barmerge.gaps_on)
demand_color = input.color(color.rgb(0,188,212,70), title = 'Support & Resistance Color', group = 'Support & Resistance')
supply_color = input.color(color.rgb(178,40,51,70), title = '', group = 'Support & Resistance')


// Signal Generation
supertrend(_close, factor, atrLen) =>
	atr = ta.atr(atrLen)
	upperBand = _close + factor * atr
	lowerBand = _close - factor * atr
	prevLowerBand = nz(lowerBand[1])
	prevUpperBand = nz(upperBand[1])
	lowerBand := lowerBand > prevLowerBand or close[1] < prevLowerBand ? lowerBand : prevLowerBand
	upperBand := upperBand < prevUpperBand or close[1] > prevUpperBand ? upperBand : prevUpperBand
	int direction = na
	float superTrend = na
	prevSuperTrend = superTrend[1]
	if na(atr[1])
		direction := 1
	else if prevSuperTrend == prevUpperBand
		direction := close > upperBand ? -1 : 1
	else
		direction := close < lowerBand ? 1 : -1
	superTrend := direction == -1 ? lowerBand : upperBand
	[superTrend, direction]


// SMA
ocAvg       = math.avg(open, close)
sma4        = ta.sma(close, 8)
sma5        = ta.sma(close, 9)
sma9        = ta.sma(close, 13)
psar        = ta.sar(0.02, 0.02, 0.2)

//*in Easy Words Super Trend + SMA = Signals
[supertrend, direction] = supertrend(close, nsensitivity*2, 11)


source = close, period = 150

// Colors
green       = #2BBC4D, green2   = #00DD00
red         = #C51D0B, red2     = #DD0000

adxlen = 15
dilen = 15
dirmov(len) =>
    up = ta.change(high)
    down = -ta.change(low)
    plusDM = na(up) ? na : up > down and up > 0 ? up : 0
    minusDM = na(down) ? na : down > up and down > 0 ? down : 0
    truerange = ta.rma(ta.tr, len)
    plus = fixnan(100 * ta.rma(plusDM, len) / truerange)
    minus = fixnan(100 * ta.rma(minusDM, len) / truerange)
    [plus, minus]
adx(dilen, adxlen) =>
    [plus, minus] = dirmov(dilen)
    sum = plus + minus
    adx = 100 * ta.rma(math.abs(plus - minus) / (sum == 0 ? 1 : sum), adxlen)
    adx
sig = adx(dilen, adxlen)

// range ADX threshold
sidewaysThreshold = input.int(title='ADX Sideways Threshold (10-30)', minval=2, defval=15)

// boolean expression to see if the ADX is below tehe sideways threshold
bool isSideways = sig < sidewaysThreshold


// adding the option to color the bars when in a trading range
useBarColor = true
bColor = isSideways ? color.new(#4b148d, 0) : na
barcolor(useBarColor ? bColor : na)


barcolor(close > supertrend ? #00e2ff : #fe0100)


// High Lows
y1 = low - (ta.atr(30) * 2), y1B = low - ta.atr(30)
y2 = high + (ta.atr(30) * 2), y2B = high + ta.atr(30)

bull = ta.crossover(close, supertrend) and close >= sma9
bear = ta.crossunder(close, supertrend) and close <= sma9


// Plots

windowsize = 100
offset = 0.9
sigma = 6
//plot(ta.alma(source, windowsize, offset, sigma))


windowsize2 = 310
offset2 = 0.85
sigma2 = 32
//plot(ta.alma(source, windowsize2, offset2, sigma2))


// Chart Features

smoothrng(x, t, m) =>
    wper  = t * 2 - 1
    avrng = ta.ema(math.abs(x - x[1]), t)
    smoothrng = ta.ema(avrng, wper) * m
    smoothrng
smrng     = smoothrng(close, 22, 6)

rngfilt(x, r) =>
    rngfilt = x
    rngfilt := x > nz(rngfilt[1]) ? x - r < nz(rngfilt[1]) ? nz(rngfilt[1]) : x - r : x + r > nz(rngfilt[1]) ? nz(rngfilt[1]) : x + r
    rngfilt
filt = rngfilt(close, smrng)

// ▒▒▒▒▒▒▒▒▒▒▒▒▒▒▒▒▒▒▒▒▒▒▒▒▒▒▒▒▒▒▒▒▒▒▒▒▒▒▒▒▒▒▒▒▒▒▒▒▒▒▒▒▒▒▒▒▒▒▒▒▒▒▒▒▒▒▒▒▒▒▒▒▒▒▒▒▒▒▒▒▒▒▒▒▒▒▒▒▒▒▒▒▒▒▒▒▒▒▒▒▒▒▒▒▒▒▒▒▒▒▒▒▒▒

upward = 0.0
upward := filt > filt[1] ? nz(upward[1]) + 1 : filt < filt[1] ? 0 : nz(upward[1])
downward = 0.0
downward := filt < filt[1] ? nz(downward[1]) + 1 : filt > filt[1] ? 0 : nz(downward[1])


filtcolor = upward > 0 ? color.new(#00e2ff, 50) : downward > 0 ? color.new(#fe0100, 50) : color.new(#56328f, 0)

plot(TrendFollower ? filt : na, color=filtcolor, linewidth=1, title='Trend Tracer')

// Trend Cloud
tclength = 600
hullma = ta.wma(2*ta.wma(close, tclength/2)-ta.wma(close, tclength), math.floor(math.sqrt(tclength)))
plot(LongTrendAverage ? hullma : na, 'Trend Cloud', linewidth=4, color=close[8] > hullma ? color.new(#00e2ff, 65) : color.new(#fe0100, 65))

// Comulus Cloud
candle  = ta.alma(source, windowsize2, offset2, sigma2)
reach   = ta.alma(source, windowsize, offset, sigma)
candlep = plot(ShowComulus ? candle : na, color=color.new(color.white, 100))
reachp  = plot(ShowComulus ? reach  : na, color=color.new(color.white, 100))
fill(reachp, candlep, color= candle > reach ? color.new(#fe0100, 85) : color.new(#00e2ff, 85))

// Chart Features

x1 = 22
x2 = 9

x3 = 15
x4 = 5


smoothrngX1(x, t, m) =>
    wper  = t * 2 - 1
    avrng = ta.ema(math.abs(x - x[1]), t)
    smoothrngX1 = ta.ema(avrng, wper) * m
    smoothrngX1
smrngx1x     = smoothrngX1(close, x1, x2)
smrngx1x2     = smoothrngX1(close, x3, x4)

rngfiltx1x1(x, r) =>
    rngfiltx1x1 = x
    rngfiltx1x1 := x > nz(rngfiltx1x1[1]) ? x - r < nz(rngfiltx1x1[1]) ? nz(rngfiltx1x1[1]) : x - r : x + r > nz(rngfiltx1x1[1]) ? nz(rngfiltx1x1[1]) : x + r
    rngfiltx1x1
filtx1 = rngfiltx1x1(close, smrngx1x)
filtx12 = rngfiltx1x1(close, smrngx1x2)

// ▒▒▒▒▒▒▒▒▒▒▒▒▒▒▒▒▒▒▒▒▒▒▒▒▒▒▒▒▒▒▒▒▒▒▒▒▒▒▒▒▒▒▒▒▒▒▒▒▒▒▒▒▒▒▒▒▒▒▒▒▒▒▒▒▒▒▒▒▒▒▒▒▒▒▒▒▒▒▒▒▒▒▒▒▒▒▒▒▒▒▒▒▒▒▒▒▒▒▒▒▒▒▒▒▒▒▒▒▒▒▒▒▒▒

upwardx1 = 0.0
upwardx1 := filtx1 > filtx1[1] ? nz(upwardx1[1]) + 1 : filtx1 < filtx1[1] ? 0 : nz(upwardx1[1])
downwardx1 = 0.0
downwardx1 := filtx1 < filtx1[1] ? nz(downwardx1[1]) + 1 : filtx1 > filtx1[1] ? 0 : nz(downwardx1[1])


filtx1colorx1 = color.rgb(0, 187, 212, 100)
xxx1 = plot(CirrusCloud ? filtx1 : na, color=filtx1colorx1, linewidth=1, title='Trend Tracer', editable = false)
xxx2 = plot(CirrusCloud ? filtx12 : na, color=filtx1colorx1, linewidth=1, title='Trend Tracer', editable = false)

fill(xxx1, xxx2, color= filtx1 > filtx12 ? color.new(#fe0100, 65) : color.new(#00e2ff, 65))


buy  =  bull and nbuysell ? label.new(bar_index, y1, sma4 >= sma5 ? "Strong Buy" : "Buy", xloc.bar_index, yloc.price, #00e2ff, label.style_label_up, color.white, size.normal) : na
sell =  bear and nbuysell ? label.new(bar_index, y2, sma4 <= sma5 ? "Strong Sell" : "Sell", xloc.bar_index, yloc.price, #fe0100, label.style_label_down, color.white, size.normal) : na


// Other initializations
avg_volume = ta.sma(volume, 20)
very_weak_multiplier = 0.5
weak_multiplier = 1
strong_multiplier = 1.5


// Rejection handling
var int[] demandRejections = array.new_int(history_of_demand_to_keep, 0)
var int[] supplyRejections = array.new_int(history_of_demand_to_keep, 0)
var int[] demandCreationBars = array.new_int(history_of_demand_to_keep, na)
var int[] supplyCreationBars = array.new_int(history_of_demand_to_keep, na)

var box[] current_demand_box = array.new_box(history_of_demand_to_keep, na)
var box[] current_supply_box = array.new_box(history_of_demand_to_keep, na)


f_check_demand_rejections() =>
    for i = 0 to history_of_demand_to_keep - 1
        if not na(array.get(demandCreationBars, i))
            if bar_index - array.get(demandCreationBars, i) > 15 and bar_index - array.get(demandCreationBars, i) % 15 == 0
                label.new(bar_index, high, "Checking demand rejection", color=color.red)
                dBox = array.get(current_demand_box, i)
                if (na(dBox))
                    continue
                withinBox = (high >= box.get_bottom(dBox) and high <= box.get_top(dBox)) or (close >= box.get_bottom(dBox) and close <= box.get_top(dBox))
                bearishCandlesCount = math.sum(close < open ? 1 : 0, 15)
                if withinBox and bearishCandlesCount >= 7
                    label.new(bar_index, low, "Bearish count > 7", color=color.blue)
                    array.set(demandRejections, i, array.get(demandRejections, i) + 1)

f_check_supply_rejections() =>
    for i = 0 to history_of_demand_to_keep - 1
        if not na(array.get(supplyCreationBars, i))
            if bar_index - array.get(supplyCreationBars, i) > 15 and bar_index - array.get(supplyCreationBars, i) % 15 == 0
                label.new(bar_index, low, "Checking supply rejection", color=color.red)
                sBox = array.get(current_supply_box, i)
                if (na(sBox))
                    continue
                withinBox = (low <= box.get_top(sBox) and low >= box.get_bottom(sBox)) or (close <= box.get_top(sBox) and close >= box.get_bottom(sBox))
                bullishCandlesCount = math.sum(close > open ? 1 : 0, 15)
                if withinBox and bullishCandlesCount >= 7
                    label.new(bar_index, high, "Bullish count > 7", color=color.blue)
                    array.set(supplyRejections, i, array.get(supplyRejections, i) + 1)


f_array_add_pop(array, new_value_to_add) =>
    array.unshift(array, new_value_to_add)
    array.pop(array)

f_sh_sl_labels(array, swing_type) =>
    var string label_text = na
    if swing_type == 1
        if array.get(array, 0) >= array.get(array, 1)
            label_text := 'HH'
        else
            label_text := 'LH'
        label.new(bar_index - swing_length, array.get(array,0), text = label_text, style=label.style_label_down, textcolor = color.white, color = color.new(color.white, 100), size = size.tiny)
    else if swing_type == -1
        if array.get(array, 0) >= array.get(array, 1)
            label_text := 'HL'
        else
            label_text := 'LL'
        label.new(bar_index - swing_length, array.get(array,0), text = label_text, style=label.style_label_up, textcolor = color.white, color = color.new(color.white, 100), size = size.tiny)

f_check_overlapping(new_poi, box_array, atr) =>
    atr_threshold = atr * 2
    okay_to_draw = true
    for i = 0 to array.size(box_array) - 1
        top = box.get_top(array.get(box_array, i))
        bottom = box.get_bottom(array.get(box_array, i))
        poi = (top + bottom) / 2
        upper_boundary = poi + atr_threshold
        lower_boundary = poi - atr_threshold
        if new_poi >= lower_boundary and new_poi <= upper_boundary
            okay_to_draw := false
            break
        else
            okay_to_draw := true
    okay_to_draw

f_supply_demand(value_array, bn_array, box_array, label_array, box_type, atr) =>
    atr_buffer = atr * (box_width / 10)
    box_left = array.get(bn_array, 0)
    box_right = bar_index + 20
    var float box_top = 0.00
    var float box_bottom = 0.00
    var float poi = 0.00
    if box_type == 1
        box_top := array.get(value_array, 0)
        box_bottom := box_top - atr_buffer
        poi := (box_top + box_bottom) / 2
    else if box_type == -1
        box_bottom := array.get(value_array, 0)
        box_top := box_bottom + atr_buffer
        poi := (box_top + box_bottom) / 2
    okay_to_draw = f_check_overlapping(poi, box_array, atr)
    swing_volume = volume[swing_length]
    var string strength_text = ""

    highest_volume_last_20 = ta.highest(volume, 20)
    volume_percentage = math.round(swing_volume / highest_volume_last_20 * 100)
    volume_percentage := math.min(volume_percentage, 100)  // Cap the volume percentage to 100


    var extend_option = extend.right
    if box_extend_option == "Right"
        extend_option := extend.right
    else if box_extend_option == "Both"
        extend_option := extend.both
    if box_type == 1 and okay_to_draw and s1
        box.delete( array.get(box_array, array.size(box_array) - 5) )
        f_array_add_pop(box_array, box.new( left = box_left, top = box_top, right = box_right, bottom = box_bottom, border_color = color.rgb(242,54,69,50), border_width=1,
             bgcolor = supply_color, extend = extend_option, text = strength_text, text_halign = text.align_right, text_valign = text.align_center, text_color = color.white, text_size = size.small, xloc = xloc.bar_index))
        box.delete( array.get(label_array, array.size(label_array) - 5) )
        f_array_add_pop(label_array, box.new( left = box_left, top = poi, right = box_right, bottom = poi, border_color = color.rgb(242,54,69,50), border_width=1, border_style=line.style_dotted,
             bgcolor = color.new(color.black,100), extend = extend_option,  text = '', text_halign = text.align_left, text_valign = text.align_center, text_color = color.white, text_size = size.small, xloc = xloc.bar_index))
    else if box_type == -1 and okay_to_draw and s1
        box.delete( array.get(box_array, array.size(box_array) - 5) )
        f_array_add_pop(box_array, box.new( left = box_left, top = box_top, right = box_right, bottom = box_bottom, border_color = color.rgb(0,188,212,50), border_width=1,
             bgcolor = demand_color, extend = extend_option,  text = strength_text, text_halign = text.align_right, text_valign = text.align_center, text_color = color.white, text_size = size.small, xloc = xloc.bar_index))
        box.delete( array.get(label_array, array.size(label_array) - 5) )
        f_array_add_pop(label_array, box.new( left = box_left, top = poi, right = box_right, bottom = poi, border_color = color.rgb(0,188,212,50), border_width=1, border_style=line.style_dotted,
             bgcolor = color.new(color.black,100), extend = extend_option,  text = '', text_halign = text.align_left, text_valign = text.align_center, text_color = color.white, text_size = size.small, xloc = xloc.bar_index))

f_sd_to_bos(box_array, bos_array, label_array, zone_type) =>
    if zone_type == 1
        for i = 0 to array.size(box_array) - 1
            level_to_break = box.get_top(array.get(box_array,i))
            if close >= level_to_break
                box.delete(array.get(box_array, i))
                box.delete(array.get(label_array, i))
    if zone_type == -1
        for i = 0 to array.size(box_array) - 1
            level_to_break = box.get_bottom(array.get(box_array,i))
            if close <= level_to_break
                box.delete(array.get(box_array, i))
                box.delete(array.get(label_array, i))

f_extend_box_endpoint(box_array) =>
    for i = 0 to array.size(box_array) - 1
        box.set_right(array.get(box_array, i), bar_index + 30) // Extend only 20 bars

atr567 = ta.atr(50)
swing_high = ta.pivothigh(high, swing_length, swing_length)
swing_low = ta.pivotlow(low, swing_length, swing_length)
var swing_high_values = array.new_float(5,0.00)
var swing_low_values = array.new_float(5,0.00)
var swing_high_bns = array.new_int(5,0)
var swing_low_bns = array.new_int(5,0)
var current_supply_poi = array.new_box(history_of_demand_to_keep, na)
var current_demand_poi = array.new_box(history_of_demand_to_keep, na)
var supply_bos = array.new_box(5, na)
var demand_bos = array.new_box(5, na)
if not na(swing_high)
    f_array_add_pop(swing_high_values, swing_high)
    f_array_add_pop(swing_high_bns, bar_index[swing_length])
    if show_price_action_labels
        f_sh_sl_labels(swing_high_values, 1)
    f_supply_demand(swing_high_values, swing_high_bns, current_supply_box, current_supply_poi, 1, atr567)
else if not na(swing_low)
    f_array_add_pop(swing_low_values, swing_low)
    f_array_add_pop(swing_low_bns, bar_index[swing_length])
    if show_price_action_labels
        f_sh_sl_labels(swing_low_values, -1)
    f_supply_demand(swing_low_values, swing_low_bns, current_demand_box, current_demand_poi, -1, atr567)
f_sd_to_bos(current_supply_box, supply_bos, current_supply_poi, 1)
f_sd_to_bos(current_demand_box, demand_bos, current_demand_poi, -1)
f_extend_box_endpoint(current_supply_box)
f_extend_box_endpoint(current_demand_box)


// Inside the main execution, after the box is drawn, check for rejections
if not na(swing_low)
    f_array_add_pop(swing_low_values, swing_low)
    f_array_add_pop(swing_low_bns, bar_index[swing_length])
    if show_price_action_labels
        f_sh_sl_labels(swing_low_values, -1)
    f_supply_demand(swing_low_values, swing_low_bns, current_demand_box, current_demand_poi, -1, atr567)
    f_check_demand_rejections()

if not na(swing_high)
    f_array_add_pop(swing_high_values, swing_high)
    f_array_add_pop(swing_high_bns, bar_index[swing_length])
    if show_price_action_labels
        f_sh_sl_labels(swing_high_values, 1)
    f_supply_demand(swing_high_values, swing_high_bns, current_supply_box, current_supply_poi, 1, atr567)
    f_check_supply_rejections()


trigger2 = bull ? 1 : 0
countBull = ta.barssince(bull)
countBear = ta.barssince(bear)
trigger   = nz(countBull, bar_index) < nz(countBear, bar_index) ? 1 : 0
atrBand = ta.atr(atrLen) * atrRisk
atrStop = trigger == 1 ? low - atrBand : high + atrBand


lastTrade(close) => ta.valuewhen(bull or bear , close, 0)


entry = levels ? label.new(time, close, "ENTRY " + str.tostring(lastTrade(close), decimals), xloc.bar_time, yloc.price, #00e2ff, label.style_label_left, color.white, size.normal) : na
label.set_x(entry, label.get_x(entry) + math.round(ta.change(time) * lvlDistance))
label.set_y(entry, lastTrade(close))
label.delete(entry[1])


stop_y = lastTrade(atrStop)
stop  = levels ? label.new(time, close, "SL " + str.tostring(stop_y, decimals), xloc.bar_time, yloc.price, red2, label.style_label_left, color.white, size.normal) : na
label.set_x(stop, label.get_x(stop) + math.round(ta.change(time) * lvlDistance))
label.set_y(stop, stop_y)
label.delete(stop[1])

tp1Rl_y = (lastTrade(close)-lastTrade(atrStop))*1 + lastTrade(close)
tp1Rl   = levels ? label.new(time, close, "1:1 TP " + str.tostring(tp1Rl_y, decimals), xloc.bar_time, yloc.price, green2, label.style_label_left, color.white, size.normal ) : na
label.set_x(tp1Rl, label.get_x(tp1Rl) + math.round(ta.change(time) * lvlDistance))
label.set_y(tp1Rl, tp1Rl_y)
label.delete(tp1Rl[1])

tp2RL_y = (lastTrade(close)-lastTrade(atrStop))*2 + lastTrade(close)
tp2RL   = levels ? label.new(time, close, "2:1 TP " + str.tostring(tp2RL_y, decimals), xloc.bar_time, yloc.price, green2, label.style_label_left, color.white, size.normal) : na
label.set_x(tp2RL, label.get_x(tp2RL) + math.round(ta.change(time) * lvlDistance))
label.set_y(tp2RL, tp2RL_y)
label.delete(tp2RL[1])

tp3RL_y = (lastTrade(close)-lastTrade(atrStop))*3 + lastTrade(close)
tp3RL   = levels ? label.new(time, close, "3:1 TP " + str.tostring(tp3RL_y, decimals), xloc.bar_time, yloc.price, green2, label.style_label_left, color.white, size.normal) : na
label.set_x(tp3RL, label.get_x(tp3RL) + math.round(ta.change(time) * lvlDistance))
label.set_y(tp3RL, tp3RL_y)
label.delete(tp3RL[1])

style = linesStyle == "SOLID" ? line.style_solid : linesStyle == "DASHED" ? line.style_dashed : line.style_dotted
lineEntry = levels and lvlLines ? line.new(bar_index - (trigger == 0 ? countBull : countBear), lastTrade(close), bar_index + lvlDistance, lastTrade(close), xloc.bar_index, extend.none, #00e2ff, style, 2) : na, line.delete(lineEntry[1])
lineStop  = levels and lvlLines ? line.new(bar_index - (trigger == 0 ? countBull : countBear), stop_y, bar_index + lvlDistance, stop_y, xloc.bar_index, extend.none, #fe0100, style, 2) : na, line.delete(lineStop[1])
lineTp1Rl   = levels and lvlLines ? line.new(bar_index - (trigger == 0 ? countBull : countBear), tp1Rl_y, bar_index + lvlDistance, tp1Rl_y, xloc.bar_index, extend.none, green2, style, 2) : na, line.delete(lineTp1Rl[1])
lineTp2RL   = levels and lvlLines ? line.new(bar_index - (trigger == 0 ? countBull : countBear), tp2RL_y, bar_index + lvlDistance, tp2RL_y, xloc.bar_index, extend.none, green2, style, 2) : na, line.delete(lineTp2RL[1])
lineTp3RL   = levels and lvlLines ? line.new(bar_index - (trigger == 0 ? countBull : countBear), tp3RL_y, bar_index + lvlDistance, tp3RL_y, xloc.bar_index, extend.none, green2, style, 2) : na, line.delete(lineTp3RL[1])


alertcondition(bull, title='Buy Signal', message = "BUY")
alertcondition(bear, title='Sell Signal', message = "SELL")


//import protradingart/pta_plot/6 as pp
//pp.peakprofit(bull, bear)
How to Apply Pine Script in TradingView:
- Open TradingView and log in.
- Navigate to the Pine Script Editor at the bottom of the screen.
- Copy the provided Pine Script code.
- Paste it into the editor and click Save.
- Name the script, e.g., “Frost Algo v3.0 R-Engineered.”
- Click Add to Chart to apply the script.
- Adjust settings through the indicator panel to align with your trading preferences.
Final Verdict:
The Frost Algo v3.0 R-Engineered is a sophisticated trading script designed for traders of all levels. Its non-repainting nature and integration of multiple technical indicators make it ideal for scalping and swing trading. With customizable features and robust risk management tools, it provides a comprehensive solution for precision trading. However, new traders may need time to fully utilize its potential.
RELATED POSTS
View all
Line Break Chart Strategy: Advanced Price Action and Risk Management Tool
January 3, 2025 | by admin
Nas Rivera Indicator: Multi-Tool Trading System with ATR-Based Risk Management
January 3, 2025 | by admin
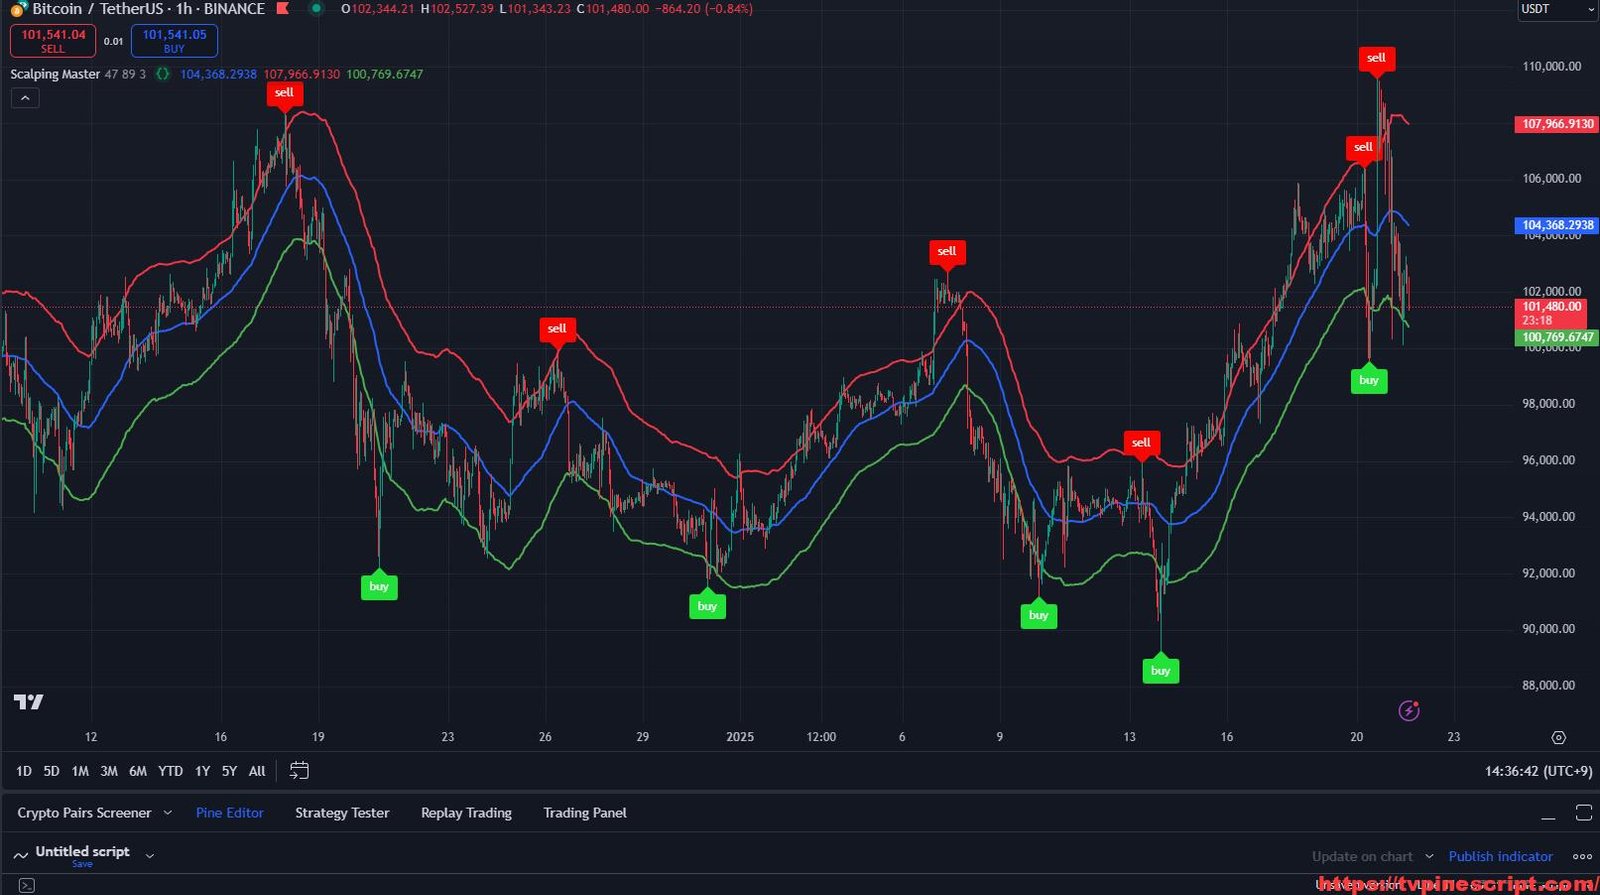
Scalping Master: Precision Entry and Exit Strategy for High-Frequency Traders
January 21, 2025 | by admin