Frost Algo Version 3.0 – R-Engineered: Advanced Trading Insights for Modern Traders
January 3, 2025 | by admin
//@version=5
indicator("Frost Algo Version 3.0 - R-Engineered", overlay = true)
// Get user input
nbuysell = input.bool(true, 'Buy/Sell Signal', inline = "BSNM",group='BUY/SELL SIGNAL')
nsensitivity = input.float(defval=2, title="-", inline = "BSNM", minval=1, maxval=20, group='BUY/SELL SIGNAL')
//candlecolor = input.bool(true, 'Buy/Sell Signal', inline = "BSNM",group='BUY/SELL SIGNAL')
// Trend Features
LongTrendAverage = input(false, 'Trend Cloud', group='TREND FEATURES')
TrendFollower = input(false, 'Trend Follower', group='TREND FEATURES')
ShowComulus = input(false, 'Comulus Cloud', group='TREND FEATURES')
CirrusCloud = input(false, 'Cirrus Cloud', group='TREND FEATURES')
// Risk Management
levels = input.bool(false, "Show TP/SL Levels" , group = "Risk Management" , inline = "MMDB2")
lvlLines = input.bool(false, "Show Lines ", inline="levels", group = "Risk Management")
linesStyle = input.string("SOLID", "", ["SOLID", "DASHED", "DOTTED"], inline="levels", group = "Risk Management")
lvlDistance = input.int(1, "Distance", 1, inline="levels2", group = "Risk Management")
lvlDecimals = input.int(2, " Decimals", 1, 8, inline="levels2", group = "Risk Management")
atrRisk = input.int(1, "Risk % ", 1, group = "Risk Management" , inline="levels3")
atrLen = input.int(14, " ATR Length", 1, group = "Risk Management" , inline="levels3")
decimals = lvlDecimals == 1 ? "#.#" : lvlDecimals == 2 ? "#.##" : lvlDecimals == 3 ? "#.###" : lvlDecimals == 4 ? "#.####" : lvlDecimals == 5 ? "#.#####" : lvlDecimals == 6 ? "#.######" : lvlDecimals == 7 ? "#.#######" : "#.########"
// Input settings
history_of_demand_to_keep = 20
show_zigzag = false
show_price_action_labels = false
showsr = input(true, title="Show Support & Resistance", group = 'Support & Resistance')
swing_length = input.int(defval=8, title="Sensitivity", group = 'Support & Resistance')
box_width = input.float(defval=4, title="Zone Width", group = 'Support & Resistance')
box_extend_option = input.string("Right", title="Extend Box", options=["Right", "Both"], group = 'Support & Resistance')
res = input.timeframe(title='Time Frame', defval='', group="Support & Resistance")
s1 = request.security(syminfo.tickerid, res, showsr, gaps=barmerge.gaps_on)
demand_color = input.color(color.rgb(0,188,212,70), title = 'Support & Resistance Color', group = 'Support & Resistance')
supply_color = input.color(color.rgb(178,40,51,70), title = '', group = 'Support & Resistance')
// Signal Generation
supertrend(_close, factor, atrLen) =>
atr = ta.atr(atrLen)
upperBand = _close + factor * atr
lowerBand = _close - factor * atr
prevLowerBand = nz(lowerBand[1])
prevUpperBand = nz(upperBand[1])
lowerBand := lowerBand > prevLowerBand or close[1] < prevLowerBand ? lowerBand : prevLowerBand
upperBand := upperBand < prevUpperBand or close[1] > prevUpperBand ? upperBand : prevUpperBand
int direction = na
float superTrend = na
prevSuperTrend = superTrend[1]
if na(atr[1])
direction := 1
else if prevSuperTrend == prevUpperBand
direction := close > upperBand ? -1 : 1
else
direction := close < lowerBand ? 1 : -1
superTrend := direction == -1 ? lowerBand : upperBand
[superTrend, direction]
// SMA
ocAvg = math.avg(open, close)
sma4 = ta.sma(close, 8)
sma5 = ta.sma(close, 9)
sma9 = ta.sma(close, 13)
psar = ta.sar(0.02, 0.02, 0.2)
//*in Easy Words Super Trend + SMA = Signals
[supertrend, direction] = supertrend(close, nsensitivity*2, 11)
source = close, period = 150
// Colors
green = #2BBC4D, green2 = #00DD00
red = #C51D0B, red2 = #DD0000
adxlen = 15
dilen = 15
dirmov(len) =>
up = ta.change(high)
down = -ta.change(low)
plusDM = na(up) ? na : up > down and up > 0 ? up : 0
minusDM = na(down) ? na : down > up and down > 0 ? down : 0
truerange = ta.rma(ta.tr, len)
plus = fixnan(100 * ta.rma(plusDM, len) / truerange)
minus = fixnan(100 * ta.rma(minusDM, len) / truerange)
[plus, minus]
adx(dilen, adxlen) =>
[plus, minus] = dirmov(dilen)
sum = plus + minus
adx = 100 * ta.rma(math.abs(plus - minus) / (sum == 0 ? 1 : sum), adxlen)
adx
sig = adx(dilen, adxlen)
// range ADX threshold
sidewaysThreshold = input.int(title='ADX Sideways Threshold (10-30)', minval=2, defval=15)
// boolean expression to see if the ADX is below tehe sideways threshold
bool isSideways = sig < sidewaysThreshold
// adding the option to color the bars when in a trading range
useBarColor = true
bColor = isSideways ? color.new(#4b148d, 0) : na
barcolor(useBarColor ? bColor : na)
barcolor(close > supertrend ? #00e2ff : #fe0100)
// High Lows
y1 = low - (ta.atr(30) * 2), y1B = low - ta.atr(30)
y2 = high + (ta.atr(30) * 2), y2B = high + ta.atr(30)
bull = ta.crossover(close, supertrend) and close >= sma9
bear = ta.crossunder(close, supertrend) and close <= sma9
// Plots
windowsize = 100
offset = 0.9
sigma = 6
//plot(ta.alma(source, windowsize, offset, sigma))
windowsize2 = 310
offset2 = 0.85
sigma2 = 32
//plot(ta.alma(source, windowsize2, offset2, sigma2))
// Chart Features
smoothrng(x, t, m) =>
wper = t * 2 - 1
avrng = ta.ema(math.abs(x - x[1]), t)
smoothrng = ta.ema(avrng, wper) * m
smoothrng
smrng = smoothrng(close, 22, 6)
rngfilt(x, r) =>
rngfilt = x
rngfilt := x > nz(rngfilt[1]) ? x - r < nz(rngfilt[1]) ? nz(rngfilt[1]) : x - r : x + r > nz(rngfilt[1]) ? nz(rngfilt[1]) : x + r
rngfilt
filt = rngfilt(close, smrng)
// ▒▒▒▒▒▒▒▒▒▒▒▒▒▒▒▒▒▒▒▒▒▒▒▒▒▒▒▒▒▒▒▒▒▒▒▒▒▒▒▒▒▒▒▒▒▒▒▒▒▒▒▒▒▒▒▒▒▒▒▒▒▒▒▒▒▒▒▒▒▒▒▒▒▒▒▒▒▒▒▒▒▒▒▒▒▒▒▒▒▒▒▒▒▒▒▒▒▒▒▒▒▒▒▒▒▒▒▒▒▒▒▒▒▒
upward = 0.0
upward := filt > filt[1] ? nz(upward[1]) + 1 : filt < filt[1] ? 0 : nz(upward[1])
downward = 0.0
downward := filt < filt[1] ? nz(downward[1]) + 1 : filt > filt[1] ? 0 : nz(downward[1])
filtcolor = upward > 0 ? color.new(#00e2ff, 50) : downward > 0 ? color.new(#fe0100, 50) : color.new(#56328f, 0)
plot(TrendFollower ? filt : na, color=filtcolor, linewidth=1, title='Trend Tracer')
// Trend Cloud
tclength = 600
hullma = ta.wma(2*ta.wma(close, tclength/2)-ta.wma(close, tclength), math.floor(math.sqrt(tclength)))
plot(LongTrendAverage ? hullma : na, 'Trend Cloud', linewidth=4, color=close[8] > hullma ? color.new(#00e2ff, 65) : color.new(#fe0100, 65))
// Comulus Cloud
candle = ta.alma(source, windowsize2, offset2, sigma2)
reach = ta.alma(source, windowsize, offset, sigma)
candlep = plot(ShowComulus ? candle : na, color=color.new(color.white, 100))
reachp = plot(ShowComulus ? reach : na, color=color.new(color.white, 100))
fill(reachp, candlep, color= candle > reach ? color.new(#fe0100, 85) : color.new(#00e2ff, 85))
// Chart Features
x1 = 22
x2 = 9
x3 = 15
x4 = 5
smoothrngX1(x, t, m) =>
wper = t * 2 - 1
avrng = ta.ema(math.abs(x - x[1]), t)
smoothrngX1 = ta.ema(avrng, wper) * m
smoothrngX1
smrngx1x = smoothrngX1(close, x1, x2)
smrngx1x2 = smoothrngX1(close, x3, x4)
rngfiltx1x1(x, r) =>
rngfiltx1x1 = x
rngfiltx1x1 := x > nz(rngfiltx1x1[1]) ? x - r < nz(rngfiltx1x1[1]) ? nz(rngfiltx1x1[1]) : x - r : x + r > nz(rngfiltx1x1[1]) ? nz(rngfiltx1x1[1]) : x + r
rngfiltx1x1
filtx1 = rngfiltx1x1(close, smrngx1x)
filtx12 = rngfiltx1x1(close, smrngx1x2)
// ▒▒▒▒▒▒▒▒▒▒▒▒▒▒▒▒▒▒▒▒▒▒▒▒▒▒▒▒▒▒▒▒▒▒▒▒▒▒▒▒▒▒▒▒▒▒▒▒▒▒▒▒▒▒▒▒▒▒▒▒▒▒▒▒▒▒▒▒▒▒▒▒▒▒▒▒▒▒▒▒▒▒▒▒▒▒▒▒▒▒▒▒▒▒▒▒▒▒▒▒▒▒▒▒▒▒▒▒▒▒▒▒▒▒
upwardx1 = 0.0
upwardx1 := filtx1 > filtx1[1] ? nz(upwardx1[1]) + 1 : filtx1 < filtx1[1] ? 0 : nz(upwardx1[1])
downwardx1 = 0.0
downwardx1 := filtx1 < filtx1[1] ? nz(downwardx1[1]) + 1 : filtx1 > filtx1[1] ? 0 : nz(downwardx1[1])
filtx1colorx1 = color.rgb(0, 187, 212, 100)
xxx1 = plot(CirrusCloud ? filtx1 : na, color=filtx1colorx1, linewidth=1, title='Trend Tracer', editable = false)
xxx2 = plot(CirrusCloud ? filtx12 : na, color=filtx1colorx1, linewidth=1, title='Trend Tracer', editable = false)
fill(xxx1, xxx2, color= filtx1 > filtx12 ? color.new(#fe0100, 65) : color.new(#00e2ff, 65))
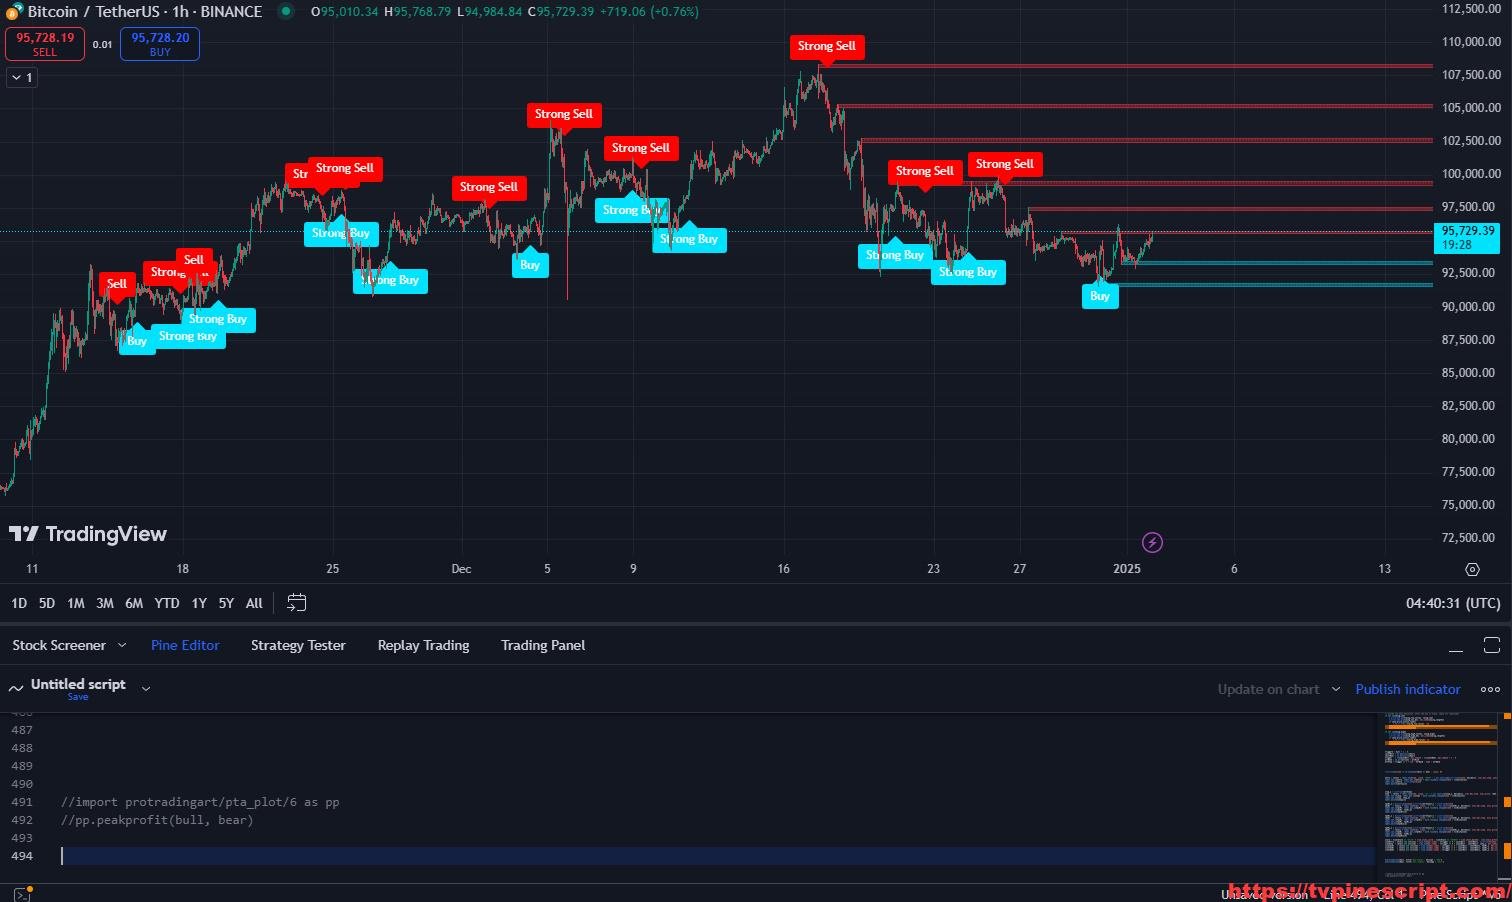
buy = bull and nbuysell ? label.new(bar_index, y1, sma4 >= sma5 ? "Strong Buy" : "Buy", xloc.bar_index, yloc.price, #00e2ff, label.style_label_up, color.white, size.normal) : na
sell = bear and nbuysell ? label.new(bar_index, y2, sma4 <= sma5 ? "Strong Sell" : "Sell", xloc.bar_index, yloc.price, #fe0100, label.style_label_down, color.white, size.normal) : na
// Other initializations
avg_volume = ta.sma(volume, 20)
very_weak_multiplier = 0.5
weak_multiplier = 1
strong_multiplier = 1.5
// Rejection handling
var int[] demandRejections = array.new_int(history_of_demand_to_keep, 0)
var int[] supplyRejections = array.new_int(history_of_demand_to_keep, 0)
var int[] demandCreationBars = array.new_int(history_of_demand_to_keep, na)
var int[] supplyCreationBars = array.new_int(history_of_demand_to_keep, na)
var box[] current_demand_box = array.new_box(history_of_demand_to_keep, na)
var box[] current_supply_box = array.new_box(history_of_demand_to_keep, na)
f_check_demand_rejections() =>
for i = 0 to history_of_demand_to_keep - 1
if not na(array.get(demandCreationBars, i))
if bar_index - array.get(demandCreationBars, i) > 15 and bar_index - array.get(demandCreationBars, i) % 15 == 0
label.new(bar_index, high, "Checking demand rejection", color=color.red)
dBox = array.get(current_demand_box, i)
if (na(dBox))
continue
withinBox = (high >= box.get_bottom(dBox) and high <= box.get_top(dBox)) or (close >= box.get_bottom(dBox) and close <= box.get_top(dBox))
bearishCandlesCount = math.sum(close < open ? 1 : 0, 15)
if withinBox and bearishCandlesCount >= 7
label.new(bar_index, low, "Bearish count > 7", color=color.blue)
array.set(demandRejections, i, array.get(demandRejections, i) + 1)
f_check_supply_rejections() =>
for i = 0 to history_of_demand_to_keep - 1
if not na(array.get(supplyCreationBars, i))
if bar_index - array.get(supplyCreationBars, i) > 15 and bar_index - array.get(supplyCreationBars, i) % 15 == 0
label.new(bar_index, low, "Checking supply rejection", color=color.red)
sBox = array.get(current_supply_box, i)
if (na(sBox))
continue
withinBox = (low <= box.get_top(sBox) and low >= box.get_bottom(sBox)) or (close <= box.get_top(sBox) and close >= box.get_bottom(sBox))
bullishCandlesCount = math.sum(close > open ? 1 : 0, 15)
if withinBox and bullishCandlesCount >= 7
label.new(bar_index, high, "Bullish count > 7", color=color.blue)
array.set(supplyRejections, i, array.get(supplyRejections, i) + 1)
f_array_add_pop(array, new_value_to_add) =>
array.unshift(array, new_value_to_add)
array.pop(array)
f_sh_sl_labels(array, swing_type) =>
var string label_text = na
if swing_type == 1
if array.get(array, 0) >= array.get(array, 1)
label_text := 'HH'
else
label_text := 'LH'
label.new(bar_index - swing_length, array.get(array,0), text = label_text, style=label.style_label_down, textcolor = color.white, color = color.new(color.white, 100), size = size.tiny)
else if swing_type == -1
if array.get(array, 0) >= array.get(array, 1)
label_text := 'HL'
else
label_text := 'LL'
label.new(bar_index - swing_length, array.get(array,0), text = label_text, style=label.style_label_up, textcolor = color.white, color = color.new(color.white, 100), size = size.tiny)
f_check_overlapping(new_poi, box_array, atr) =>
atr_threshold = atr * 2
okay_to_draw = true
for i = 0 to array.size(box_array) - 1
top = box.get_top(array.get(box_array, i))
bottom = box.get_bottom(array.get(box_array, i))
poi = (top + bottom) / 2
upper_boundary = poi + atr_threshold
lower_boundary = poi - atr_threshold
if new_poi >= lower_boundary and new_poi <= upper_boundary
okay_to_draw := false
break
else
okay_to_draw := true
okay_to_draw
f_supply_demand(value_array, bn_array, box_array, label_array, box_type, atr) =>
atr_buffer = atr * (box_width / 10)
box_left = array.get(bn_array, 0)
box_right = bar_index + 20
var float box_top = 0.00
var float box_bottom = 0.00
var float poi = 0.00
if box_type == 1
box_top := array.get(value_array, 0)
box_bottom := box_top - atr_buffer
poi := (box_top + box_bottom) / 2
else if box_type == -1
box_bottom := array.get(value_array, 0)
box_top := box_bottom + atr_buffer
poi := (box_top + box_bottom) / 2
okay_to_draw = f_check_overlapping(poi, box_array, atr)
swing_volume = volume[swing_length]
var string strength_text = ""
highest_volume_last_20 = ta.highest(volume, 20)
volume_percentage = math.round(swing_volume / highest_volume_last_20 * 100)
volume_percentage := math.min(volume_percentage, 100) // Cap the volume percentage to 100
var extend_option = extend.right
if box_extend_option == "Right"
extend_option := extend.right
else if box_extend_option == "Both"
extend_option := extend.both
if box_type == 1 and okay_to_draw and s1
box.delete( array.get(box_array, array.size(box_array) - 5) )
f_array_add_pop(box_array, box.new( left = box_left, top = box_top, right = box_right, bottom = box_bottom, border_color = color.rgb(242,54,69,50), border_width=1,
bgcolor = supply_color, extend = extend_option, text = strength_text, text_halign = text.align_right, text_valign = text.align_center, text_color = color.white, text_size = size.small, xloc = xloc.bar_index))
box.delete( array.get(label_array, array.size(label_array) - 5) )
f_array_add_pop(label_array, box.new( left = box_left, top = poi, right = box_right, bottom = poi, border_color = color.rgb(242,54,69,50), border_width=1, border_style=line.style_dotted,
bgcolor = color.new(color.black,100), extend = extend_option, text = '', text_halign = text.align_left, text_valign = text.align_center, text_color = color.white, text_size = size.small, xloc = xloc.bar_index))
else if box_type == -1 and okay_to_draw and s1
box.delete( array.get(box_array, array.size(box_array) - 5) )
f_array_add_pop(box_array, box.new( left = box_left, top = box_top, right = box_right, bottom = box_bottom, border_color = color.rgb(0,188,212,50), border_width=1,
bgcolor = demand_color, extend = extend_option, text = strength_text, text_halign = text.align_right, text_valign = text.align_center, text_color = color.white, text_size = size.small, xloc = xloc.bar_index))
box.delete( array.get(label_array, array.size(label_array) - 5) )
f_array_add_pop(label_array, box.new( left = box_left, top = poi, right = box_right, bottom = poi, border_color = color.rgb(0,188,212,50), border_width=1, border_style=line.style_dotted,
bgcolor = color.new(color.black,100), extend = extend_option, text = '', text_halign = text.align_left, text_valign = text.align_center, text_color = color.white, text_size = size.small, xloc = xloc.bar_index))
f_sd_to_bos(box_array, bos_array, label_array, zone_type) =>
if zone_type == 1
for i = 0 to array.size(box_array) - 1
level_to_break = box.get_top(array.get(box_array,i))
if close >= level_to_break
box.delete(array.get(box_array, i))
box.delete(array.get(label_array, i))
if zone_type == -1
for i = 0 to array.size(box_array) - 1
level_to_break = box.get_bottom(array.get(box_array,i))
if close <= level_to_break
box.delete(array.get(box_array, i))
box.delete(array.get(label_array, i))
f_extend_box_endpoint(box_array) =>
for i = 0 to array.size(box_array) - 1
box.set_right(array.get(box_array, i), bar_index + 30) // Extend only 20 bars
atr567 = ta.atr(50)
swing_high = ta.pivothigh(high, swing_length, swing_length)
swing_low = ta.pivotlow(low, swing_length, swing_length)
var swing_high_values = array.new_float(5,0.00)
var swing_low_values = array.new_float(5,0.00)
var swing_high_bns = array.new_int(5,0)
var swing_low_bns = array.new_int(5,0)
var current_supply_poi = array.new_box(history_of_demand_to_keep, na)
var current_demand_poi = array.new_box(history_of_demand_to_keep, na)
var supply_bos = array.new_box(5, na)
var demand_bos = array.new_box(5, na)
if not na(swing_high)
f_array_add_pop(swing_high_values, swing_high)
f_array_add_pop(swing_high_bns, bar_index[swing_length])
if show_price_action_labels
f_sh_sl_labels(swing_high_values, 1)
f_supply_demand(swing_high_values, swing_high_bns, current_supply_box, current_supply_poi, 1, atr567)
else if not na(swing_low)
f_array_add_pop(swing_low_values, swing_low)
f_array_add_pop(swing_low_bns, bar_index[swing_length])
if show_price_action_labels
f_sh_sl_labels(swing_low_values, -1)
f_supply_demand(swing_low_values, swing_low_bns, current_demand_box, current_demand_poi, -1, atr567)
f_sd_to_bos(current_supply_box, supply_bos, current_supply_poi, 1)
f_sd_to_bos(current_demand_box, demand_bos, current_demand_poi, -1)
f_extend_box_endpoint(current_supply_box)
f_extend_box_endpoint(current_demand_box)
// Inside the main execution, after the box is drawn, check for rejections
if not na(swing_low)
f_array_add_pop(swing_low_values, swing_low)
f_array_add_pop(swing_low_bns, bar_index[swing_length])
if show_price_action_labels
f_sh_sl_labels(swing_low_values, -1)
f_supply_demand(swing_low_values, swing_low_bns, current_demand_box, current_demand_poi, -1, atr567)
f_check_demand_rejections()
if not na(swing_high)
f_array_add_pop(swing_high_values, swing_high)
f_array_add_pop(swing_high_bns, bar_index[swing_length])
if show_price_action_labels
f_sh_sl_labels(swing_high_values, 1)
f_supply_demand(swing_high_values, swing_high_bns, current_supply_box, current_supply_poi, 1, atr567)
f_check_supply_rejections()
trigger2 = bull ? 1 : 0
countBull = ta.barssince(bull)
countBear = ta.barssince(bear)
trigger = nz(countBull, bar_index) < nz(countBear, bar_index) ? 1 : 0
atrBand = ta.atr(atrLen) * atrRisk
atrStop = trigger == 1 ? low - atrBand : high + atrBand
lastTrade(close) => ta.valuewhen(bull or bear , close, 0)
entry = levels ? label.new(time, close, "ENTRY " + str.tostring(lastTrade(close), decimals), xloc.bar_time, yloc.price, #00e2ff, label.style_label_left, color.white, size.normal) : na
label.set_x(entry, label.get_x(entry) + math.round(ta.change(time) * lvlDistance))
label.set_y(entry, lastTrade(close))
label.delete(entry[1])
stop_y = lastTrade(atrStop)
stop = levels ? label.new(time, close, "SL " + str.tostring(stop_y, decimals), xloc.bar_time, yloc.price, red2, label.style_label_left, color.white, size.normal) : na
label.set_x(stop, label.get_x(stop) + math.round(ta.change(time) * lvlDistance))
label.set_y(stop, stop_y)
label.delete(stop[1])
tp1Rl_y = (lastTrade(close)-lastTrade(atrStop))*1 + lastTrade(close)
tp1Rl = levels ? label.new(time, close, "1:1 TP " + str.tostring(tp1Rl_y, decimals), xloc.bar_time, yloc.price, green2, label.style_label_left, color.white, size.normal ) : na
label.set_x(tp1Rl, label.get_x(tp1Rl) + math.round(ta.change(time) * lvlDistance))
label.set_y(tp1Rl, tp1Rl_y)
label.delete(tp1Rl[1])
tp2RL_y = (lastTrade(close)-lastTrade(atrStop))*2 + lastTrade(close)
tp2RL = levels ? label.new(time, close, "2:1 TP " + str.tostring(tp2RL_y, decimals), xloc.bar_time, yloc.price, green2, label.style_label_left, color.white, size.normal) : na
label.set_x(tp2RL, label.get_x(tp2RL) + math.round(ta.change(time) * lvlDistance))
label.set_y(tp2RL, tp2RL_y)
label.delete(tp2RL[1])
tp3RL_y = (lastTrade(close)-lastTrade(atrStop))*3 + lastTrade(close)
tp3RL = levels ? label.new(time, close, "3:1 TP " + str.tostring(tp3RL_y, decimals), xloc.bar_time, yloc.price, green2, label.style_label_left, color.white, size.normal) : na
label.set_x(tp3RL, label.get_x(tp3RL) + math.round(ta.change(time) * lvlDistance))
label.set_y(tp3RL, tp3RL_y)
label.delete(tp3RL[1])
style = linesStyle == "SOLID" ? line.style_solid : linesStyle == "DASHED" ? line.style_dashed : line.style_dotted
lineEntry = levels and lvlLines ? line.new(bar_index - (trigger == 0 ? countBull : countBear), lastTrade(close), bar_index + lvlDistance, lastTrade(close), xloc.bar_index, extend.none, #00e2ff, style, 2) : na, line.delete(lineEntry[1])
lineStop = levels and lvlLines ? line.new(bar_index - (trigger == 0 ? countBull : countBear), stop_y, bar_index + lvlDistance, stop_y, xloc.bar_index, extend.none, #fe0100, style, 2) : na, line.delete(lineStop[1])
lineTp1Rl = levels and lvlLines ? line.new(bar_index - (trigger == 0 ? countBull : countBear), tp1Rl_y, bar_index + lvlDistance, tp1Rl_y, xloc.bar_index, extend.none, green2, style, 2) : na, line.delete(lineTp1Rl[1])
lineTp2RL = levels and lvlLines ? line.new(bar_index - (trigger == 0 ? countBull : countBear), tp2RL_y, bar_index + lvlDistance, tp2RL_y, xloc.bar_index, extend.none, green2, style, 2) : na, line.delete(lineTp2RL[1])
lineTp3RL = levels and lvlLines ? line.new(bar_index - (trigger == 0 ? countBull : countBear), tp3RL_y, bar_index + lvlDistance, tp3RL_y, xloc.bar_index, extend.none, green2, style, 2) : na, line.delete(lineTp3RL[1])
alertcondition(bull, title='Buy Signal', message = "BUY")
alertcondition(bear, title='Sell Signal', message = "SELL")
//import protradingart/pta_plot/6 as pp
//pp.peakprofit(bull, bear)
How to Apply Pine Script in TradingView:
- Open TradingView and log in.
- Navigate to the Pine Script Editor at the bottom of the screen.
- Copy the provided Pine Script code.
- Paste it into the editor and click Save.
- Name the script, e.g., “Frost Algo 3.0 – R-Engineered.”
- Click Add to Chart to apply the script.
- Customize settings via the indicator panel to match your trading style.
Key Features of the Script:
- Buy/Sell Signal Generation:
- Generates buy and sell signals based on a combination of Supertrend and SMA indicators.
- Customizable sensitivity settings to adapt to various market conditions.
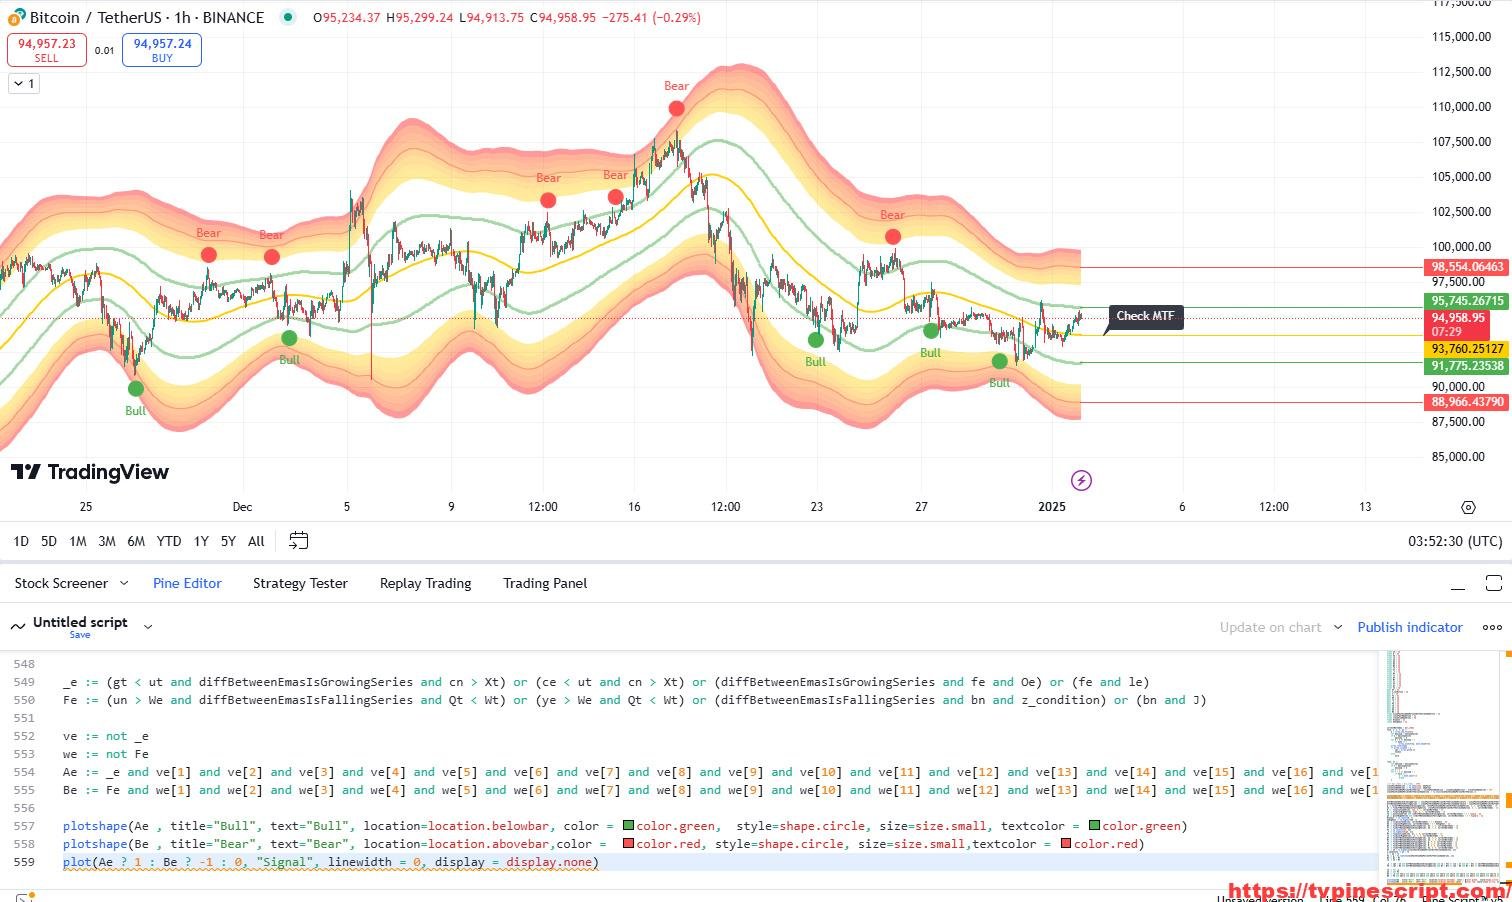
- Advanced Trend Features:
- Includes multiple trend analysis tools such as Long Trend Cloud, Trend Follower, and Cirrus Cloud.
- Dynamic trend cloud visualizations for precise market momentum assessment.
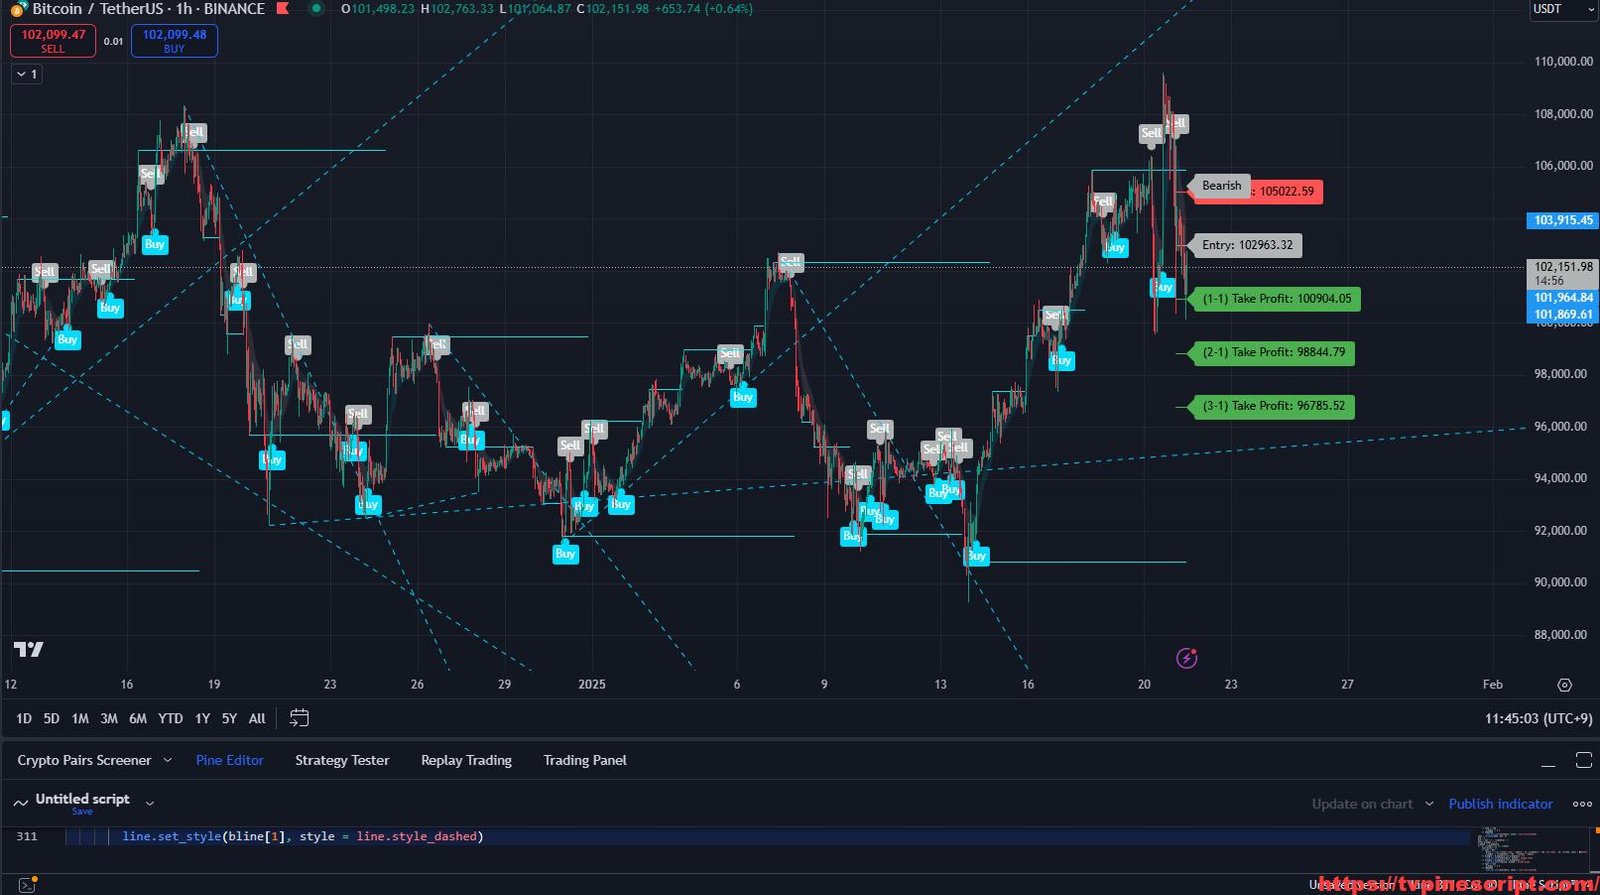
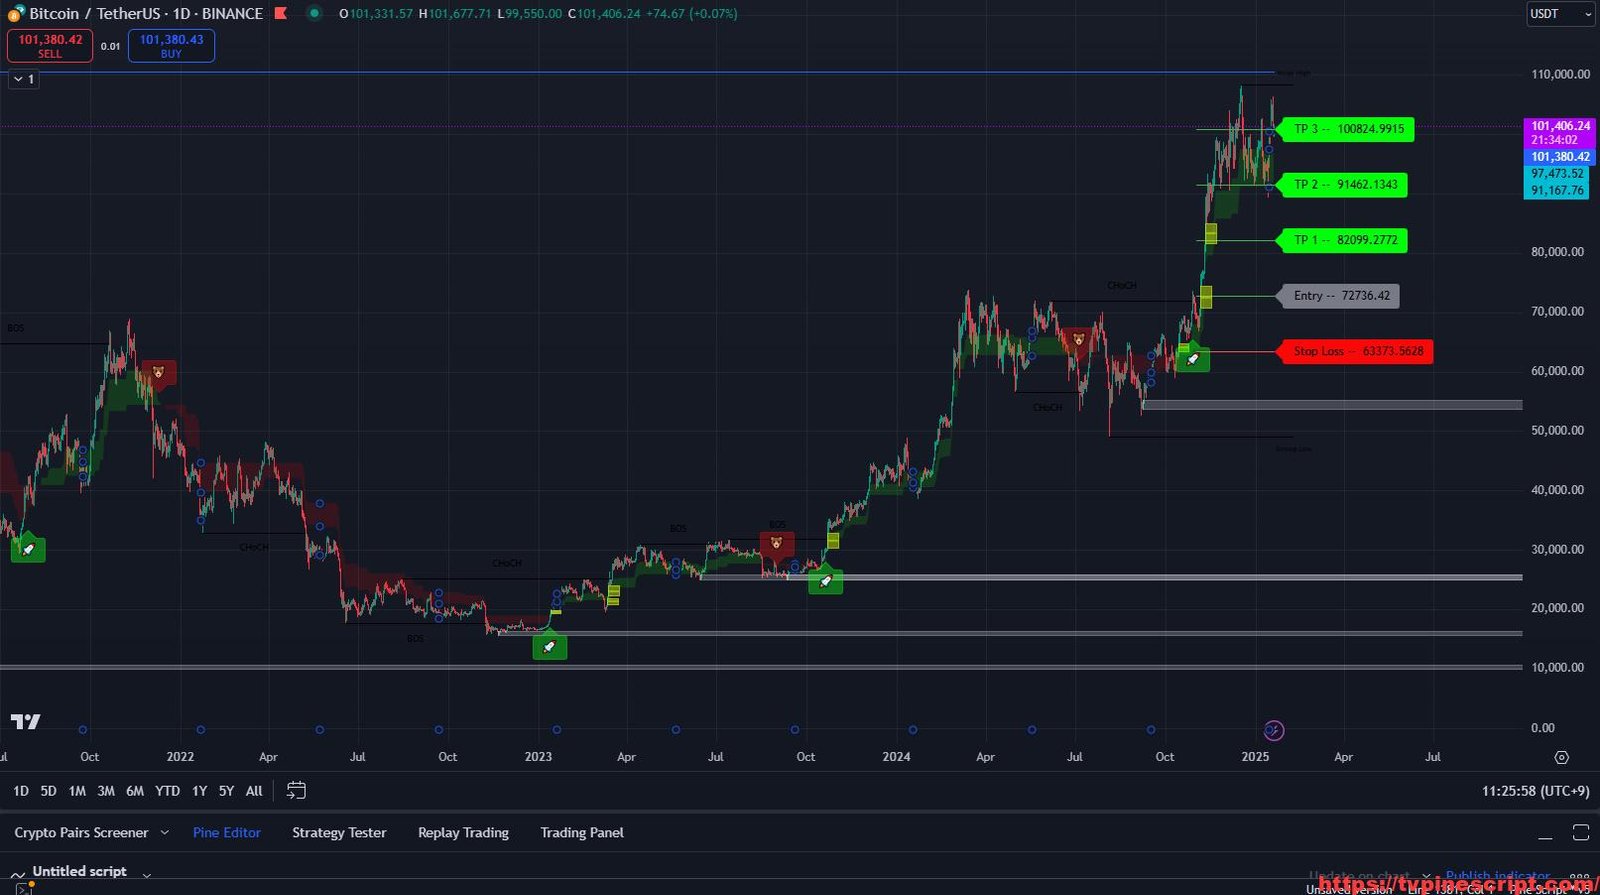
- Risk Management Integration:
- Offers ATR-based stop-loss and take-profit levels.
- Displays multiple risk/reward ratios (1:1, 2:1, and 3:1) for efficient trade management.
- Support and Resistance Visualization:
- Highlights supply and demand zones dynamically.
- Incorporates swing high/low detection for identifying key levels.
- ADX-Based Sideways Market Detection:
- Detects sideways markets using customizable ADX thresholds.
- Visualizes trading ranges with distinct bar colors for better clarity.
- Comprehensive Alerts System:
- Provides alerts for buy/sell signals, stop-loss hits, and trend reversals.
- Fully customizable notification options for real-time trading insights.
- Custom Visualization Options:
- Flexible plotting of zones, trendlines, and indicators with user-defined colors and styles.
- Heatmap-style trend visualization for intuitive analysis.
Recommended Usage:
- Day and Swing Trading:
- Use buy/sell signals with trend clouds to execute trades in trending markets.
- Leverage support and resistance zones to time entries and exits.
- Scalping Strategies:
- Employ the script’s sensitivity settings and ATR-based risk management for short-term trades.
- Risk and Trade Management:
- Monitor ATR-based stop-loss and take-profit levels to ensure disciplined trading.
- Utilize visualized risk/reward zones for better decision-making.
- Sideways Market Identification:
- Adjust ADX thresholds to detect and avoid range-bound conditions.
Script Evaluation:
- Functionality: 4.9/5
The script offers an extensive range of features, making it versatile for all trading styles. - Ease of Use: 4.5/5
While packed with advanced tools, its intuitive layout makes it accessible for most traders with a basic understanding of technical analysis. - Accuracy: 4.7/5
Signals are reliable, especially when combined with the recommended settings for specific market conditions. - Repainting:
This script does not repaint, ensuring consistency and reliability in its output. - Overall Score: 4.8/5
An exceptional trading tool for traders seeking a holistic approach to market analysis.
Final Verdict:
The Frost Algo Version 3.0 – R-Engineered script combines powerful signal generation, trend analysis, and risk management in one package. Its non-repainting nature ensures trustworthy outputs, while the customizable settings make it adaptable to various trading strategies. Whether you’re scalping or swing trading, this script offers valuable insights and tools to enhance your trading performance. However, its complexity may require some initial familiarization for beginners.
RELATED POSTS
View all
Revolutionize Trading with Mean Reversion Channel and Multi-Timeframe Analysis in Pine Script
January 3, 2025 | by admin
Asset Bender Algo Indicator: A Comprehensive Trading Tool for Trend and Risk Management
January 21, 2025 | by admin
SimpleAlgo v3: Advanced SuperTrend and Risk Management Trading Indicator
January 20, 2025 | by admin