Revolutionize Trading with Mean Reversion Channel and Multi-Timeframe Analysis in Pine Script
January 3, 2025 | by admin
//@version=5
indicator('Mean Revg', shorttitle='MgggRC', overlay=true, format=format.inherit, max_bars_back = 4800, precision = 5)
//************************************************************************************************************
// Parameter
//************************************************************************************************************
indiSet = input(false, '═════════ MRC Parameter ════════')
source = input(hlc3, title='Price Source')
type = input.string('SuperSmoother', title='Filter Type', options=['SuperSmoother', 'Ehlers EMA', 'Gaussian', 'Butterworth', 'BandStop', 'SMA', 'EMA', 'RMA'])
length = input.int(200, title='Lookback Period', minval=1)
innermult = input.float(1.0, title='Inner Channel Size Multiplier', minval=0.1)
outermult = input.float(2.415, title='Outer Channel Size Multiplier', minval=0.1)
ChartSet = input(false, '═════════ Chart Setting ════════')
drawchannel = input(true, title='Draw Channel')
displayzone = input(true, title='Draw Zone (With Channel)')
zonetransp = input.int(60, title='Zone Transparency', minval=0, maxval=100)
displayline = input(true, title='Display Line Extension')
MTFSet = input(false, '═════════ MTF Setting ════════')
enable_mtf = input(true, title='Enable Multiple TimeFrame Analysis')
mtf_disp_typ = input.string('On Hover', title='MTF Display Type', options=['Always Display', 'On Hover'])
mtf_typ = input.string('Auto', title='Multiple TimeFrame Type', options=['Auto', 'Custom'])
mtf_lvl1 = input.timeframe('D', title='Custom MTF Level 1')
mtf_lvl2 = input.timeframe('W', title='Custom MTF Level 2')
//************************************************************************************************************
// Functions Start {
//************************************************************************************************************
var pi = 2 * math.asin(1)
var mult = pi * innermult
var mult2 = pi * outermult
var gradsize = 0.5
var gradtransp = zonetransp
//-----------------------
// Ehler SwissArmyKnife Function
//-----------------------
SAK_smoothing(_type, _src, _length) =>
c0 = 1.0
c1 = 0.0
b0 = 1.0
b1 = 0.0
b2 = 0.0
a1 = 0.0
a2 = 0.0
alpha = 0.0
beta = 0.0
gamma = 0.0
cycle = 2 * pi / _length
if _type == 'Ehlers EMA'
alpha := (math.cos(cycle) + math.sin(cycle) - 1) / math.cos(cycle)
b0 := alpha
a1 := 1 - alpha
a1
if _type == 'Gaussian'
beta := 2.415 * (1 - math.cos(cycle))
alpha := -beta + math.sqrt(beta * beta + 2 * beta)
c0 := alpha * alpha
a1 := 2 * (1 - alpha)
a2 := -(1 - alpha) * (1 - alpha)
a2
if _type == 'Butterworth'
beta := 2.415 * (1 - math.cos(cycle))
alpha := -beta + math.sqrt(beta * beta + 2 * beta)
c0 := alpha * alpha / 4
b1 := 2
b2 := 1
a1 := 2 * (1 - alpha)
a2 := -(1 - alpha) * (1 - alpha)
a2
if _type == 'BandStop'
beta := math.cos(cycle)
gamma := 1 / math.cos(cycle * 2 * 0.1) // delta default to 0.1. Acceptable delta -- 0.05<d<0.5
alpha := gamma - math.sqrt(gamma * gamma - 1)
c0 := (1 + alpha) / 2
b1 := -2 * beta
b2 := 1
a1 := beta * (1 + alpha)
a2 := -alpha
a2
if _type == 'SMA'
c1 := 1 / _length
b0 := 1 / _length
a1 := 1
a1
if _type == 'EMA'
alpha := 2 / (_length + 1)
b0 := alpha
a1 := 1 - alpha
a1
if _type == 'RMA'
alpha := 1 / _length
b0 := alpha
a1 := 1 - alpha
a1
_Input = _src
_Output = 0.0
_Output := c0 * (b0 * _Input + b1 * nz(_Input[1]) + b2 * nz(_Input[2])) + a1 * nz(_Output[1]) + a2 * nz(_Output[2]) - c1 * nz(_Input[_length])
_Output
//-----------------------
// SuperSmoother Function
//-----------------------
supersmoother(_src, _length) =>
s_a1 = math.exp(-math.sqrt(2) * pi / _length)
s_b1 = 2 * s_a1 * math.cos(math.sqrt(2) * pi / _length)
s_c3 = -math.pow(s_a1, 2)
s_c2 = s_b1
s_c1 = 1 - s_c2 - s_c3
ss = 0.0
ss := s_c1 * _src + s_c2 * nz(ss[1], _src[1]) + s_c3 * nz(ss[2], _src[2])
ss
//-----------------------
// Auto TimeFrame Function
//-----------------------
// ————— Converts current chart resolution into a float minutes value.
f_resInMinutes() =>
_resInMinutes = timeframe.multiplier * (timeframe.isseconds ? 1. / 60 : timeframe.isminutes ? 1. : timeframe.isdaily ? 60. * 24 : timeframe.isweekly ? 60. * 24 * 7 : timeframe.ismonthly ? 60. * 24 * 30.4375 : na)
_resInMinutes
get_tf(_lvl) =>
y = f_resInMinutes()
z = timeframe.period
if mtf_typ == 'Auto'
if y < 1
z := _lvl == 1 ? '1' : _lvl == 2 ? '5' : z
z
else if y <= 3
z := _lvl == 1 ? '5' : _lvl == 2 ? '15' : z
z
else if y <= 10
z := _lvl == 1 ? '15' : _lvl == 2 ? '60' : z
z
else if y <= 30
z := _lvl == 1 ? '60' : _lvl == 2 ? '240' : z
z
else if y <= 120
z := _lvl == 1 ? '240' : _lvl == 2 ? 'D' : z
z
else if y <= 240
z := _lvl == 1 ? 'D' : _lvl == 2 ? 'W' : z
z
else if y <= 1440
z := _lvl == 1 ? 'W' : _lvl == 2 ? 'M' : z
z
else if y <= 10080
z := _lvl == 1 ? 'M' : z
z
else
z := z
z
else
z := _lvl == 1 ? mtf_lvl1 : _lvl == 2 ? mtf_lvl2 : z
z
z
//-----------------------
// Mean Reversion Channel Function
//-----------------------
get_mrc() =>
v_condition = 0
v_meanline = source
v_meanrange = supersmoother(ta.tr, length)
//-- Get Line value
if type == 'SuperSmoother'
v_meanline := supersmoother(source, length)
v_meanline
if type != 'SuperSmoother'
v_meanline := SAK_smoothing(type, source, length)
v_meanline
v_upband1 = v_meanline + v_meanrange * mult
v_loband1 = v_meanline - v_meanrange * mult
v_upband2 = v_meanline + v_meanrange * mult2
v_loband2 = v_meanline - v_meanrange * mult2
//-- Check Condition
if close > v_meanline
v_upband2_1 = v_upband2 + v_meanrange * gradsize * 4
v_upband2_9 = v_upband2 + v_meanrange * gradsize * -4
if high >= v_upband2_9 and high < v_upband2
v_condition := 1
v_condition
else if high >= v_upband2 and high < v_upband2_1
v_condition := 2
v_condition
else if high >= v_upband2_1
v_condition := 3
v_condition
else if close <= v_meanline + v_meanrange
v_condition := 4
v_condition
else
v_condition := 5
v_condition
if close < v_meanline
v_loband2_1 = v_loband2 - v_meanrange * gradsize * 4
v_loband2_9 = v_loband2 - v_meanrange * gradsize * -4
if low <= v_loband2_9 and low > v_loband2
v_condition := -1
v_condition
else if low <= v_loband2 and low > v_loband2_1
v_condition := -2
v_condition
else if low <= v_loband2_1
v_condition := -3
v_condition
else if close >= v_meanline + v_meanrange
v_condition := -4
v_condition
else
v_condition := -5
v_condition
[v_meanline, v_meanrange, v_upband1, v_loband1, v_upband2, v_loband2, v_condition]
//-----------------------
// MTF Analysis
//-----------------------
get_stat(_cond) =>
ret = 'Price at Mean Line\n'
if _cond == 1
ret := 'Overbought (Weak)\n'
ret
else if _cond == 2
ret := 'Overbought\n'
ret
else if _cond == 3
ret := 'Overbought (Strong)\n'
ret
else if _cond == 4
ret := 'Price Near Mean\n'
ret
else if _cond == 5
ret := 'Price Above Mean\n'
ret
else if _cond == -1
ret := 'Oversold (Weak)\n'
ret
else if _cond == -2
ret := 'Oversold\n'
ret
else if _cond == -3
ret := 'Oversold (Strong)\n'
ret
else if _cond == -4
ret := 'Price Near Mean\n'
ret
else if _cond == -5
ret := 'Price Below Mean\n'
ret
ret
//-----------------------
// Chart Drawing Function
//-----------------------
format_price(x) =>
y = str.tostring(x, '0.00000')
if x > 10
y := str.tostring(x, '0.000')
y
if x > 1000
y := str.tostring(x, '0.00')
y
y
f_PriceLine(_ref, linecol) =>
line.new(x1=bar_index, x2=bar_index - 1, y1=_ref, y2=_ref, extend=extend.left, color=linecol)
f_MTFLabel(_txt, _yloc) =>
label.new(x=time + math.round(ta.change(time) * 20), y=_yloc, xloc=xloc.bar_time, text=mtf_disp_typ == 'Always Display' ? _txt : 'Check MTF', tooltip=mtf_disp_typ == 'Always Display' ? '' : _txt, color=color.black, textcolor=color.white, size=size.normal, style=mtf_disp_typ == 'On Hover' and displayline ? label.style_label_lower_left : label.style_label_left, textalign=text.align_left)
//} Function End
//************************************************************************************************************
// Calculate Channel
//************************************************************************************************************
var tf_0 = timeframe.period
var tf_1 = get_tf(1)
var tf_2 = get_tf(2)
[meanline, meanrange, upband1, loband1, upband2, loband2, condition] = get_mrc()
[mtf1_meanline, mtf1_meanrange, mtf1_upband1, mtf1_loband1, mtf1_upband2, mtf1_loband2, mtf1_condition] = request.security(syminfo.tickerid, tf_1, get_mrc())
[mtf2_meanline, mtf2_meanrange, mtf2_upband1, mtf2_loband1, mtf2_upband2, mtf2_loband2, mtf2_condition] = request.security(syminfo.tickerid, tf_2, get_mrc())
//************************************************************************************************************
// Drawing Start {
//************************************************************************************************************
float p_meanline = drawchannel ? meanline : na
float p_upband1 = drawchannel ? upband1 : na
float p_loband1 = drawchannel ? loband1 : na
float p_upband2 = drawchannel ? upband2 : na
float p_loband2 = drawchannel ? loband2 : na
z = plot(p_meanline, color=color.new(#FFCD00, 0), style=plot.style_line, title=' Mean', linewidth=2)
x1 = plot(p_upband1, color=color.new(color.green, 50), style=plot.style_circles, title=' R1', linewidth=1)
x2 = plot(p_loband1, color=color.new(color.green, 50), style=plot.style_circles, title=' S1', linewidth=1)
y1 = plot(p_upband2, color=color.new(color.red, 50), style=plot.style_line, title=' R2', linewidth=1)
y2 = plot(p_loband2, color=color.new(color.red, 50), style=plot.style_line, title=' S2', linewidth=1)
//-----------------------
// Draw zone
//-----------------------
//---
var color1 = #FF0000
var color2 = #FF4200
var color3 = #FF5D00
var color4 = #FF7400
var color5 = #FF9700
var color6 = #FFAE00
var color7 = #FFC500
var color8 = #FFCD00
//---
float upband2_1 = drawchannel and displayzone ? upband2 + meanrange * gradsize * 4 : na
float loband2_1 = drawchannel and displayzone ? loband2 - meanrange * gradsize * 4 : na
float upband2_2 = drawchannel and displayzone ? upband2 + meanrange * gradsize * 3 : na
float loband2_2 = drawchannel and displayzone ? loband2 - meanrange * gradsize * 3 : na
float upband2_3 = drawchannel and displayzone ? upband2 + meanrange * gradsize * 2 : na
float loband2_3 = drawchannel and displayzone ? loband2 - meanrange * gradsize * 2 : na
float upband2_4 = drawchannel and displayzone ? upband2 + meanrange * gradsize * 1 : na
float loband2_4 = drawchannel and displayzone ? loband2 - meanrange * gradsize * 1 : na
float upband2_5 = drawchannel and displayzone ? upband2 + meanrange * gradsize * 0 : na
float loband2_5 = drawchannel and displayzone ? loband2 - meanrange * gradsize * 0 : na
float upband2_6 = drawchannel and displayzone ? upband2 + meanrange * gradsize * -1 : na
float loband2_6 = drawchannel and displayzone ? loband2 - meanrange * gradsize * -1 : na
float upband2_7 = drawchannel and displayzone ? upband2 + meanrange * gradsize * -2 : na
float loband2_7 = drawchannel and displayzone ? loband2 - meanrange * gradsize * -2 : na
float upband2_8 = drawchannel and displayzone ? upband2 + meanrange * gradsize * -3 : na
float loband2_8 = drawchannel and displayzone ? loband2 - meanrange * gradsize * -3 : na
float upband2_9 = drawchannel and displayzone ? upband2 + meanrange * gradsize * -4 : na
float loband2_9 = drawchannel and displayzone ? loband2 - meanrange * gradsize * -4 : na
//---
plot_upband2_1 = plot(upband2_1, color=na, display=display.none, transp=100)
plot_loband2_1 = plot(loband2_1, color=na, display=display.none, transp=100)
plot_upband2_2 = plot(upband2_2, color=na, display=display.none, transp=100)
plot_loband2_2 = plot(loband2_2, color=na, display=display.none, transp=100)
plot_upband2_3 = plot(upband2_3, color=na, display=display.none, transp=100)
plot_loband2_3 = plot(loband2_3, color=na, display=display.none, transp=100)
plot_upband2_4 = plot(upband2_4, color=na, display=display.none, transp=100)
plot_loband2_4 = plot(loband2_4, color=na, display=display.none, transp=100)
plot_upband2_5 = plot(upband2_5, color=na, display=display.none, transp=100)
plot_loband2_5 = plot(loband2_5, color=na, display=display.none, transp=100)
plot_upband2_6 = plot(upband2_6, color=na, display=display.none, transp=100)
plot_loband2_6 = plot(loband2_6, color=na, display=display.none, transp=100)
plot_upband2_7 = plot(upband2_7, color=na, display=display.none, transp=100)
plot_loband2_7 = plot(loband2_7, color=na, display=display.none, transp=100)
plot_upband2_8 = plot(upband2_8, color=na, display=display.none, transp=100)
plot_loband2_8 = plot(loband2_8, color=na, display=display.none, transp=100)
plot_upband2_9 = plot(upband2_9, color=na, display=display.none, transp=100)
plot_loband2_9 = plot(loband2_9, color=na, display=display.none, transp=100)
//---
fill(plot_upband2_1, plot_upband2_2, color=color1, transp=gradtransp)
fill(plot_loband2_1, plot_loband2_2, color=color1, transp=gradtransp)
fill(plot_upband2_2, plot_upband2_3, color=color2, transp=gradtransp)
fill(plot_loband2_2, plot_loband2_3, color=color2, transp=gradtransp)
fill(plot_upband2_3, plot_upband2_4, color=color3, transp=gradtransp)
fill(plot_loband2_3, plot_loband2_4, color=color3, transp=gradtransp)
fill(plot_upband2_4, plot_upband2_5, color=color4, transp=gradtransp)
fill(plot_loband2_4, plot_loband2_5, color=color4, transp=gradtransp)
fill(plot_upband2_5, plot_upband2_6, color=color5, transp=gradtransp)
fill(plot_loband2_5, plot_loband2_6, color=color5, transp=gradtransp)
fill(plot_upband2_6, plot_upband2_7, color=color6, transp=gradtransp)
fill(plot_loband2_6, plot_loband2_7, color=color6, transp=gradtransp)
fill(plot_upband2_7, plot_upband2_8, color=color7, transp=gradtransp)
fill(plot_loband2_7, plot_loband2_8, color=color7, transp=gradtransp)
fill(plot_upband2_8, plot_upband2_9, color=color8, transp=gradtransp)
fill(plot_loband2_8, plot_loband2_9, color=color8, transp=gradtransp)
//-----------------------
// Plot Extension
//-----------------------
if displayline and enable_mtf and mtf_disp_typ == 'Always Display'
displayline := false
displayline
var line mean = na
line.delete(mean)
mean := displayline ? f_PriceLine(meanline, #FFCD00) : na
var line res1 = na
line.delete(res1)
res1 := displayline ? f_PriceLine(upband1, color.green) : na
var line sup1 = na
line.delete(sup1)
sup1 := displayline ? f_PriceLine(loband1, color.green) : na
var line res2 = na
line.delete(res2)
res2 := displayline ? f_PriceLine(upband2, color.red) : na
var line sup2 = na
line.delete(sup2)
sup2 := displayline ? f_PriceLine(loband2, color.red) : na
//--------------
// Prep MTF Label
//--------------
var brl = '\n--------------------------------------'
dist_0 = 'Distance from Mean: ' + str.tostring((close - meanline) / close * 100, '#.##') + ' %'
dist_1 = 'Distance from Mean: ' + str.tostring((close - mtf1_meanline) / close * 100, '#.##') + ' %'
dist_2 = 'Distance from Mean: ' + str.tostring((close - mtf2_meanline) / close * 100, '#.##') + ' %'
var title = 'Mean Reversion Channel\nMultiple TimeFrame Analysis' + brl
tf0 = '\n\nTimeframe: ' + tf_0 + ' (Current)\n\nStatus: ' + get_stat(condition) + dist_0 + brl
tf1 = not timeframe.ismonthly ? '\n\nTimeframe: ' + tf_1 + '\n\nStatus: ' + get_stat(mtf1_condition) + dist_1 + brl : ''
tf2 = not timeframe.isweekly and not timeframe.ismonthly ? '\n\nTimeframe: ' + tf_2 + '\n\nStatus: ' + get_stat(mtf2_condition) + dist_2 + brl : ''
mtf_lbl = title + tf0 + tf1 + tf2
var label label_mtf = na
label.delete(label_mtf)
label_mtf := enable_mtf ? f_MTFLabel(mtf_lbl, meanline) : na
//} Drawing End
//22222222222222222222222222222
emaFast = 12
emaSlow = 26
sc = 55
int maxLoopCycles = 300
float closeFastSlowEmaPercentDiffSeries = na
int pivotLowSeries = na
int pivotHighSeries = na
int diffBetweenEmasIsGrowingSeries = na
int diffBetweenEmasIsFallingSeries = na
float g = na
float oe = na
float K = na
float Se = na
float ce = na
float ye = na
float me = na
float Ee = na
float We = na
float ut = na
float et = na
float _t = na
float Rt = na
float rn = na
float Qt = na
float Wt = na
float cn = na
float Xt = na
float gt = na
float un = na
bool bn = na
bool z_condition = na
bool J = na
bool fe = na
bool Oe = na
bool le = na
bool _e = na
bool Fe = na
bool ve = na
bool we = na
bool Ae = na
bool Be = na
float closeFastSlowEmaPercentDiffSeriesSmaSeries = na
float closeFastEmaSeries = na
float closeSlowEmaSeries = na
float Klowest = na
float Sehighest = na
currentBarIndex = bar_index
fi(e, n, i, r, a) =>
u = array.new_float(0)
int maxLoop = maxLoopCycles
if a < maxLoopCycles
maxLoop := a
for h = 0 to maxLoop + 1
if e[h] == 1
array.unshift(u, math.abs(h+r))
array.reverse(u)
if array.size(u) > i
idx = array.get(u,i)
n[idx]
else
n[0]
rc(e, n) =>
int maxLoop = maxLoopCycles
if n < maxLoopCycles
maxLoop := n
int i = 0
for r = 0 to maxLoop + 1
if e[r] == 1
i := math.abs(r+1)
break
i
//if bar_index > bar_index - 3000
closeFastEmaSeries := ta.ema(close, emaFast)
closeSlowEmaSeries := ta.ema(close, emaSlow)
closeFastSlowEmaPercentDiffSeries := (closeFastEmaSeries - closeSlowEmaSeries) / closeSlowEmaSeries * 100
closeFastSlowEmaPercentDiffSeriesSmaSeries := ta.sma(closeFastSlowEmaPercentDiffSeries,2)
pivotLowSeries := low[0] > low[1] and low[1] < low[2] or low[1] == low[2] and low[1] < low[0] and low[1] < low[3] or low[1] == low[2] and low[1] == low[3] and low[1] < low[0] and (low[1] < low[4] or low[1] == low[2] and low[1] == low[3]) and low[1] and low[1] == low[4] and low[1] < low[0] and low[1] < low[5] ? 1 : 0
pivotHighSeries := high[0] < high[1] and high[1] > high[2] or high[1] == high[2] and high[1] > high[0] and high[1] > high[3] or high[1] == high[2] and high[1] == high[3] and high[1] > high[0] and (high[1] > high[4] or high[1] == high[2] and high[1] == high[3]) and high[1] and high[1] == high[4] and high[1] > high[0] and high[1] > high[5] ? 1 : 0
diffBetweenEmasIsGrowingSeries := closeFastSlowEmaPercentDiffSeriesSmaSeries[0] > closeFastSlowEmaPercentDiffSeriesSmaSeries[1] and closeFastSlowEmaPercentDiffSeriesSmaSeries[1] < closeFastSlowEmaPercentDiffSeriesSmaSeries[2] ? 1 : 0
diffBetweenEmasIsFallingSeries := closeFastSlowEmaPercentDiffSeriesSmaSeries[0] < closeFastSlowEmaPercentDiffSeriesSmaSeries[1] and closeFastSlowEmaPercentDiffSeriesSmaSeries[1] > closeFastSlowEmaPercentDiffSeriesSmaSeries[2] ? 1 : 0
g := fi(diffBetweenEmasIsGrowingSeries, closeFastSlowEmaPercentDiffSeriesSmaSeries, 0, 1, currentBarIndex - 1)
oe := fi(diffBetweenEmasIsFallingSeries, closeFastSlowEmaPercentDiffSeriesSmaSeries, 0, 1, currentBarIndex - 1)
K := fi(pivotLowSeries, low, 0, 1, currentBarIndex - 1)
Se := fi(pivotHighSeries, high, 0, 1, currentBarIndex - 1)
ce := pivotLowSeries and rc(diffBetweenEmasIsGrowingSeries, currentBarIndex) < 3 ? low[1] : na
ye := pivotHighSeries and rc(diffBetweenEmasIsFallingSeries, currentBarIndex) < 3 ? high[1] : na
Klowest := ta.lowest(K, 4)
Sehighest := ta.highest(Se, 4)
me := rc(pivotLowSeries, currentBarIndex) < 5 ? Klowest : na
Ee := rc(pivotHighSeries, currentBarIndex) < 5 ? Sehighest : na
We := fi(diffBetweenEmasIsFallingSeries, Ee, 1, 0, currentBarIndex - 1)
ut := fi(diffBetweenEmasIsGrowingSeries, me, 1, 0, currentBarIndex - 1)
et := ta.lowest(low, sc)
_t := ta.highest(high, sc)
Rt := fi(pivotLowSeries, et, 1, 0, currentBarIndex - 1)
rn := fi(pivotHighSeries, _t, 1, 0, currentBarIndex - 1)
Qt := fi(diffBetweenEmasIsGrowingSeries, oe, 0, 0, currentBarIndex - 1)
Wt := fi(diffBetweenEmasIsFallingSeries, oe, 1, 0, currentBarIndex - 1)
cn := fi(diffBetweenEmasIsGrowingSeries, g, 0, 0, currentBarIndex - 1)
Xt := fi(diffBetweenEmasIsGrowingSeries, g, 1, 0, currentBarIndex - 1)
gt := fi(diffBetweenEmasIsGrowingSeries, K, 0, 0, currentBarIndex - 1)
un := fi(diffBetweenEmasIsFallingSeries, Se, 0, 0, currentBarIndex - 1)
bn := oe < ta.highest(closeFastSlowEmaPercentDiffSeriesSmaSeries, sc)
z_condition := un > rn
J := ye > rn
fe := g > ta.lowest(closeFastSlowEmaPercentDiffSeriesSmaSeries, sc)
Oe := gt < Rt
le := ce < Rt
_e := (gt < ut and diffBetweenEmasIsGrowingSeries and cn > Xt) or (ce < ut and cn > Xt) or (diffBetweenEmasIsGrowingSeries and fe and Oe) or (fe and le)
Fe := (un > We and diffBetweenEmasIsFallingSeries and Qt < Wt) or (ye > We and Qt < Wt) or (diffBetweenEmasIsFallingSeries and bn and z_condition) or (bn and J)
ve := not _e
we := not Fe
Ae := _e and ve[1] and ve[2] and ve[3] and ve[4] and ve[5] and ve[6] and ve[7] and ve[8] and ve[9] and ve[10] and ve[11] and ve[12] and ve[13] and ve[14] and ve[15] and ve[16] and ve[17] and ve[18] and ve[19] and ve[20] and ve[21] and ve[22] and ve[23] and ve[24] and ve[25] and ve[26] and ve[27] and ve[28] and ve[29] and ve[30] and ve[31] and ve[32] and ve[33] and ve[34] and ve[35] and ve[36] and ve[37] and ve[38] and ve[39] and ve[40] and ve[41] and ve[42] and ve[43] and ve[44] and ve[45] and ve[46] and ve[47] and ve[48] and ve[49] and ve[50] ? 1 : 0
Be := Fe and we[1] and we[2] and we[3] and we[4] and we[5] and we[6] and we[7] and we[8] and we[9] and we[10] and we[11] and we[12] and we[13] and we[14] and we[15] and we[16] and we[17] and we[18] and we[19] and we[20] and we[21] and we[22] and we[23] and we[24] and we[25] and we[26] and we[27] and we[28] and we[29] and we[30] and we[31] and we[32] and we[33] and we[34] and we[35] and we[36] and we[37] and we[38] and we[39] and we[40] and we[41] and we[42] and we[43] and we[44] and we[45] and we[46] and we[47] and we[48] and we[49] and we[50] ? 1 : 0
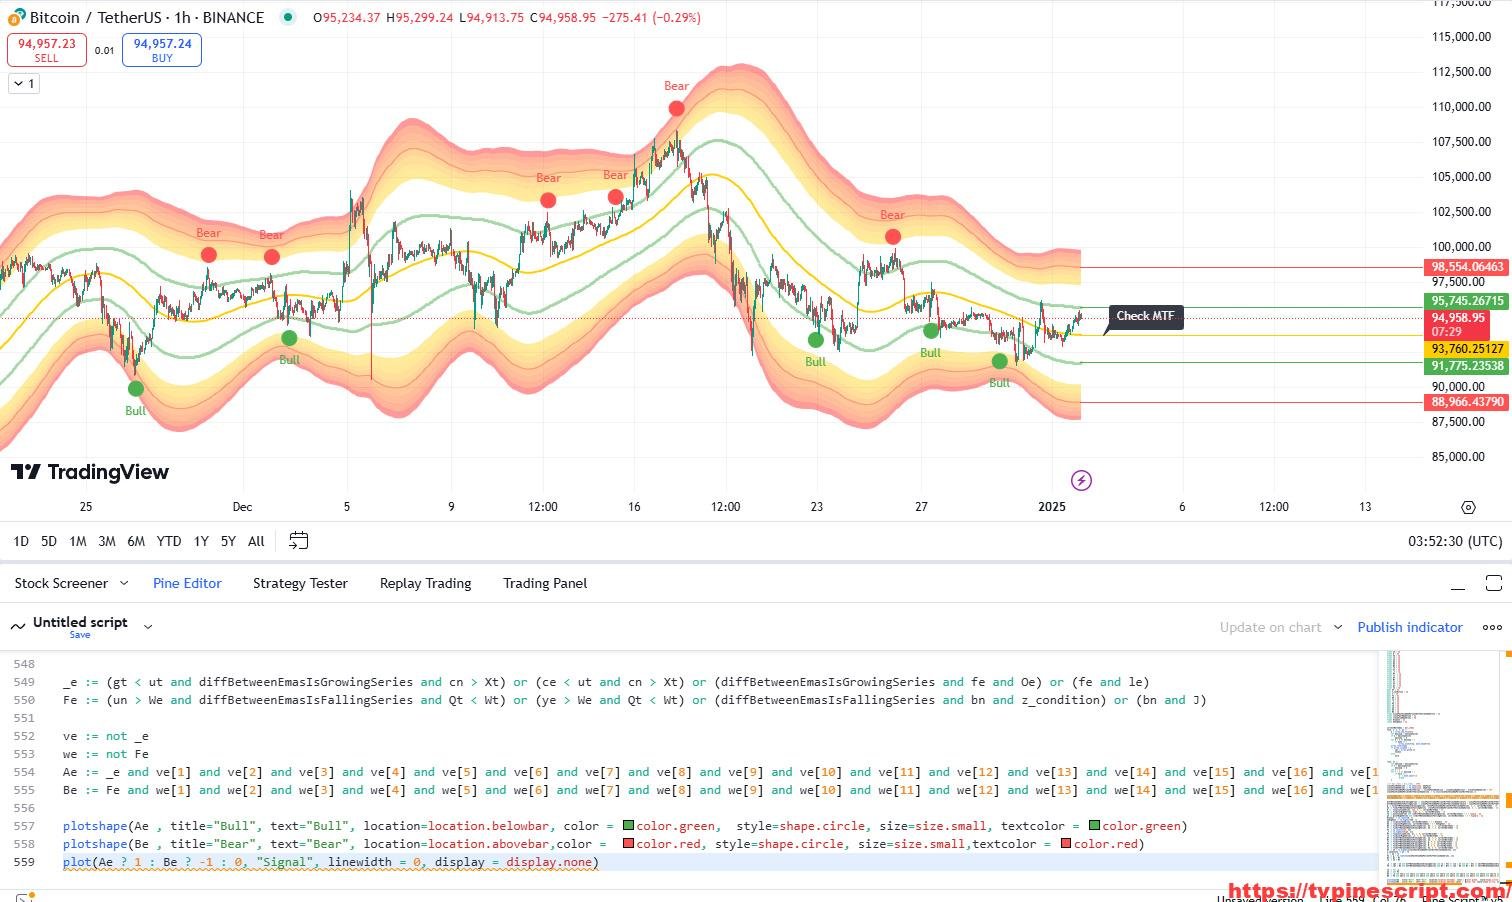
plotshape(Ae , title="Bull", text="Bull", location=location.belowbar, color = color.green, style=shape.circle, size=size.small, textcolor = color.green)
plotshape(Be , title="Bear", text="Bear", location=location.abovebar,color = color.red, style=shape.circle, size=size.small,textcolor = color.red)
plot(Ae ? 1 : Be ? -1 : 0, "Signal", linewidth = 0, display = display.none)How to Apply Pine Script in TradingView:
- Open TradingView and log in to your account.
- Navigate to the Pine Script Editor at the bottom of the screen.
- Copy the provided Pine Script code.
- Paste it into the editor.
- Click Save and provide a descriptive name, such as “Mean Reversion Channel.”
- Click Add to Chart to apply the indicator to your selected chart.
- Customize the input settings in the indicator panel to suit your trading style.
Key Features of the Script:
- Dynamic Mean Reversion Channel:
- Creates adaptive mean and channel bands using advanced smoothing techniques like Super Smoother, Gaussian, and Butterworth filters.
- Displays inner and outer bands to highlight overbought and oversold conditions.
- Multi-Timeframe (MTF) Analysis:
- Incorporates customizable MTF levels for in-depth analysis of price movements across different timeframes.
- Displays MTF conditions dynamically based on the current chart resolution.
- Visual Indicators:
- Overlays zones with varying transparency to emphasize price proximity to key levels.
- Highlights overbought and oversold areas with gradient-filled zones and distinct colors for easy identification.
- Custom Alerts and Conditions:
- Identifies and signals pivotal market conditions, such as when prices approach or deviate from the mean.
- Includes automated alerts for bullish and bearish reversals.
- Additional Analysis Features:
- Includes pivot detection for highs and lows.
- Tracks exponential moving averages (EMA) and calculates their percentage differences to identify trends.
- Flexibility and Customization:
- Offers full customization of input parameters such as lookback periods, multipliers, and zone transparency.
- Supports detailed annotations for actionable insights.
Recommended Usage:
- Trend and Reversal Trading:
- Utilize the mean reversion channel to identify entry and exit points when the price is overbought or oversold.
- Leverage multi-timeframe analysis to validate trends and avoid false signals.
- Day Trading:
- Use the dynamic channels to identify short-term trading opportunities.
- Enable MTF analysis for precise decision-making on intraday charts.
- Risk Management:
- Monitor channel boundaries to set stop-loss and take-profit levels based on key support and resistance zones.
- Algorithmic Integration:
- The script’s alerts can be integrated into automated trading systems for executing trades based on predefined conditions.
RELATED POSTS
View all
Master Market Liquidity with LiqD Liquidation Heatmap SB[ɅI]: A Game-Changer for Smart Trading Decisions
January 21, 2025 | by admin
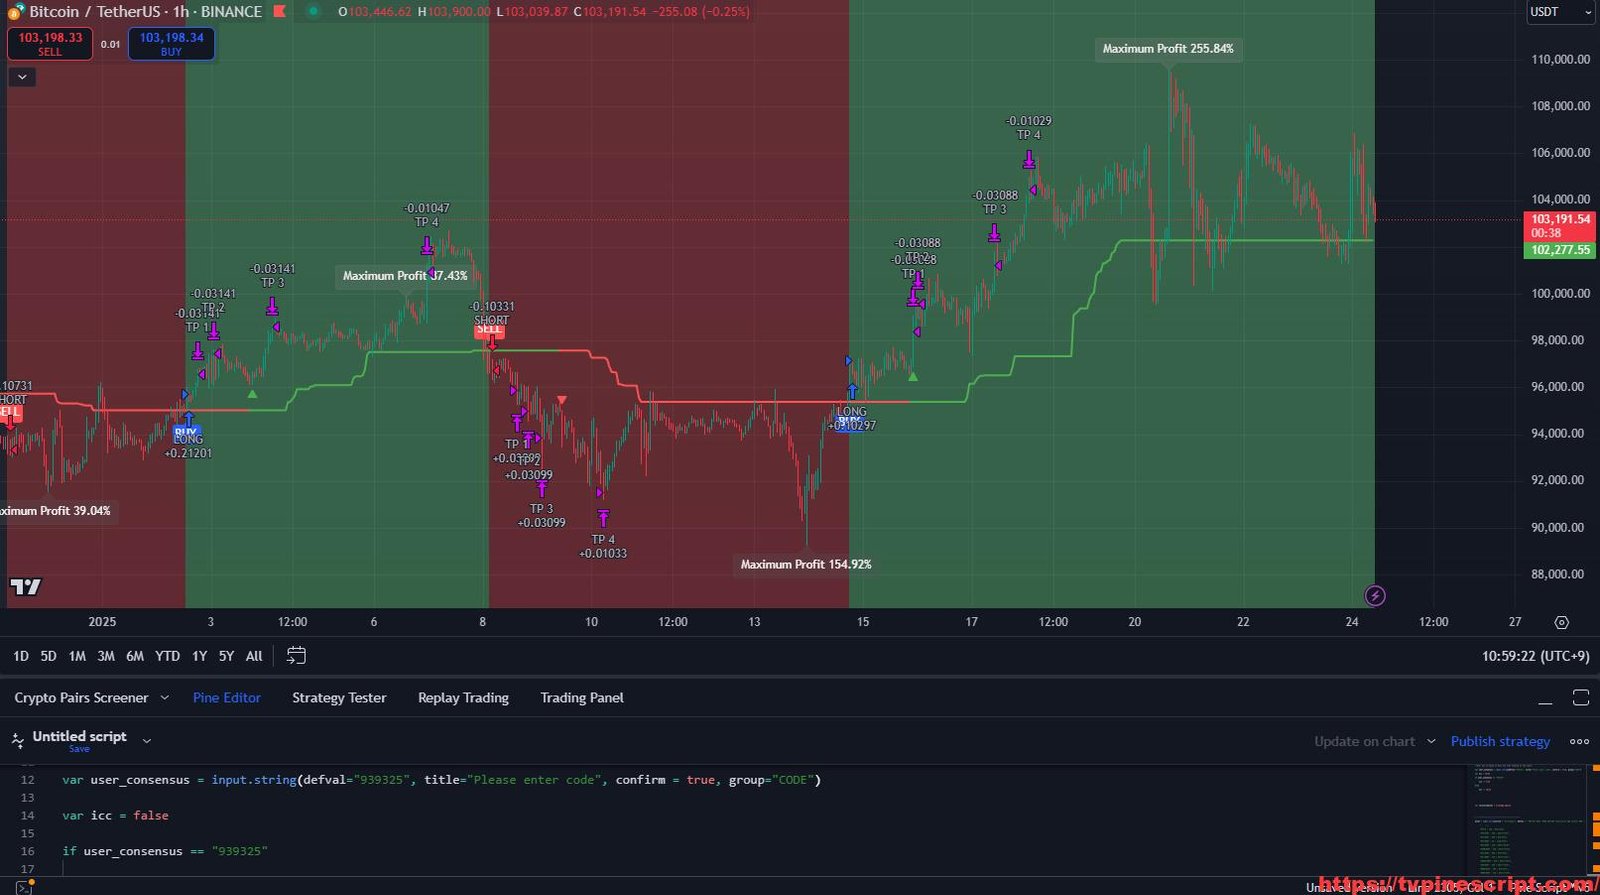
Nayrafa AlgoTrade-vick-V3: A Comprehensive Multi-Asset Trading Strategy
January 24, 2025 | by admin
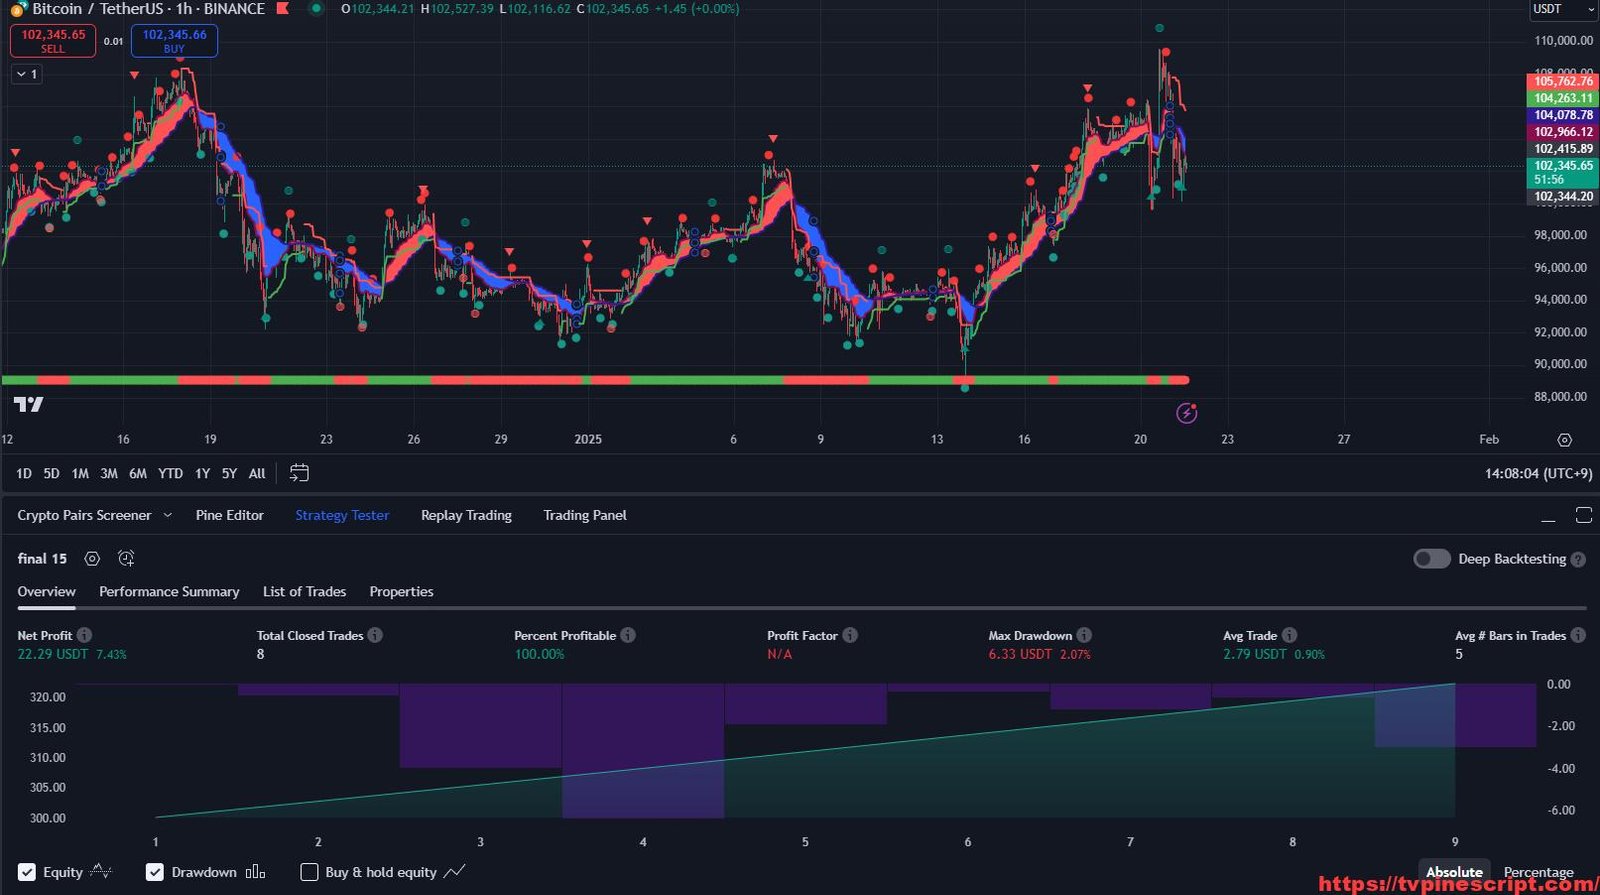
Final 15 Strategy: A Comprehensive Trading System Combining Adaptive Indicators
January 21, 2025 | by admin