Kamaljeet Rai – Advanced Strategy: EMA Cloud and ATR-Driven Trading Insights
January 14, 2025 | by admin
Key Features of the Script:
- Responsive EMA Cloud:
- Uses six configurable EMA periods to track short- and long-term trends dynamically.
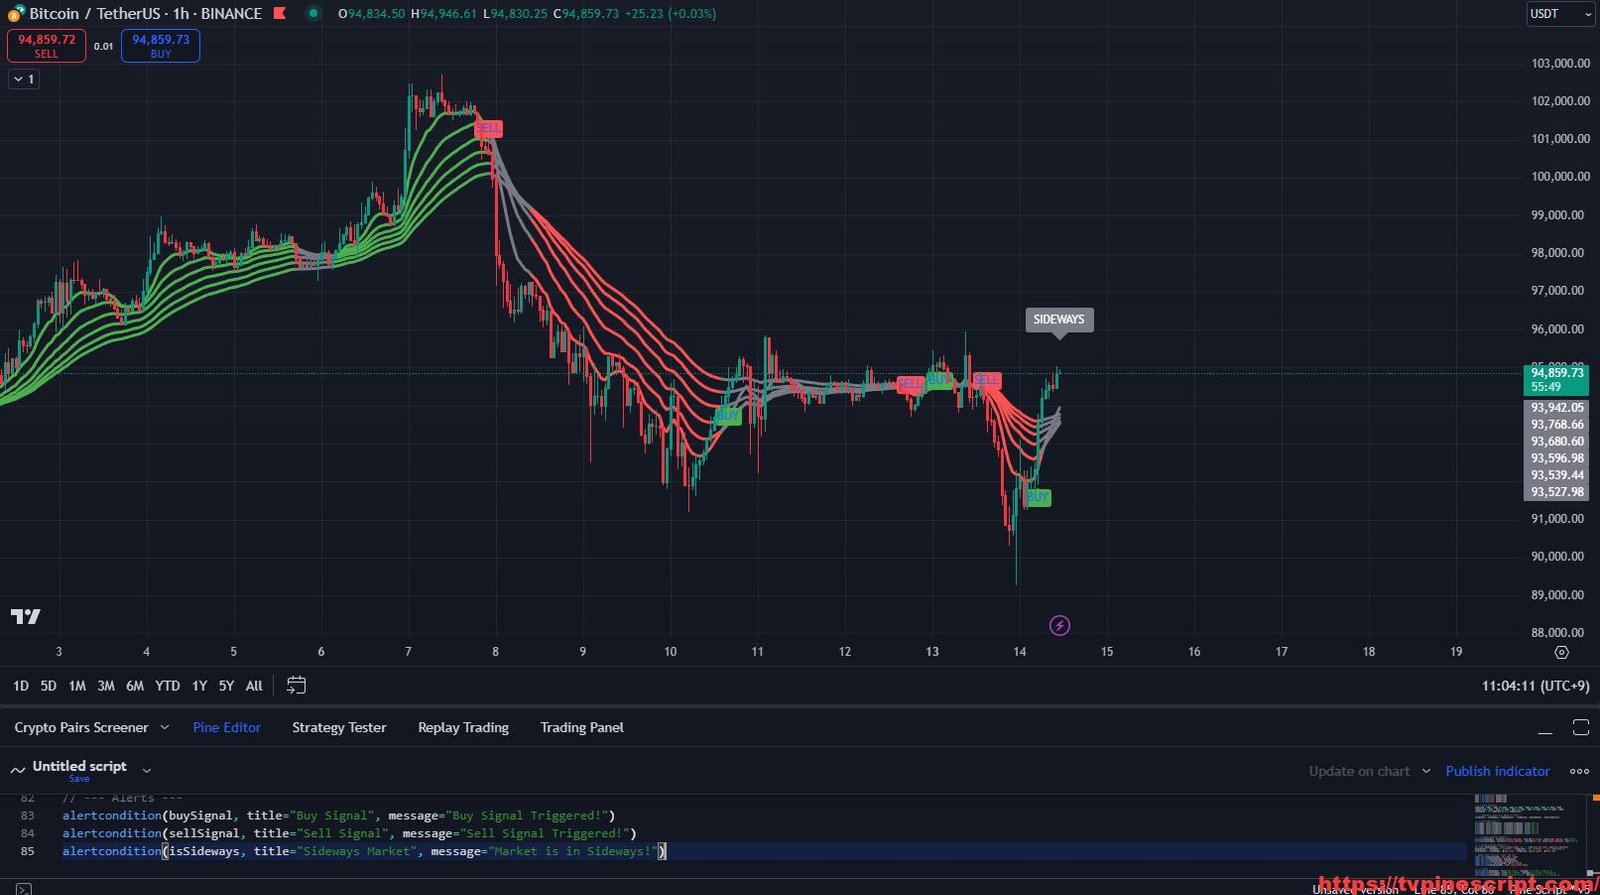
- Visualizes trends with color-coded cloud overlays (green for uptrend, red for downtrend, gray for sideways).
- ATR-Based Chandelier Exit:
- Implements a Chandelier Exit system using ATR to determine stop-loss levels.
- Dynamically updates long and short stops based on price movements and volatility.
- Dynamic Trend Detection:
- Identifies uptrends, downtrends, and sideways markets based on EMA alignment.
- Provides clear visual cues for current market conditions.
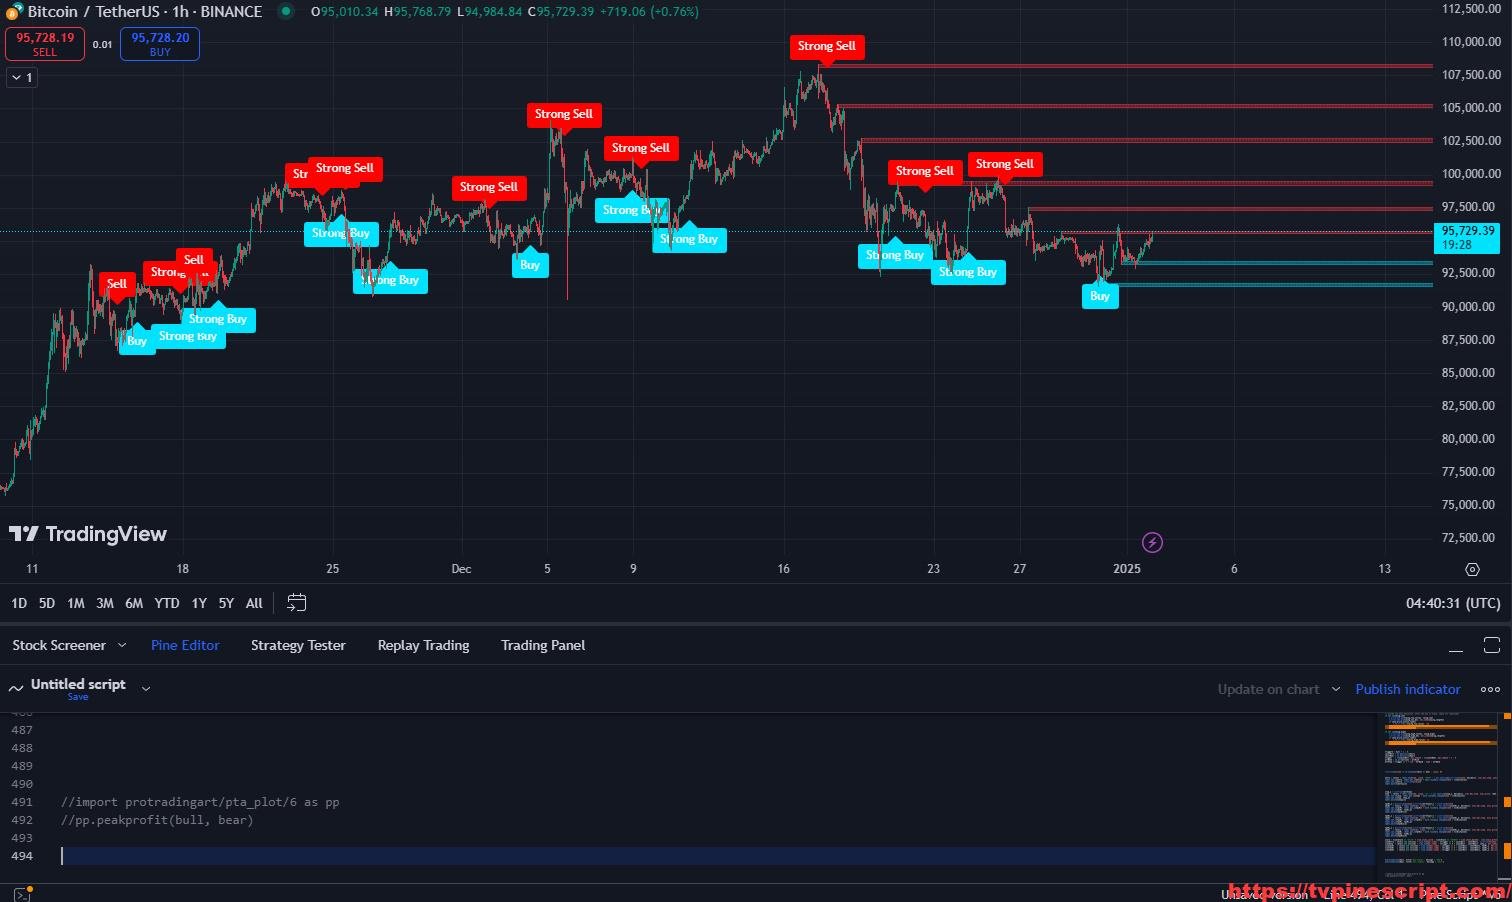
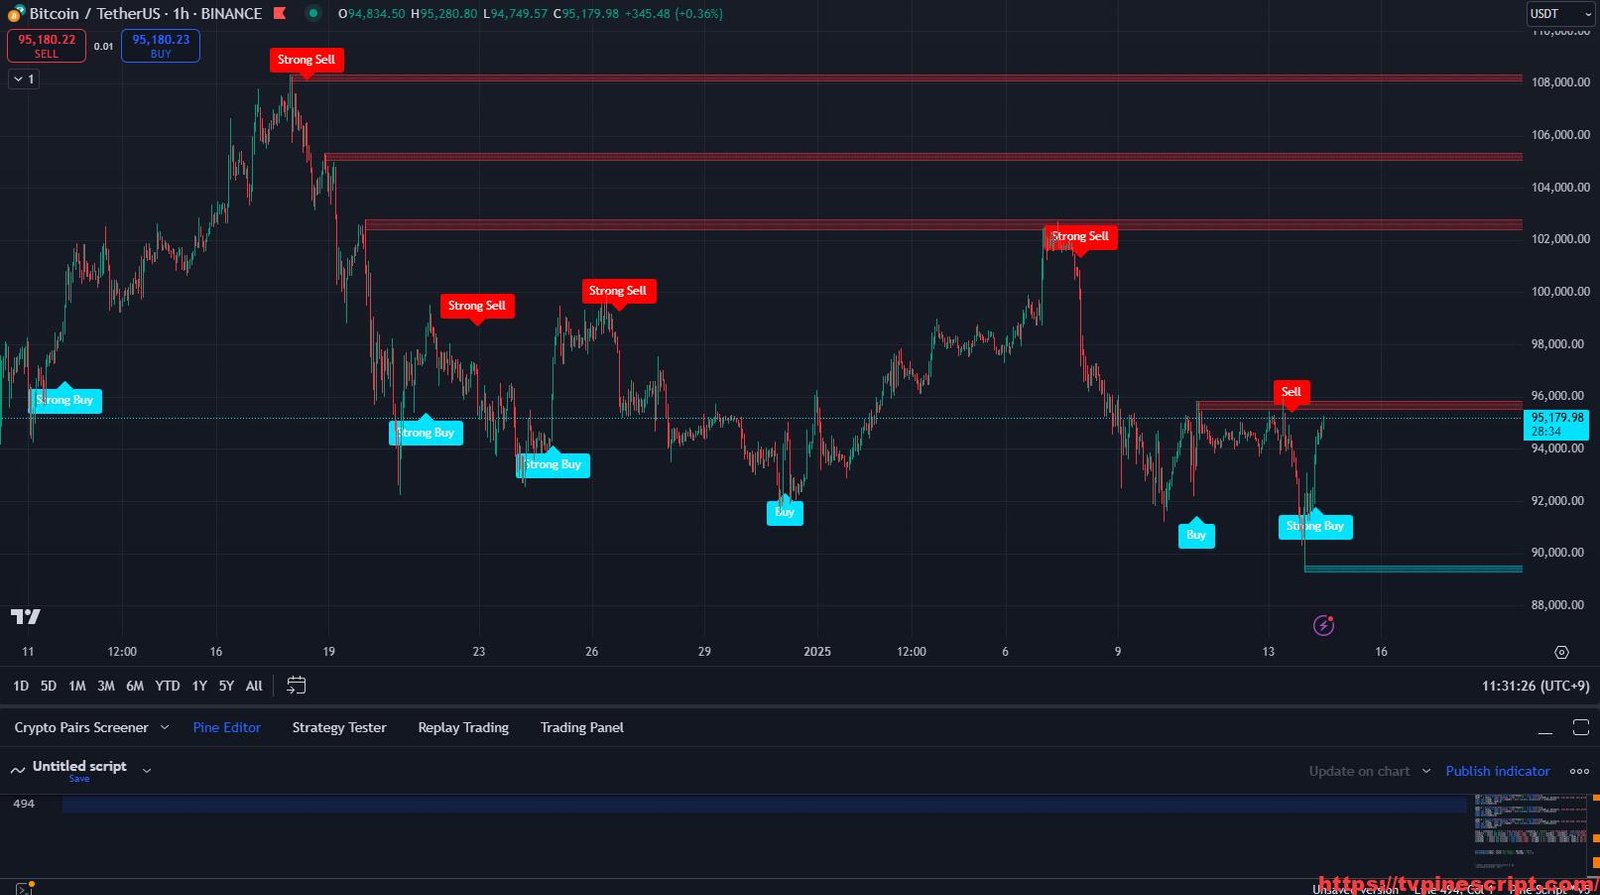
- Buy/Sell Signal Alerts:
- Generates buy signals when the market shifts from a downtrend to an uptrend.
- Generates sell signals when the market transitions from an uptrend to a downtrend.
- Custom Visualization:
- Customizable line widths and colors for EMAs, trend labels, and signals.
- Display labels for market conditions, including “SIDEWAYS,” “BUY,” and “SELL,” with visual clarity.
- Real-Time Alerts:
- Alerts for buy and sell signals as well as sideways market conditions.
- Configurable notifications to stay informed during live trading.
Recommended Usage:
- Scalping:
- Best suited for 5-minute to 15-minute charts.
- Utilize EMA crossovers and ATR stops for rapid trade decisions during volatile sessions.
- Swing Trading:
- Effective on 1-hour to daily charts.
- Leverage long-term EMA trends and ATR-based stops to capture macro trends.
- Risk Management:
- Use ATR-based Chandelier Exit levels to manage stop-loss dynamically.
- Combine trend detection with buy/sell signals for high-confidence entries and exits.
- Trend Confirmation:
- Align short-term signals with long-term EMA trends for optimal results.
- Monitor sideways conditions to avoid low-volatility ranges.
Script Evaluation:
- Functionality: 4.8/5
A versatile tool that integrates EMA clouds, ATR stops, and dynamic trend detection for various trading styles. - Ease of Use: 4.2/5
The extensive customization options may require a learning curve for beginners. Clear documentation would improve accessibility. - Accuracy: 4.7/5
Reliable signals when used with appropriate configurations and timeframe alignments. - Repainting Analysis:
This script does not repaint. All calculations and signals rely on confirmed bar data, ensuring consistency and reliability in both real-time and backtesting scenarios. - Optimal Timeframes:
- Scalping: 5-minute to 15-minute charts.
- Swing Trading: 1-hour to daily charts.
- Author and Development Quality:
Developed by Kamaljeet Rai, this script demonstrates advanced coding techniques and a clear understanding of trend-following strategies. Minor optimizations could further enhance its performance for high-frequency data. - Overall Score: 4.6/5
A robust tool suitable for traders seeking precision and dynamic risk management across multiple timeframes.
//@version=5
indicator("Kamaljeet Rai - Advanced Strategy", shorttitle="CE+Responsive EMA Cloud", overlay=true)

// --- Inputs for EMA Cloud Settings ---
var string emaGroup = 'EMA Cloud Settings'
ema1Period = input.int(10, title="EMA 1 Period", group=emaGroup)
ema2Period = input.int(20, title="EMA 2 Period", group=emaGroup)
ema3Period = input.int(30, title="EMA 3 Period", group=emaGroup)
ema4Period = input.int(40, title="EMA 4 Period", group=emaGroup)
ema5Period = input.int(50, title="EMA 5 Period", group=emaGroup)
ema6Period = input.int(60, title="EMA 6 Period", group=emaGroup)
lineWidth = input.int(3, title="Cloud Line Width", minval=1, maxval=5, group=emaGroup)
sidewaysColor = input.color(color.gray, title="Sideways Market Color", group=emaGroup)
uptrendColor = input.color(color.new(color.green, 0), title="Uptrend Color", group=emaGroup)
downtrendColor = input.color(color.new(color.red, 0), title="Downtrend Color", group=emaGroup)

// --- Inputs for ATR and Chandelier Exit ---
var string calcGroup = 'Calculation'
length = input.int(title='ATR Period', defval=22, group=calcGroup)
mult = input.float(title='ATR Multiplier', step=0.1, defval=3.0, group=calcGroup)
useClose = input.bool(title='Use Close Price for Extremes', defval=true, group=calcGroup)

// --- ATR and Chandelier Exit Calculation ---
atr = ta.atr(length) * mult
longStop = (useClose ? ta.highest(close, length) : ta.highest(length)) - atr
longStopPrev = nz(longStop[1], longStop)
longStop := close[1] > longStopPrev ? math.max(longStop, longStopPrev) : longStop

shortStop = (useClose ? ta.lowest(close, length) : ta.lowest(length)) + atr
shortStopPrev = nz(shortStop[1], shortStop)
shortStop := close[1] < shortStopPrev ? math.min(shortStop, shortStopPrev) : shortStop

var int dir = 1
dir := close > shortStopPrev ? 1 : close < longStopPrev ? -1 : dir

buySignal = (dir == 1 and dir[1] == -1) // Direction switch to BUY
sellSignal = (dir == -1 and dir[1] == 1) // Direction switch to SELL

// --- EMA Cloud Calculation ---
ema1 = ta.ema(close, ema1Period)
ema2 = ta.ema(close, ema2Period)
ema3 = ta.ema(close, ema3Period)
ema4 = ta.ema(close, ema4Period)
ema5 = ta.ema(close, ema5Period)
ema6 = ta.ema(close, ema6Period)

// --- Trend Detection ---
isUptrend = ema1 > ema2 and ema2 > ema3 and ema3 > ema4 and ema4 > ema5 and ema5 > ema6
isDowntrend = ema1 < ema2 and ema2 < ema3 and ema3 < ema4 and ema4 < ema5 and ema5 < ema6
isSideways = not isUptrend and not isDowntrend

// --- Determine Cloud Color Based on Trend ---
cloudColor = isSideways ? sidewaysColor : (isUptrend ? uptrendColor : downtrendColor)

// --- Plot EMA Cloud ---
plot(ema1, color=cloudColor, linewidth=lineWidth, title="EMA 1")
plot(ema2, color=cloudColor, linewidth=lineWidth, title="EMA 2")
plot(ema3, color=cloudColor, linewidth=lineWidth, title="EMA 3")
plot(ema4, color=cloudColor, linewidth=lineWidth, title="EMA 4")
plot(ema5, color=cloudColor, linewidth=lineWidth, title="EMA 5")
plot(ema6, color=cloudColor, linewidth=lineWidth, title="EMA 6")

// --- Display Buy/Sell Signals ---
plotshape(buySignal, location=location.belowbar, color=color.green, style=shape.labelup, text="BUY")
plotshape(sellSignal, location=location.abovebar, color=color.red, style=shape.labeldown, text="SELL")

// --- Display Market Condition ---
var label displayLabel = label.new(bar_index, na, "", xloc=xloc.bar_index, yloc=yloc.abovebar)
displayText = isSideways ? "SIDEWAYS" : (isUptrend ? "BUY (UPTREND)" : "SELL (DOWNTREND)")
displayColor = isSideways ? color.gray : (isUptrend ? color.green : color.red)

// Update label position, color, and text
label.set_xy(displayLabel, bar_index, high)
label.set_text(displayLabel, displayText)
label.set_color(displayLabel, displayColor)
label.set_textcolor(displayLabel, color.white)
label.set_style(displayLabel, label.style_label_down)

// --- Alerts ---
alertcondition(buySignal, title="Buy Signal", message="Buy Signal Triggered!")
alertcondition(sellSignal, title="Sell Signal", message="Sell Signal Triggered!")
alertcondition(isSideways, title="Sideways Market", message="Market is in Sideways!")
How to Apply Pine Script in TradingView:
- Open TradingView and log in.
- Navigate to the Pine Script Editor at the bottom of the screen.
- Copy the provided Pine Script code.
- Paste it into the editor and click Save.
- Name the script, e.g., “Kamaljeet Rai – Advanced Strategy.”
- Click Add to Chart to apply the script.
- Customize settings via the indicator panel to align with your trading preferences.
Final Verdict:
The Kamaljeet Rai – Advanced Strategy script is a feature-rich tool that combines EMA-based trend analysis, ATR-driven risk management, and dynamic alerts. Its non-repainting nature ensures consistent and actionable insights, making it suitable for both scalping and swing trading. While it may require some time to master, the script’s depth and flexibility make it a valuable addition to any trader’s toolkit.
RELATED POSTS
View all
Frost Algo Version 3.0 – R-Engineered: Advanced Trading Insights for Modern Traders
January 3, 2025 | by admin
Frost Algo v3.0 : Advanced Multi-Indicator Trading System with Dynamic Risk Management
January 14, 2025 | by admin
Market Strength Analyzer: A Comprehensive Indicator for Market Trends and Volume Dynamics
January 27, 2025 | by admin