KARALYTIX Options SuperNova v1.0: Comprehensive Market Levels and Volatility Analysis Tool
January 14, 2025 | by admin
Key Features of the Script:
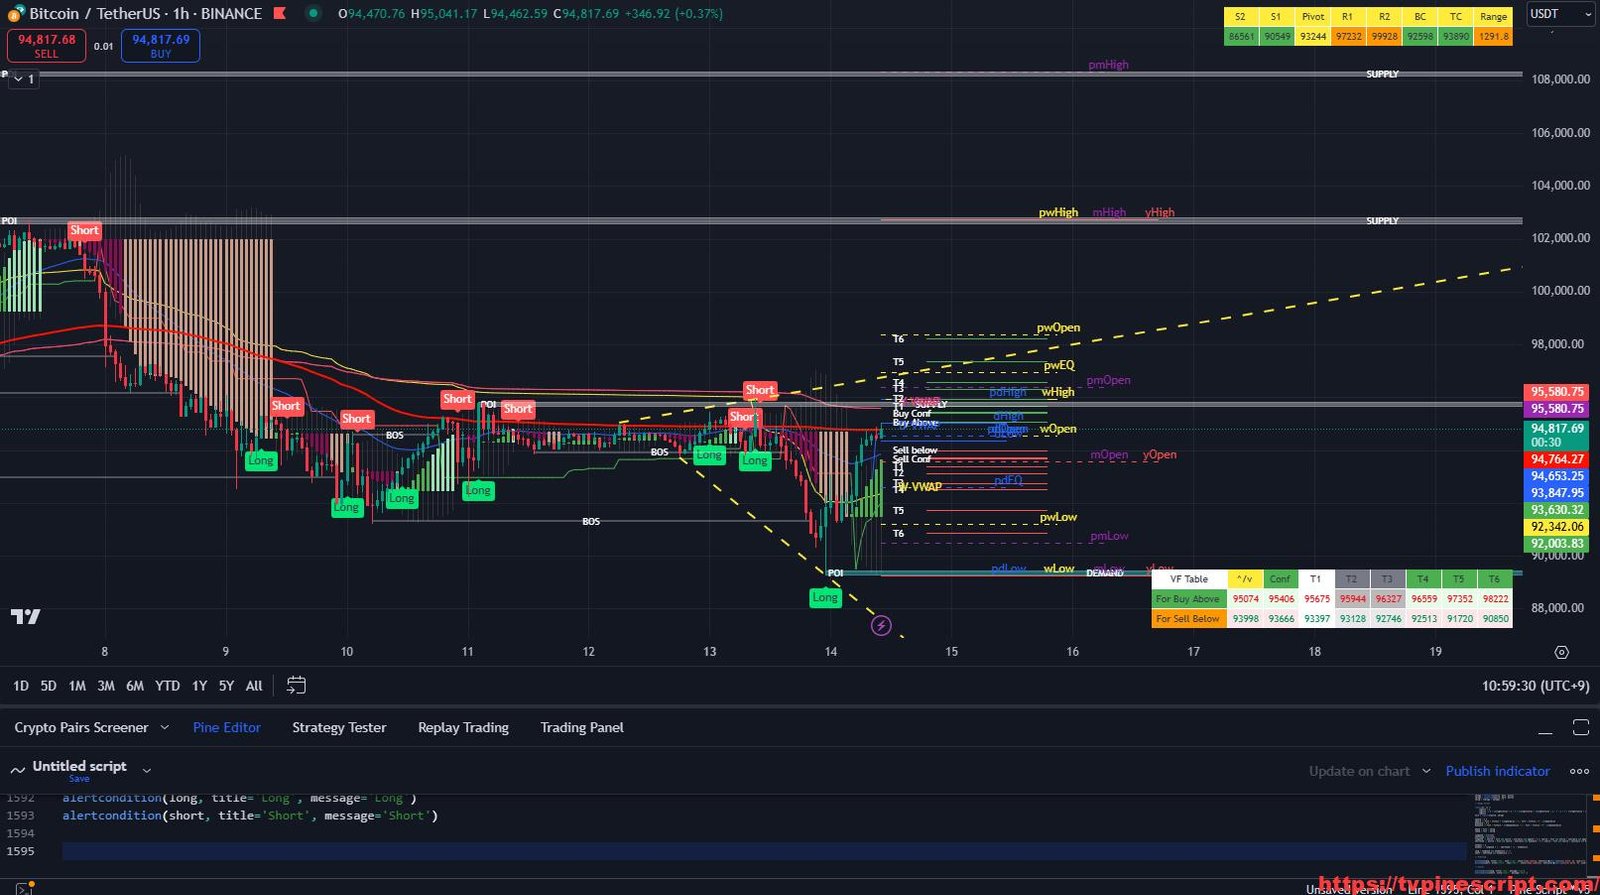
- Multi-Timeframe Support and Resistance (MTF S/R):
- Plots significant daily, weekly, monthly, and yearly open, high, low, and equilibrium levels.
- Allows customization of line styles, colors, and extensions for different timeframes.
- VWAP Integration:
- Incorporates Daily, Weekly, Monthly, and Yearly VWAPs for volume-weighted trend analysis.
- Clearly labeled and color-coded for easy identification.
- ATR and Volatility Calculations:
- Computes volatility and ranges based on historical price movement.
- Generates buy/sell confirmation levels and Fibonacci-derived target levels (T1 to T6).
- Pivot Points and Key Levels:
- Calculates pivot points, resistance (R1, R2), and support (S1, S2) levels.
- Displays pivot-related metrics in a user-friendly table.
- SuperTrend and EMA Indicators:
- Integrates SuperTrend and EMA indicators for additional trend-following insights.
- Allows user-defined settings for factor and periods.
- Customizable Visuals and Alerts:
- Fully customizable labels, line extensions, and tooltips for tailored analysis.
- Includes real-time alerts for critical market conditions.
- Support for Multiple Timeframes:
- Optimized for intraday (5m, 15m) and higher timeframes (1h, 4h, daily).
- Aligns lower timeframe setups with higher timeframe market trends.
Recommended Usage:
- Scalping:
- Best suited for 5-minute to 15-minute charts.
- Use Daily VWAPs and SuperTrend signals for quick trade setups.
- Swing Trading:
- Effective on 1-hour to 4-hour charts.
- Combine pivot points and VWAP analysis to plan longer-term trades.
- Intraday Trading:
- Utilize key levels and intraday VWAP for precise entries and exits.
- Leverage volatility ranges for adjusting risk/reward parameters.
- Risk Management:
- Employ ATR-based stop-loss and target levels to maintain disciplined trading.
- Monitor equilibrium levels and pivot ranges for trade adjustments.
Script Evaluation:
- Functionality: 4.8/5
This script excels in multi-timeframe support, VWAP integration, and volatility analysis, making it a robust tool for various trading styles. - Ease of Use: 4.3/5
While the abundance of features is advantageous, beginners may need time to understand its full potential. Clearer documentation would improve usability. - Accuracy: 4.7/5
Reliable key levels and signal generation ensure effective trade setups when used with appropriate timeframes. - Repainting Analysis:
This script does not repaint. All calculations are based on confirmed bar data, making it suitable for backtesting and live trading. - Optimal Timeframes:
- Scalping: 5-minute to 15-minute charts.
- Swing Trading: 1-hour to 4-hour charts.
- Author and Development Quality:
Developed by Frien_dd, the script demonstrates a high level of technical expertise. However, some redundant elements could be streamlined for better performance. - Overall Score: 4.7/5
A highly adaptable tool for traders focusing on precision and multi-timeframe alignment. Ideal for intermediate to advanced users.
//@version=5
indicator('karaLytix - Options SuperNova_v1.0', shorttitle='karaLytix - OSN_v1.0_Major', overlay=true)

showMTFSR = input(title='Show MTFSR', defval=true, group = '===== MTF S/R =====')

// Daily Lines
showdOpen = input.bool(true, title='. O', group='Daily Levels', inline='1')
showdHigh = input.bool(true, title='. H', group='Daily Levels', inline='1')
showdLow = input.bool(true, title='. L', group='Daily Levels', inline='1')

showpdOpen = input.bool(true, title='. pO', group='Daily Levels', inline='1')
showpdHigh = input.bool(true, title='. pH', group='Daily Levels', inline='1')
showpdLow = input.bool(true, title='. pL', group='Daily Levels', inline='1')
showpdEQ = input.bool(true, title='. pEQ', group='Daily Levels', inline='1', tooltip='p = previous, O = Open, H = High, L = Low, EQ = Equilibrium (50%)')


// Weekly Lines
showwOpen = input.bool(true, title='. O', group='Weekly Levels', inline='1')
showwHigh = input.bool(true, title='. H', group='Weekly Levels', inline='1')
showwLow = input.bool(true, title='. L', group='Weekly Levels', inline='1')

showpwOpen = input.bool(true, title='. pO', group='Weekly Levels', inline='1')
showpwHigh = input.bool(true, title='. pH', group='Weekly Levels', inline='1')
showpwLow = input.bool(true, title='. pL', group='Weekly Levels', inline='1')
showpwEQ = input.bool(true, title='. pEQ', group='Weekly Levels', inline='1', tooltip='p = previous, O = Open, H = High, L = Low, EQ = Equilibrium (50%)')


// Monthly Lines
showmOpen = input.bool(true, title='- O', group='Monthly Levels', inline='1')
showmHigh = input.bool(true, title='- H', group='Monthly Levels', inline='1')
showmLow = input.bool(true, title='- L', group='Monthly Levels', inline='1')

showpmOpen = input.bool(true, title='. pO', group='Monthly Levels', inline='1')
showpmHigh = input.bool(true, title='. pH', group='Monthly Levels', inline='1')
showpmLow = input.bool(true, title='. pL', group='Monthly Levels', inline='1', tooltip='p = previous, O = Open, H = High, L = Low')


// Yealy Lines
showyOpen = input.bool(true, title='. O', group='Yearly Levels', inline='1')
showyHigh = input.bool(true, title='. H', group='Yearly Levels', inline='1')
showyLow = input.bool(true, title='. L', group='Yearly Levels', inline='1', tooltip='O = Open, H = High, L = Low')


// VWAPS
show_DVWAPs = input.bool(true, title='Daily', group='Standard VWAPS - Daily, Weekly, Monthly', inline='VWAP1')
show_WVWAPs = input.bool(true, title='Weekly', group='Standard VWAPS - Daily, Weekly, Monthly', inline='VWAP1')
show_MVWAPs = input.bool(true, title='Monthly', group='Standard VWAPS - Daily, Weekly, Monthly', inline='VWAP1')
show_YVWAPs = input.bool(true, title='Yearly', group='Standard VWAPS - Daily, Weekly, Monthly', inline='VWAP1', tooltip='M-VWAP and Y-VWAP only shows on higher time frames')


var DSpaces = '                                             '
var DPSpaces = '                                                                         '
var DNoSpaces = ' '
var DPNoSpaces = '                                      '


var WSpaces = '                                                                                                        '
var WPSpaces = '                                                                                                                                        '
var WNoSpaces = ' '
var WPNoSpaces = '                                      '


var MSpaces = '                                                                                                                                                                           '
var MPSpaces = '                                                                                                                                                                                                      '
var MNoSpaces = ' '
var MPNoSpaces = '                                      '


var YSpaces = '                                                                                                                                                                                                                                       '
var YPSpaces = '                                                                                                                                                                                                                                                                 '
var YNoSpaces = ' '
var YPNoSpaces = '                                      '

x1 = ta.valuewhen(barstate.islast, bar_index, 0)

D_extend_length = input.int(25, title='Extend Daily short line', group='Line Options', inline='1')
D_x2 = x1 + D_extend_length

W_extend_length = input.int(35, title='Extend Weekly short line', group='Line Options', inline='1')
W_x2 = x1 + W_extend_length

M_extend_length = input.int(45, title='Extend Monthly short line', group='Line Options', inline='1')
M_x2 = x1 + M_extend_length

Y_extend_length = input.int(55, title='Extend Yearly short line', group='Line Options', inline='1')
Y_x2 = x1 + Y_extend_length


//Round of Line Value
f_round_up_to_tick(x, mintick) =>
    mult = 1 / mintick
    value = math.ceil(x * mult) / mult
    value

// Line Options
extend = extend.none
exnone = input.bool(true, title='Short Line', group='Line Options', inline='2')
exboth = input.bool(false, title='Line Across Screen', group='Line Options', inline='3')
exright = input.bool(false, title='Line To Right', group='Line Options', inline='3')
showPrice = input.bool(false, title='Show Level Prices', group='Line Options', inline='4')
showVPrice = input.bool(false, title='Show VWAP Prices', group='Line Options', inline='4')

extend := exnone ? extend.none : exboth ? extend.both : exright ? extend.right : extend

D_x2loc = D_x2
D_x2loc := exnone ? D_x2 : exboth ? bar_index : exright ? bar_index : D_x2loc

W_x2loc = W_x2
W_x2loc := exnone ? W_x2 : exboth ? bar_index : exright ? bar_index : W_x2loc

M_x2loc = M_x2
M_x2loc := exnone ? M_x2 : exboth ? bar_index : exright ? bar_index : M_x2loc


Y_x2loc = Y_x2
Y_x2loc := exnone ? Y_x2 : exboth ? bar_index : exright ? bar_index : Y_x2loc


DailySpaces = DNoSpaces
DailySpaces := exnone ? DNoSpaces : exboth ? DSpaces : exright ? DSpaces : DailySpaces
DailyPSpaces = DPNoSpaces
DailyPSpaces := exnone ? DPNoSpaces : exboth ? DPSpaces : exright ? DPSpaces : DailyPSpaces

WeeklySpaces = WNoSpaces
WeeklySpaces := exnone ? WNoSpaces : exboth ? WSpaces : exright ? WSpaces : WeeklySpaces
WeeklyPSpaces = WPNoSpaces
WeeklyPSpaces := exnone ? WPNoSpaces : exboth ? WPSpaces : exright ? WPSpaces : WeeklyPSpaces

MonthlySpaces = MNoSpaces
MonthlySpaces := exnone ? MNoSpaces : exboth ? MSpaces : exright ? MSpaces : MonthlySpaces
MonthlyPSpaces = MPNoSpaces
MonthlyPSpaces := exnone ? MPNoSpaces : exboth ? MPSpaces : exright ? MPSpaces : MonthlyPSpaces

YearlySpaces = YNoSpaces
YearlySpaces := exnone ? YNoSpaces : exboth ? YSpaces : exright ? YSpaces : YearlySpaces
YearlyPSpaces = YPNoSpaces
YearlyPSpaces := exnone ? YPNoSpaces : exboth ? YPSpaces : exright ? YPSpaces : YearlyPSpaces

//Line Colors
DailyInputColor = input.color(color.blue, title='Daily', group='User Selectable Line Colors', inline='Input 0')
WeeklyInputColor = input.color(color.yellow, title='Weekly', group='User Selectable Line Colors', inline='Input 0')
MonthlyInputColor = input.color(color.purple, title='Monthly', group='User Selectable Line Colors', inline='Input 1')
YearlyInputColor = input.color(color.red, title='Yearly', group='User Selectable Line Colors', inline='Input 1')

show_DVWAPs_color = show_DVWAPs ? DailyInputColor : na
show_WVWAPs_color = show_WVWAPs ? WeeklyInputColor : na
show_MVWAPs_color = show_MVWAPs ? MonthlyInputColor : na
show_YVWAPs_color = show_YVWAPs ? YearlyInputColor : na


//////////////////////////////////////
/////Previous Day Values//////////////
//////////////////////////////////////


// Previous Day Open
// showpdOpen = input(true, title="- pdOpen", group="pd Values", inline = "Daily")
pdOpen = request.security(syminfo.tickerid, 'D', open[1], lookahead=barmerge.lookahead_on)
var line pdOpenLine = na
var label pdOpenLabel = na
if showpdOpen
    pdOpenLine := line.new(x1=x1, y1=pdOpen, x2=D_x2, y2=pdOpen, xloc=xloc.bar_index, width=1, color=DailyInputColor, style=line.style_dashed, extend=extend)
    pdOpenLabel := label.new(D_x2loc, pdOpen, text=DailySpaces + 'pdOpen', color=DailyInputColor, textcolor=DailyInputColor, style=label.style_none, size=size.normal, xloc=xloc.bar_index, textalign=text.align_right)
    line.delete(pdOpenLine[1])
    label.delete(pdOpenLabel[1])


var label pdOpenLabelPrice = na
if showpdOpen and showPrice
    pdOpenLabelPrice := label.new(D_x2loc, pdOpen, text=DailyPSpaces + str.tostring(f_round_up_to_tick(pdOpen, syminfo.mintick)), color=DailyInputColor, textcolor=DailyInputColor, style=label.style_none, size=size.normal, xloc=xloc.bar_index, textalign=text.align_right)
    label.delete(pdOpenLabelPrice[1])

i_text1 = '₿ - Scripts by Frien_dd - ₿'


// Previous Day High
// showpdHigh = input(true, title="- pdHigh", group="pd Values", inline = "Daily")
pdHigh = request.security(syminfo.tickerid, 'D', high[1], lookahead=barmerge.lookahead_on)
var line pdHighLine = na
var label pdHighLabel = na
if showpdHigh
    pdHighLine := line.new(x1=x1, y1=pdHigh, x2=D_x2, y2=pdHigh, xloc=xloc.bar_index, width=1, color=DailyInputColor, style=line.style_dashed, extend=extend)
    pdHighLabel := label.new(D_x2loc, pdHigh, text=DailySpaces + 'pdHigh', color=DailyInputColor, textcolor=DailyInputColor, style=label.style_none, size=size.normal, xloc=xloc.bar_index, textalign=text.align_right)
    line.delete(pdHighLine[1])
    label.delete(pdHighLabel[1])

var label pdHighLabelPrice = na
if showpdHigh and showPrice
    pdHighLabelPrice := label.new(D_x2loc, pdHigh, text=DailyPSpaces + str.tostring(f_round_up_to_tick(pdHigh, syminfo.mintick)), color=DailyInputColor, textcolor=DailyInputColor, style=label.style_none, size=size.normal, xloc=xloc.bar_index, textalign=text.align_right)
    label.delete(pdHighLabelPrice[1])


// Previous Day Low
// showpdLow = input(true, title="- pdLow", group="pd Values", inline = "Daily")
pdLow = request.security(syminfo.tickerid, 'D', low[1], lookahead=barmerge.lookahead_on)
var line pdLowLine = na
var label pdLowLabel = na
if showpdLow
    pdLowLine := line.new(x1=x1, y1=pdLow, x2=D_x2, y2=pdLow, xloc=xloc.bar_index, width=1, color=DailyInputColor, style=line.style_dashed, extend=extend)
    pdLowLabel := label.new(D_x2loc, pdLow, text=DailySpaces + 'pdLow', color=DailyInputColor, textcolor=DailyInputColor, style=label.style_none, size=size.normal, xloc=xloc.bar_index, textalign=text.align_right)
    line.delete(pdLowLine[1])
    label.delete(pdLowLabel[1])

var label pdLowLabelPrice = na
if showpdLow and showPrice
    pdLowLabelPrice := label.new(D_x2loc, pdLow, text=DailyPSpaces + str.tostring(f_round_up_to_tick(pdLow, syminfo.mintick)), color=DailyInputColor, textcolor=DailyInputColor, style=label.style_none, size=size.normal, xloc=xloc.bar_index, textalign=text.align_right)
    label.delete(pdLowLabelPrice[1])


// Previous Day EQ
// showpdEQ = input(true, title="- pdEQ", group="pd Values", inline = "Daily")
pdEQ = (pdHigh + pdLow) / 2
var line pdEQLine = na
var label pdEQLabel = na
if showpdEQ
    pdEQLine := line.new(x1=x1, y1=pdEQ, x2=D_x2, y2=pdEQ, xloc=xloc.bar_index, width=1, color=DailyInputColor, style=line.style_dashed, extend=extend)
    pdEQLabel := label.new(D_x2loc, pdEQ, text=DailySpaces + 'pdEQ', color=DailyInputColor, textcolor=DailyInputColor, style=label.style_none, size=size.normal, xloc=xloc.bar_index, textalign=text.align_right)
    line.delete(pdEQLine[1])
    label.delete(pdEQLabel[1])

var label pdEQLabelPrice = na
if showpdEQ and showPrice
    pdEQLabelPrice := label.new(D_x2loc, pdEQ, text=DailyPSpaces + str.tostring(f_round_up_to_tick(pdEQ, syminfo.mintick)), color=DailyInputColor, textcolor=DailyInputColor, style=label.style_none, size=size.normal, xloc=xloc.bar_index, textalign=text.align_right)
    label.delete(pdEQLabelPrice[1])


//////////////////////////////////////
/////Previous Week Values//////////////
//////////////////////////////////////

// Previous Week Open
// showpwOpen = input(true, title="- pwOpen", group="pw Values", inline = "Weekly")
pwOpen = request.security(syminfo.tickerid, 'W', open[1], lookahead=barmerge.lookahead_on)
var line pwOpenLine = na
var label pwOpenLabel = na
if showpwOpen
    pwOpenLine := line.new(x1=x1, y1=pwOpen, x2=W_x2, y2=pwOpen, xloc=xloc.bar_index, width=1, color=WeeklyInputColor, style=line.style_dashed, extend=extend)
    pwOpenLabel := label.new(W_x2loc, pwOpen, text=WeeklySpaces + 'pwOpen', color=WeeklyInputColor, textcolor=WeeklyInputColor, style=label.style_none, size=size.normal, xloc=xloc.bar_index, textalign=text.align_right)
    line.delete(pwOpenLine[1])
    label.delete(pwOpenLabel[1])

var label pwOpenLabelPrice = na
if showpwOpen and showPrice
    pwOpenLabelPrice := label.new(W_x2loc, pwOpen, text=WeeklyPSpaces + str.tostring(f_round_up_to_tick(pwOpen, syminfo.mintick)), color=WeeklyInputColor, textcolor=WeeklyInputColor, style=label.style_none, size=size.normal, xloc=xloc.bar_index, textalign=text.align_right)
    label.delete(pwOpenLabelPrice[1])


// Previous Week High
// showpwHigh = input(true, title="- pwHigh", group="pw Values", inline = "Weekly")
pwHigh = request.security(syminfo.tickerid, 'W', high[1], lookahead=barmerge.lookahead_on)
var line pwHighLine = na
var label pwHighLabel = na
if showpwHigh
    pwHighLine := line.new(x1=x1, y1=pwHigh, x2=W_x2, y2=pwHigh, xloc=xloc.bar_index, width=1, color=WeeklyInputColor, style=line.style_dashed, extend=extend)
    pwHighLabel := label.new(W_x2loc, pwHigh, text=WeeklySpaces + 'pwHigh', color=WeeklyInputColor, textcolor=WeeklyInputColor, style=label.style_none, size=size.normal, xloc=xloc.bar_index, textalign=text.align_right)
    line.delete(pwHighLine[1])
    label.delete(pwHighLabel[1])

var label pwHighLabelPrice = na
if showpwHigh and showPrice
    pwHighLabelPrice := label.new(W_x2loc, pwHigh, text=WeeklyPSpaces + str.tostring(f_round_up_to_tick(pwHigh, syminfo.mintick)), color=WeeklyInputColor, textcolor=WeeklyInputColor, style=label.style_none, size=size.normal, xloc=xloc.bar_index, textalign=text.align_right)
    label.delete(pwHighLabelPrice[1])


// Previous Week Low
// showpwLow = input(true, title="- pwLow", group="pw Values", inline = "Weekly")
pwLow = request.security(syminfo.tickerid, 'W', low[1], lookahead=barmerge.lookahead_on)
var line pwLowLine = na
var label pwLowLabel = na
if showpwLow
    pwLowLine := line.new(x1=x1, y1=pwLow, x2=W_x2, y2=pwLow, xloc=xloc.bar_index, width=1, color=WeeklyInputColor, style=line.style_dashed, extend=extend)
    pwLowLabel := label.new(W_x2loc, pwLow, text=WeeklySpaces + 'pwLow', color=WeeklyInputColor, textcolor=WeeklyInputColor, style=label.style_none, size=size.normal, xloc=xloc.bar_index, textalign=text.align_right)
    line.delete(pwLowLine[1])
    label.delete(pwLowLabel[1])

var label pwLowLabelPrice = na
if showpwLow and showPrice
    pwLowLabelPrice := label.new(W_x2loc, pwLow, text=WeeklyPSpaces + str.tostring(f_round_up_to_tick(pwLow, syminfo.mintick)), color=WeeklyInputColor, textcolor=WeeklyInputColor, style=label.style_none, size=size.normal, xloc=xloc.bar_index, textalign=text.align_right)
    label.delete(pwLowLabelPrice[1])


// Previous Week EQ
// showpwEQ = input(true, title="- pwEQ", group="pw Values", inline = "Weekly")a
pwEQ = (pwHigh + pwLow) / 2
var line pwEQLine = na
var label pwEQLabel = na
if showpwEQ
    pwEQLine := line.new(x1=x1, y1=pwEQ, x2=W_x2, y2=pwEQ, xloc=xloc.bar_index, width=1, color=WeeklyInputColor, style=line.style_dashed, extend=extend)
    pwEQLabel := label.new(W_x2loc, pwEQ, text=WeeklySpaces + 'pwEQ', color=WeeklyInputColor, textcolor=WeeklyInputColor, style=label.style_none, size=size.normal, xloc=xloc.bar_index, textalign=text.align_right)
    line.delete(pwEQLine[1])
    label.delete(pwEQLabel[1])

var label pwEQLabelPrice = na
if showpwEQ and showPrice
    pwEQLabelPrice := label.new(W_x2loc, pwEQ, text=WeeklyPSpaces + str.tostring(f_round_up_to_tick(pwEQ, syminfo.mintick)), color=WeeklyInputColor, textcolor=WeeklyInputColor, style=label.style_none, size=size.normal, xloc=xloc.bar_index, textalign=text.align_right)
    label.delete(pwEQLabelPrice[1])


///////////////////////////////////////
/////Weekly Open-High-Low/////////////
//////////////////////////////////////

// Current Monthly Open
// showwOpen = input(true, title=". wOpen", group="Weekly Levels", inline = "1")
wOpen = request.security(syminfo.tickerid, 'W', open, lookahead=barmerge.lookahead_on)
var line wOpenLine = na
var label wOpenLabel = na
if showwOpen
    wOpenLine := line.new(x1=x1, y1=wOpen, x2=W_x2, y2=wOpen, xloc=xloc.bar_index, width=1, color=WeeklyInputColor, style=line.style_dashed, extend=extend)
    wOpenLabel := label.new(W_x2loc, wOpen, text=WeeklySpaces + 'wOpen', color=WeeklyInputColor, textcolor=WeeklyInputColor, style=label.style_none, size=size.normal, xloc=xloc.bar_index, textalign=text.align_right)
    line.delete(wOpenLine[1])
    label.delete(wOpenLabel[1])

var label wOpenLabelPrice = na
if showwOpen and showPrice
    wOpenLabelPrice := label.new(W_x2loc, wOpen, text=WeeklyPSpaces + str.tostring(f_round_up_to_tick(wOpen, syminfo.mintick)), color=WeeklyInputColor, textcolor=WeeklyInputColor, style=label.style_none, size=size.normal, xloc=xloc.bar_index, textalign=text.align_right)
    label.delete(wOpenLabelPrice[1])


// Weekly Low High Levels
var LastWeek = 0
var WeeklyHigh = 0.0
var WeeklyLow = 0.0

ThisWeek = time('W')
CheckWeek = ThisWeek != LastWeek
LastWeek := ThisWeek
WeeklyHigh := CheckWeek or high > WeeklyHigh ? high[0] : WeeklyHigh
WeeklyLow := CheckWeek or low < WeeklyLow ? low[0] : WeeklyLow


var line wLowLine = na
var label wLowLabel = na
// showwLow = input(true, title=". wLow", group="Weekly Levels", inline = "1")
if showwLow
    wLowLine := line.new(x1=x1, y1=WeeklyLow, x2=W_x2, y2=WeeklyLow, xloc=xloc.bar_index, width=1, color=WeeklyInputColor, style=line.style_solid, extend=extend)
    wLowLabel := label.new(W_x2loc, WeeklyLow, text=MonthlySpaces + 'wLow', color=WeeklyInputColor, textcolor=WeeklyInputColor, style=label.style_none, size=size.normal, xloc=xloc.bar_index, textalign=text.align_right)
    line.delete(wLowLine[1])
    label.delete(wLowLabel[1])

var label wLowLabelPrice = na
if showwLow and showPrice
    wLowLabelPrice := label.new(W_x2loc, WeeklyLow, text=WeeklyPSpaces + str.tostring(f_round_up_to_tick(WeeklyLow, syminfo.mintick)), color=WeeklyInputColor, textcolor=WeeklyInputColor, style=label.style_none, size=size.normal, xloc=xloc.bar_index, textalign=text.align_right)
    label.delete(wLowLabelPrice[1])


var line wHighLine = na
var label wHighLabel = na
// showwHigh = input(true, title=". wHigh", group="Weekly Levels", inline = "1")
if showwHigh
    wHighLine := line.new(x1=x1, y1=WeeklyHigh, x2=W_x2, y2=WeeklyHigh, xloc=xloc.bar_index, width=1, color=WeeklyInputColor, style=line.style_solid, extend=extend)
    wHighLabel := label.new(W_x2loc, WeeklyHigh, text=WeeklySpaces + 'wHigh', color=WeeklyInputColor, textcolor=WeeklyInputColor, style=label.style_none, size=size.normal, xloc=xloc.bar_index, textalign=text.align_right)
    line.delete(wHighLine[1])
    label.delete(wHighLabel[1])

var label wHighLabelPrice = na
if showwHigh and showPrice
    wHighLabelPrice := label.new(W_x2loc, WeeklyHigh, text=WeeklyPSpaces + str.tostring(f_round_up_to_tick(WeeklyHigh, syminfo.mintick)), color=WeeklyInputColor, textcolor=WeeklyInputColor, style=label.style_none, size=size.normal, xloc=xloc.bar_index, textalign=text.align_right)
    label.delete(wHighLabelPrice[1])


//////////////////////////////////////
/////Previous Month Values////////////
//////////////////////////////////////

// Previous Month Open
// showpmOpen = input(true, title="- pmOpen", group="pm Values", inline = "Monthly")
pmOpen = request.security(syminfo.tickerid, 'M', open[1], lookahead=barmerge.lookahead_on)
var line pmOpenLine = na
var label pmOpenLabel = na
if showpmOpen
    pmOpenLine := line.new(x1=x1, y1=pmOpen, x2=M_x2, y2=pmOpen, xloc=xloc.bar_index, width=1, color=MonthlyInputColor, style=line.style_dashed, extend=extend)
    pmOpenLabel := label.new(M_x2loc, pmOpen, text=MonthlySpaces + 'pmOpen', color=MonthlyInputColor, textcolor=MonthlyInputColor, style=label.style_none, size=size.normal, xloc=xloc.bar_index, textalign=text.align_right)
    line.delete(pmOpenLine[1])
    label.delete(pmOpenLabel[1])

var label pmOpenLabelPrice = na
if showpmOpen and showPrice
    pmOpenLabelPrice := label.new(M_x2loc, pmOpen, text=MonthlyPSpaces + str.tostring(f_round_up_to_tick(pmOpen, syminfo.mintick)), color=MonthlyInputColor, textcolor=MonthlyInputColor, style=label.style_none, size=size.normal, xloc=xloc.bar_index, textalign=text.align_right)
    label.delete(pmOpenLabelPrice[1])


// Previous Month High
// showpmHigh = input(true, title="- pmHigh", group="pm Values", inline = "Monthly")
pmHigh = request.security(syminfo.tickerid, 'M', high[1], lookahead=barmerge.lookahead_on)
var line pmHighLine = na
var label pmHighLabel = na
if showpmHigh
    pmHighLine := line.new(x1=x1, y1=pmHigh, x2=M_x2, y2=pmHigh, xloc=xloc.bar_index, width=1, color=MonthlyInputColor, style=line.style_dashed, extend=extend)
    pmHighLabel := label.new(M_x2loc, pmHigh, text=MonthlySpaces + 'pmHigh', color=MonthlyInputColor, textcolor=MonthlyInputColor, style=label.style_none, size=size.normal, xloc=xloc.bar_index, textalign=text.align_right)
    line.delete(pmHighLine[1])
    label.delete(pmHighLabel[1])

var label pmHighLabelPrice = na
if showpmHigh and showPrice
    pmHighLabelPrice := label.new(M_x2loc, pmHigh, text=MonthlyPSpaces + str.tostring(f_round_up_to_tick(pmHigh, syminfo.mintick)), color=MonthlyInputColor, textcolor=MonthlyInputColor, style=label.style_none, size=size.normal, xloc=xloc.bar_index, textalign=text.align_right)
    label.delete(pmHighLabelPrice[1])


// Previous Month Low
// showpmLow = input(true, title="- pmLow", group="pm Values", inline = "Monthly")
pmLow = request.security(syminfo.tickerid, 'M', low[1], lookahead=barmerge.lookahead_on)
var line pmLowLine = na
var label pmLowLabel = na
if showpmLow
    pmLowLine := line.new(x1=x1, y1=pmLow, x2=M_x2, y2=pmLow, xloc=xloc.bar_index, width=1, color=MonthlyInputColor, style=line.style_dashed, extend=extend)
    pmLowLabel := label.new(M_x2loc, pmLow, text=MonthlySpaces + 'pmLow', color=MonthlyInputColor, textcolor=MonthlyInputColor, style=label.style_none, size=size.normal, xloc=xloc.bar_index, textalign=text.align_right)
    line.delete(pmLowLine[1])
    label.delete(pmLowLabel[1])

var label pmLowLabelPrice = na
if showpmLow and showPrice
    pmLowLabelPrice := label.new(M_x2loc, pmLow, text=MonthlyPSpaces + str.tostring(f_round_up_to_tick(pmLow, syminfo.mintick)), color=MonthlyInputColor, textcolor=MonthlyInputColor, style=label.style_none, size=size.normal, xloc=xloc.bar_index, textalign=text.align_right)
    label.delete(pmLowLabelPrice[1])


//////////////////////////////////////
/////Daily Open///////////////////////
//////////////////////////////////////
// showdOpen = input(true, title="- dOpen", group="Current Daily", inline = "Daily")
dOpen = request.security(syminfo.tickerid, 'D', open, lookahead=barmerge.lookahead_on)
var line dOpenLine = na
var label dOpenLabel = na
if showdOpen
    dOpenLine := line.new(x1=x1, y1=dOpen, x2=D_x2, y2=dOpen, xloc=xloc.bar_index, width=1, color=DailyInputColor, style=line.style_dashed, extend=extend)
    dOpenLabel := label.new(D_x2loc, dOpen, text=DailySpaces + 'dOpen', color=DailyInputColor, textcolor=DailyInputColor, style=label.style_none, size=size.normal, xloc=xloc.bar_index, textalign=text.align_right)
    line.delete(dOpenLine[1])
    label.delete(dOpenLabel[1])

var label dOpenLabelPrice = na
if showdOpen and showPrice
    dOpenLabelPrice := label.new(D_x2loc, dOpen, text=DailyPSpaces + str.tostring(f_round_up_to_tick(dOpen, syminfo.mintick)), color=DailyInputColor, textcolor=DailyInputColor, style=label.style_none, size=size.normal, xloc=xloc.bar_index, textalign=text.align_right)
    label.delete(dOpenLabelPrice[1])

// Daily Low High Levels
var LastDay = 0
var DailyHigh = 0.0
var DailyLow = 0.0

ThisDay = time('D')
CheckDay = ThisDay != LastDay
LastDay := ThisDay
DailyHigh := CheckDay or high > DailyHigh ? high[0] : DailyHigh
DailyLow := CheckDay or low < DailyLow ? low[0] : DailyLow

// Daily Low and High
var line dLowLine = na
var label dLowLabel = na
// showdLow = input(true, title=". dLow", group="Daily Levels", inline = "1")
if showdLow
    dLowLine := line.new(x1=x1, y1=DailyLow, x2=D_x2, y2=DailyLow, xloc=xloc.bar_index, width=1, color=DailyInputColor, style=line.style_solid, extend=extend)
    dLowLabel := label.new(D_x2loc, DailyLow, text=DailySpaces + 'dLow', color=DailyInputColor, textcolor=DailyInputColor, style=label.style_none, size=size.normal, xloc=xloc.bar_index, textalign=text.align_right)
    line.delete(dLowLine[1])
    label.delete(dLowLabel[1])

var label dLowLabelPrice = na
if showdLow and showPrice
    dLowLabelPrice := label.new(D_x2loc, DailyLow, text=DailyPSpaces + str.tostring(f_round_up_to_tick(DailyLow, syminfo.mintick)), color=DailyInputColor, textcolor=DailyInputColor, style=label.style_none, size=size.normal, xloc=xloc.bar_index, textalign=text.align_right)
    label.delete(dLowLabelPrice[1])


var line dHighLine = na
var label dHighLabel = na
// showdHigh = input(true, title=". dHigh", group="Daily Levels", inline = "1")
if showdHigh
    dHighLine := line.new(x1=x1, y1=DailyHigh, x2=D_x2, y2=DailyHigh, xloc=xloc.bar_index, width=1, color=DailyInputColor, style=line.style_solid, extend=extend)
    dHighLabel := label.new(D_x2loc, DailyHigh, text=DailySpaces + 'dHigh', color=DailyInputColor, textcolor=DailyInputColor, style=label.style_none, size=size.normal, xloc=xloc.bar_index, textalign=text.align_right)
    line.delete(dHighLine[1])
    label.delete(dHighLabel[1])

var label dHighLabelPrice = na
if showdHigh and showPrice
    dHighLabelPrice := label.new(D_x2loc, DailyHigh, text=DailyPSpaces + str.tostring(f_round_up_to_tick(DailyHigh, syminfo.mintick)), color=DailyInputColor, textcolor=DailyInputColor, style=label.style_none, size=size.normal, xloc=xloc.bar_index, textalign=text.align_right)
    label.delete(dHighLabelPrice[1])

///////////////////////////////////////
/////Monthly Open-High-Low/////////////
//////////////////////////////////////

// Current Monthly Open
// showmOpen = input(true, title="- mOpen", group="Current Monthly", inline = "Monthly")
mOpen = request.security(syminfo.tickerid, 'M', open, lookahead=barmerge.lookahead_on)
var line mOpenLine = na
var label mOpenLabel = na
if showmOpen
    mOpenLine := line.new(x1=x1, y1=mOpen, x2=M_x2, y2=mOpen, xloc=xloc.bar_index, width=1, color=MonthlyInputColor, style=line.style_dashed, extend=extend)
    mOpenLabel := label.new(M_x2loc, mOpen, text=MonthlySpaces + 'mOpen', color=MonthlyInputColor, textcolor=MonthlyInputColor, style=label.style_none, size=size.normal, xloc=xloc.bar_index, textalign=text.align_right)
    line.delete(mOpenLine[1])
    label.delete(mOpenLabel[1])

var label mOpenLabelPrice = na
if showmOpen and showPrice
    mOpenLabelPrice := label.new(M_x2loc, mOpen, text=MonthlyPSpaces + str.tostring(f_round_up_to_tick(mOpen, syminfo.mintick)), color=MonthlyInputColor, textcolor=MonthlyInputColor, style=label.style_none, size=size.normal, xloc=xloc.bar_index, textalign=text.align_right)
    label.delete(mOpenLabelPrice[1])


// Current Monthly High
//Current Day High Low
var LastMonth = 0
var MonthlyHigh = 0.0
var MonthlyLow = 0.0

ThisMonth = time('M')
CheckMonth = ThisMonth != LastMonth
LastMonth := ThisMonth
MonthlyHigh := CheckMonth or high > MonthlyHigh ? high[0] : MonthlyHigh
MonthlyLow := CheckMonth or low < MonthlyLow ? low[0] : MonthlyLow


var line mLowLine = na
var label mLowLabel = na
// showmLow = input(true, title="- mLow", group="Current Monthly", inline = "Monthly")
if showmLow
    mLowLine := line.new(x1=x1, y1=MonthlyLow, x2=M_x2, y2=MonthlyLow, xloc=xloc.bar_index, width=1, color=MonthlyInputColor, style=line.style_solid, extend=extend)
    mLowLabel := label.new(M_x2loc, MonthlyLow, text=MonthlySpaces + 'mLow', color=MonthlyInputColor, textcolor=MonthlyInputColor, style=label.style_none, size=size.normal, xloc=xloc.bar_index, textalign=text.align_right)
    line.delete(mLowLine[1])
    label.delete(mLowLabel[1])

var label mLowLabelPrice = na
if showmLow and showPrice
    mLowLabelPrice := label.new(M_x2loc, MonthlyLow, text=MonthlyPSpaces + str.tostring(f_round_up_to_tick(MonthlyLow, syminfo.mintick)), color=MonthlyInputColor, textcolor=MonthlyInputColor, style=label.style_none, size=size.normal, xloc=xloc.bar_index, textalign=text.align_right)
    label.delete(mLowLabelPrice[1])


var line mHighLine = na
var label mHighLabel = na
// showmHigh = input(true, title="- mHigh", group="Current Monthly", inline = "Monthly")
if showmHigh
    mHighLine := line.new(x1=x1, y1=MonthlyHigh, x2=M_x2, y2=MonthlyHigh, xloc=xloc.bar_index, width=1, color=MonthlyInputColor, style=line.style_solid, extend=extend)
    mHighLabel := label.new(M_x2loc, MonthlyHigh, text=MonthlySpaces + 'mHigh', color=MonthlyInputColor, textcolor=MonthlyInputColor, style=label.style_none, size=size.normal, xloc=xloc.bar_index, textalign=text.align_right)
    line.delete(mHighLine[1])
    label.delete(mHighLabel[1])

var label mHighLabelPrice = na
if showmHigh and showPrice
    mHighLabelPrice := label.new(M_x2loc, MonthlyHigh, text=MonthlyPSpaces + str.tostring(f_round_up_to_tick(MonthlyHigh, syminfo.mintick)), color=MonthlyInputColor, textcolor=MonthlyInputColor, style=label.style_none, size=size.normal, xloc=xloc.bar_index, textalign=text.align_right)
    label.delete(mHighLabelPrice[1])

i_tableYpos = 'bottom'

///////////////////////////////////////
/////Yearly Open-High-Low/////////////
//////////////////////////////////////

// Current Yearly Open
// showyOpen = input(true, title="- yOpen", group="Current Yearly", inline = "Yearly")
yOpen = request.security(syminfo.tickerid, '12M', open, lookahead=barmerge.lookahead_on)
var line yOpenLine = na
var label yOpenLabel = na
if showyOpen
    yOpenLine := line.new(x1=x1, y1=yOpen, x2=Y_x2, y2=yOpen, xloc=xloc.bar_index, width=1, color=YearlyInputColor, style=line.style_dashed, extend=extend)
    yOpenLabel := label.new(Y_x2loc, yOpen, text=YearlySpaces + 'yOpen', color=YearlyInputColor, textcolor=YearlyInputColor, style=label.style_none, size=size.normal, xloc=xloc.bar_index, textalign=text.align_right)
    line.delete(yOpenLine[1])
    label.delete(yOpenLabel[1])

var label yOpenLabelPrice = na
if showyOpen and showPrice
    yOpenLabelPrice := label.new(Y_x2loc, yOpen, text=YearlyPSpaces + str.tostring(f_round_up_to_tick(yOpen, syminfo.mintick)), color=YearlyInputColor, textcolor=YearlyInputColor, style=label.style_none, size=size.normal, xloc=xloc.bar_index, textalign=text.align_right)
    label.delete(yOpenLabelPrice[1])


// Current Yearly High Low
var LastYear = 0
var YearlyHigh = 0.0
var YearlyLow = 0.0

ThisYear = time('12M')
CheckYear = ThisYear != LastYear
LastYear := ThisYear
YearlyHigh := CheckYear or high > YearlyHigh ? high[0] : YearlyHigh
YearlyLow := CheckYear or low < YearlyLow ? low[0] : YearlyLow
i_tableXpos = 'right'


var line yLowLine = na
var label yLowLabel = na
if showyLow
    yLowLine := line.new(x1=x1, y1=YearlyLow, x2=Y_x2, y2=YearlyLow, xloc=xloc.bar_index, width=1, color=YearlyInputColor, style=line.style_solid, extend=extend)
    yLowLabel := label.new(Y_x2loc, YearlyLow, text=YearlySpaces + 'yLow', color=YearlyInputColor, textcolor=YearlyInputColor, style=label.style_none, size=size.normal, xloc=xloc.bar_index, textalign=text.align_right)
    line.delete(yLowLine[1])
    label.delete(yLowLabel[1])

var label yLowLabelPrice = na
if showyLow and showPrice
    yLowLabelPrice := label.new(Y_x2loc, YearlyLow, text=YearlyPSpaces + str.tostring(f_round_up_to_tick(YearlyLow, syminfo.mintick)), color=YearlyInputColor, textcolor=YearlyInputColor, style=label.style_none, size=size.normal, xloc=xloc.bar_index, textalign=text.align_right)
    label.delete(yLowLabelPrice[1])

var line yHighLine = na
var label yHighLabel = na
if showyHigh
    yHighLine := line.new(x1=x1, y1=YearlyHigh, x2=Y_x2, y2=YearlyHigh, xloc=xloc.bar_index, width=1, color=YearlyInputColor, style=line.style_solid, extend=extend)
    yHighLabel := label.new(Y_x2loc, YearlyHigh, text=YearlySpaces + 'yHigh', color=YearlyInputColor, textcolor=YearlyInputColor, style=label.style_none, size=size.normal, xloc=xloc.bar_index, textalign=text.align_right)
    line.delete(yHighLine[1])
    label.delete(yHighLabel[1])

var label yHighLabelPrice = na
if showyHigh and showPrice
    yHighLabelPrice := label.new(Y_x2loc, YearlyHigh, text=YearlyPSpaces + str.tostring(f_round_up_to_tick(YearlyHigh, syminfo.mintick)), color=YearlyInputColor, textcolor=YearlyInputColor, style=label.style_none, size=size.normal, xloc=xloc.bar_index, textalign=text.align_right)
    label.delete(yHighLabelPrice[1])

i_height = 7
i_width = 15
i_c_text = color.new(color.white, 50)

//Daily VWAP
is_today = year == year(timenow) and month == month(timenow) and dayofmonth == dayofmonth(timenow)
roundedVWAP = f_round_up_to_tick(ta.vwap, syminfo.mintick)
VWAP = roundedVWAP
plot(VWAP, 'D-VWAP', is_today ? show_DVWAPs_color : na, offset=0)

var label VWAPLabel = na
if VWAP
    VWAPLabel := label.new(bar_index, VWAP, text='                      D-VWAP', color=show_DVWAPs_color, textcolor=show_DVWAPs_color, style=label.style_none, size=size.normal, xloc=xloc.bar_index, textalign=text.align_right)
    label.delete(VWAPLabel[1])

var label VWAPPLabel = na
if VWAP and showVPrice
    VWAPPLabel := label.new(bar_index, VWAP, text='                                                        ' + str.tostring(VWAP), color=show_DVWAPs_color, textcolor=show_DVWAPs_color, style=label.style_none, size=size.normal, xloc=xloc.bar_index, textalign=text.align_right)
    label.delete(VWAPPLabel[1])

//Weeekly VWAP
src = hlc3
wt = time('W')

wstart = na(wt[1]) or wt > wt[1]

wsumSrc = src * volume
wsumVol = volume
wsumSrc := wstart ? wsumSrc : wsumSrc + wsumSrc[1]
wsumVol := wstart ? wsumVol : wsumVol + wsumVol[1]

WVWAP = wsumSrc / wsumVol
wvw = f_round_up_to_tick(WVWAP, syminfo.mintick)

plot(timeframe.isintraday ? wvw : na, title='W-VWAP', color=show_WVWAPs_color)

var label wVWAPLabel = na
if wvw
    wVWAPLabel := label.new(bar_index, wvw, text='                      W-VWAP', color=show_WVWAPs_color, textcolor=show_WVWAPs_color, style=label.style_none, size=size.normal, xloc=xloc.bar_index, textalign=text.align_right)
    label.delete(wVWAPLabel[1])

var label wVWAPPLabel = na
if wvw and showVPrice
    wVWAPPLabel := label.new(bar_index, wvw, text='                                                        ' + str.tostring(wvw), color=show_WVWAPs_color, textcolor=show_WVWAPs_color, style=label.style_none, size=size.normal, xloc=xloc.bar_index, textalign=text.align_right)
    label.delete(wVWAPPLabel[1])

i_textSize = 'normal'
i_c_bg = color.new(color.blue, 80)

//Monthly VWAP
var float vwapsum = na
var float volumesum = na

newSession = ta.change(time('M'))
vwapsum := newSession ? hl2 * volume : hl2 * volume + vwapsum[1]
volumesum := newSession ? volume : volume + volumesum[1]

MVWAP = vwapsum / volumesum
mvw = f_round_up_to_tick(MVWAP, syminfo.mintick)

plot(newSession ? na : mvw, title='M-VWAP', color=show_MVWAPs_color, style=plot.style_linebr)

var label mVWAPLabel = na
if mvw
    mVWAPLabel := label.new(bar_index, mvw, text='                      M-VWAP', color=show_MVWAPs_color, textcolor=show_MVWAPs_color, style=label.style_none, size=size.normal, xloc=xloc.bar_index, textalign=text.align_right)
    label.delete(mVWAPLabel[1])

var label mVWAPPLabel = na
if mvw and showVPrice
    mVWAPPLabel := label.new(bar_index, mvw, text='                                                        ' + str.tostring(mvw), color=show_MVWAPs_color, textcolor=show_MVWAPs_color, style=label.style_none, size=size.normal, xloc=xloc.bar_index, textalign=text.align_right)
    label.delete(mVWAPPLabel[1])

var table watermark = table.new(i_tableYpos + '_' + i_tableXpos, 1, 1)

//Yearly VWAP
var float yvwapsum = na
var float yvolumesum = na

ynewSession = ta.change(time('12M'))
yvwapsum := ynewSession ? hl2 * volume : hl2 * volume + yvwapsum[1]
yvolumesum := ynewSession ? volume : volume + yvolumesum[1]

YVWAP = yvwapsum / yvolumesum
yvw = f_round_up_to_tick(YVWAP, syminfo.mintick)

table.cell(watermark, 0, 0, i_text1, i_width, i_height, i_c_text, text_size=i_textSize, bgcolor=i_c_bg)

plot(newSession ? na : yvw, title='Y-VWAP', color=show_YVWAPs_color, style=plot.style_linebr)

var label yVWAPLabel = na
if yvw
    yVWAPLabel := label.new(bar_index, yvw, text='                      Y-VWAP', color=show_YVWAPs_color, textcolor=show_YVWAPs_color, style=label.style_none, size=size.normal, xloc=xloc.bar_index, textalign=text.align_right)
    label.delete(yVWAPLabel[1])

var label yVWAPPLabel = na
if yvw and showVPrice
    yVWAPPLabel := label.new(bar_index, yvw, text='' + str.tostring(yvw), color=show_YVWAPs_color, textcolor=show_YVWAPs_color, style=label.style_none, size=size.normal, xloc=xloc.bar_index, textalign=text.align_right)
    label.delete(yVWAPPLabel[1])

/////////////////////Volaility & Fibbonacci//////////
showVF = input(title='Show VF', defval=true, group = '===== Volatility & Fibbonacci =====')
//supertend
factor = input.int(3, title="SuperTrend Factor")
atrP = input.int(10, title="SuperTrend atrPeriod")

[superTrend, direction] = ta.supertrend(factor, atrP)
sclr = direction > 0 ? color.red : color.green
plot(superTrend, title='SuperTrend', color=sclr)

//EMA

emaP = input.int(31, title="EMA length")
srcEma = input.source(high,"EMA source")
plot(ta.ema(srcEma,emaP))

//Volatality and Fibbonacci trade table

showTable=input(true, title="Show VF Table")
res = 'D'
test1=0
f_secureSecurity(_symbol, _res, _src) => request.security(_symbol, _res, _src, barmerge.gaps_off) // orignal code line
dc = f_secureSecurity(syminfo.tickerid, res, close[1+test1])
dc1 = f_secureSecurity(syminfo.tickerid, res, close[2+test1])
dc2 = f_secureSecurity(syminfo.tickerid, res, close[3+test1])
dc3 = f_secureSecurity(syminfo.tickerid, res, close[4+test1])
dc4 = f_secureSecurity(syminfo.tickerid, res, close[5+test1])
dc5 = f_secureSecurity(syminfo.tickerid, res, close[6+test1])
dc6 = f_secureSecurity(syminfo.tickerid, res, close[7+test1])
dc7 = f_secureSecurity(syminfo.tickerid, res, close[8+test1])
dc8 = f_secureSecurity(syminfo.tickerid, res, close[9+test1])
dc9 = f_secureSecurity(syminfo.tickerid, res, close[10+test1])
dc10 = f_secureSecurity(syminfo.tickerid, res, close[11+test1])
dop = f_secureSecurity(syminfo.tickerid, res, open)
logg00 =  math.log(dc/dc1)
logg11 = math.log(dc1/dc2)
logg22 = math.log(dc2/dc3)
logg33 = math.log(dc3/dc4)
logg44 = math.log(dc4/dc5)
logg55 = math.log(dc5/dc6)
logg66 = math.log(dc6/dc7)
logg77 = math.log(dc7/dc8)
logg88 = math.log(dc8/dc9)
logg99 = math.log(dc9/dc10)

squrr00 = logg00*logg00
squrr11 = logg11*logg11
squrr22 = logg22*logg22
squrr33 = logg33*logg33
squrr44 = logg44*logg44
squrr55 = logg55*logg55
squrr66 = logg66*logg66
squrr77 = logg77*logg77
squrr88 = logg88*logg88
squrr99 = logg99*logg99

avg_logg0 = (logg00+logg11+logg22+logg33+logg44+logg55+logg66+logg77+logg88+logg99)/10
avg_squrr0 = (squrr00+squrr11+squrr22+squrr33+squrr44+squrr55+squrr66+squrr77+squrr88+squrr99)/10

variancee0 = avg_squrr0 - (avg_logg0*avg_logg0)
volatility0 = math.sqrt(variancee0)

round_preci=input.int(title="VF Decimal Scale", options=[0,1,2,3], defval=0)
range11=math.round(dc*volatility0,round_preci)

doKdc= math.abs(dop-dc)>(0.382*range11)? dop : dc

//re-do calc

logg =  math.log(doKdc/dc1)
logg1 = math.log(dc1/dc2)
logg2 = math.log(dc2/dc3)
logg3 = math.log(dc3/dc4)
logg4 = math.log(dc4/dc5)
logg5 = math.log(dc5/dc6)
logg6 = math.log(dc6/dc7)
logg7 = math.log(dc7/dc8)
logg8 = math.log(dc8/dc9)
logg9 = math.log(dc9/dc10)

squrr = logg*logg
squrr1 = logg1*logg1
squrr2 = logg2*logg2
squrr3 = logg3*logg3
squrr4 = logg4*logg4
squrr5 = logg5*logg5
squrr6 = logg6*logg6
squrr7 = logg7*logg7
squrr8 = logg8*logg8
squrr9 = logg9*logg9

avg_logg = (logg+logg1+logg2+logg3+logg4+logg5+logg6+logg7+logg8+logg9)/10
avg_squrr = (squrr+squrr1+squrr2+squrr3+squrr4+squrr5+squrr6+squrr7+squrr8+squrr9)/10

variancee = avg_squrr - (avg_logg*avg_logg)
volatility = math.sqrt(variancee)


range1=math.round(doKdc*volatility,round_preci)


//doKdc=dc
buy_above=math.round(doKdc+(range1 * 0.236),round_preci)
buy_conf=math.round(doKdc+(range1 * 0.382),round_preci)
b_t1=math.round(doKdc+(range1 * 0.5),round_preci)
b_t2=math.round(doKdc+(range1 * 0.618),round_preci)
b_t3=math.round(doKdc+(range1 * 0.786),round_preci)
b_t4=math.round(doKdc+(range1 * 0.888),round_preci)
b_t5=math.round(doKdc+(range1 * 1.236),round_preci)
b_t6=math.round(doKdc+(range1 * 1.618),round_preci)

sell_below=math.round(doKdc-(range1 * 0.236),round_preci)
sell_conf=math.round(doKdc-(range1 * 0.382),round_preci)
s_t1=math.round(doKdc-(range1 * 0.5),round_preci)
s_t2=math.round(doKdc-(range1 * 0.618),round_preci)
s_t3=math.round(doKdc-(range1 * 0.786),round_preci)
s_t4=math.round(doKdc-(range1 * 0.888),round_preci)
s_t5=math.round(doKdc-(range1 * 1.236),round_preci)
s_t6=math.round(doKdc-(range1 * 1.618),round_preci)


sizeOption = input.string(title="VF Text Size",
     options=["Normal", "Small"],
     defval="Normal")

txtSize= (sizeOption == "Normal") ? size.small :  size.normal

//BUY/Sell confirmation line
// Today's Session Start timestamp
y = year(timenow)
m = month(timenow)
d = dayofmonth(timenow)

// Start & End time for
showLineOnSameDay=input(true, title="Show VF Lines on same Day")
dd=showLineOnSameDay?d:d+1
start = timestamp(y, m, dd, 09, 15)
end = start + 86400000

tom_start = start
tom_end = end
colorLabl=input.color(color.white,"VF Label Text color")

var lbl1 = label.new(na, na, "Buy Conf", color = color(na), style = label.style_label_left,size = txtSize, textcolor = colorLabl )
var lbl2 = label.new(na, na, "Sell Conf", color = color(na), style = label.style_label_left,size = txtSize, textcolor = colorLabl)
var lbl3 = label.new(na, na, "T1", color = color(na), style = label.style_label_left,size = txtSize, textcolor = colorLabl)
var lbl4 = label.new(na, na, "T2", color = color(na), style = label.style_label_left,size = txtSize, textcolor = colorLabl)
var lbl5 = label.new(na, na, "T3", color = color(na), style = label.style_label_left,size = txtSize, textcolor = colorLabl)
var lbl6 = label.new(na, na, "T4", color = color(na), style = label.style_label_left,size = txtSize, textcolor = colorLabl)
var lbl7 = label.new(na, na, "T5", color = color(na), style = label.style_label_left,size = txtSize, textcolor = colorLabl)
var lbl8 = label.new(na, na, "T6", color = color(na), style = label.style_label_left,size = txtSize, textcolor = colorLabl)
var lbl9 = label.new(na, na, "T1", color = color(na), style = label.style_label_left,size = txtSize, textcolor = colorLabl)
var lbl10 = label.new(na, na, "T2", color = color(na), style = label.style_label_left,size = txtSize, textcolor = colorLabl)
var lbl11 = label.new(na, na, "T3", color = color(na), style = label.style_label_left,size = txtSize, textcolor = colorLabl)
var lbl12 = label.new(na, na, "T4", color = color(na), style = label.style_label_left,size = txtSize, textcolor = colorLabl)
var lbl13 = label.new(na, na, "T5", color = color(na), style = label.style_label_left,size = txtSize, textcolor = colorLabl)
var lbl14 = label.new(na, na, "T6", color = color(na), style = label.style_label_left,size = txtSize, textcolor = colorLabl)
var lbl15 = label.new(na, na, "Buy Above", color = color(na), style = label.style_label_left,size = txtSize, textcolor = colorLabl)
var lbl16 = label.new(na, na, "Sell below", color = color(na), style = label.style_label_left,size = txtSize, textcolor = colorLabl)

colorBuy=input.color(color.green,"Buy Above Lines color")
colorSell=input.color(color.red,"Sell Below Lines color")

var lin1 = line.new(na, na, na, na, xloc = xloc.bar_time, style = line.style_solid,color=colorBuy, width = 2)
var lin2 = line.new(na, na, na, na, xloc = xloc.bar_time, style = line.style_solid,color=colorSell, width = 2)
var lin3 = line.new(na, na, na, na, xloc = xloc.bar_time, style = line.style_solid,color=colorBuy)
var lin4 = line.new(na, na, na, na, xloc = xloc.bar_time, style = line.style_solid,color=colorBuy)
var lin5 = line.new(na, na, na, na, xloc = xloc.bar_time, style = line.style_solid,color=colorBuy)
var lin6 = line.new(na, na, na, na, xloc = xloc.bar_time, style = line.style_solid,color=colorBuy)
var lin7 = line.new(na, na, na, na, xloc = xloc.bar_time, style = line.style_solid,color=colorBuy)
var lin8 = line.new(na, na, na, na, xloc = xloc.bar_time, style = line.style_solid,color=colorBuy)
var lin9 = line.new(na, na, na, na, xloc = xloc.bar_time, style = line.style_solid,color=colorSell)
var lin10 = line.new(na, na, na, na, xloc = xloc.bar_time, style = line.style_solid,color=colorSell)
var lin11 = line.new(na, na, na, na, xloc = xloc.bar_time, style = line.style_solid,color=colorSell)
var lin12 = line.new(na, na, na, na, xloc = xloc.bar_time, style = line.style_solid,color=colorSell)
var lin13 = line.new(na, na, na, na, xloc = xloc.bar_time, style = line.style_solid,color=colorSell)
var lin14 = line.new(na, na, na, na, xloc = xloc.bar_time, style = line.style_solid,color=colorSell)
var lin15 = line.new(na, na, na, na, xloc = xloc.bar_time, style = line.style_solid,color=colorBuy)
var lin16 = line.new(na, na, na, na, xloc = xloc.bar_time, style = line.style_solid,color=colorSell)

//Buy_Conf_lvl
line.set_xy1(lin1, tom_start, buy_conf)
line.set_xy2(lin1, tom_end,buy_conf)
label.set_xy(lbl1, bar_index, buy_conf)
//Sell_Conf_lvl
line.set_xy1(lin2, tom_start, sell_conf)
line.set_xy2(lin2, tom_end,sell_conf)
label.set_xy(lbl2, bar_index, sell_conf)
//T1
line.set_xy1(lin3, tom_start, b_t1)
line.set_xy2(lin3, tom_end,b_t1)
label.set_xy(lbl3, bar_index, b_t1)
//T2
line.set_xy1(lin4, tom_start, b_t2)
line.set_xy2(lin4, tom_end,b_t2)
label.set_xy(lbl4, bar_index, b_t2)
//T3
line.set_xy1(lin5, tom_start, b_t3)
line.set_xy2(lin5, tom_end,b_t3)
label.set_xy(lbl5, bar_index, b_t3)
//T4
line.set_xy1(lin6, tom_start, b_t4)
line.set_xy2(lin6, tom_end,b_t4)
label.set_xy(lbl6, bar_index, b_t4)
//T5
line.set_xy1(lin7, tom_start, b_t5)
line.set_xy2(lin7, tom_end,b_t5)
label.set_xy(lbl7, bar_index, b_t5)
//T6
line.set_xy1(lin8, tom_start, b_t6)
line.set_xy2(lin8, tom_end,b_t6)
label.set_xy(lbl8, bar_index, b_t6)

//S1
line.set_xy1(lin9, tom_start, s_t1)
line.set_xy2(lin9, tom_end,s_t1)
label.set_xy(lbl9, bar_index, s_t1)
//S2
line.set_xy1(lin10, tom_start, s_t2)
line.set_xy2(lin10, tom_end,s_t2)
label.set_xy(lbl10, bar_index, s_t2)
//S3
line.set_xy1(lin11, tom_start, s_t3)
line.set_xy2(lin11, tom_end,s_t3)
label.set_xy(lbl11, bar_index, s_t3)
//S4
line.set_xy1(lin12, tom_start, s_t4)
line.set_xy2(lin12, tom_end,s_t4)
label.set_xy(lbl12, bar_index, s_t4)
//S5
line.set_xy1(lin13, tom_start, s_t5)
line.set_xy2(lin13, tom_end,s_t5)
label.set_xy(lbl13, bar_index, s_t5)
//S6
line.set_xy1(lin14, tom_start, s_t6)
line.set_xy2(lin14, tom_end,s_t6)
label.set_xy(lbl14, bar_index, s_t6)

//Buy Above
line.set_xy1(lin15, tom_start, buy_above)
line.set_xy2(lin15, tom_end,buy_above)
label.set_xy(lbl15, bar_index, buy_above)

//Sell Below
line.set_xy1(lin16, tom_start, sell_below)
line.set_xy2(lin16, tom_end,sell_below)
label.set_xy(lbl16, bar_index, sell_below)

color_g=#e6fce8
coor_r=#fce6ea
color_n=#bab8b8
color_rg=#ebe6ea
color_wh=color.white

txt_color_r=#f50a19
txt_color_g=#039458

plotVF = timeframe.period == 'D'  or timeframe.period == '120'or timeframe.period == '120' or timeframe.period == '60' or timeframe.period == '15' or timeframe.period == '30'
     or timeframe.period == '5' or timeframe.period == '3' or timeframe.period == '180'or timeframe.period == '240'or timeframe.period == '2'

trendingTimes="T4,T5,T6: On trending Times"
NormalTargets="T2,T3: Normal Targets"
tableToolTip="This table works well in a Trending Markets; in sideways market use it as Support and Resistance"
var testTable = table.new(position = position.bottom_right, columns = 9, rows = 3, bgcolor = color.yellow, border_width = 1, border_color=color.white)
if barstate.islast and plotVF and showTable
    table.cell(table_id = testTable, column = 1, row = 0, text = "^/v " ,text_size=txtSize,tooltip="Above/Below")
    table.cell(table_id = testTable, column = 2, row = 0, text = "Conf ", bgcolor=color.green,text_size=txtSize,tooltip="Confirmation")
    table.cell(table_id = testTable, column = 3, row = 0, text = "T1 ", bgcolor=color_wh,text_size=txtSize)
    table.cell(table_id = testTable, column = 4, row = 0, text = "T2 ", bgcolor=color.gray,text_size=txtSize,tooltip=NormalTargets)
    table.cell(table_id = testTable, column = 5, row = 0, text = "T3 ", bgcolor=color.gray,text_size=txtSize,tooltip=NormalTargets)
    table.cell(table_id = testTable, column = 6, row = 0, text = "T4 ", bgcolor=color.green,text_size=txtSize,tooltip=trendingTimes)
    table.cell(table_id = testTable, column = 7, row = 0, text = "T5 ", bgcolor=color.green,text_size=txtSize,tooltip=trendingTimes)
    table.cell(table_id = testTable, column = 8, row = 0, text = "T6 ", bgcolor=color.green,text_size=txtSize,tooltip=trendingTimes)

    table.cell(table_id = testTable, column = 0, row = 0, text = "VF Table", bgcolor=color.white, text_size=txtSize,tooltip=tableToolTip)
    table.cell(table_id = testTable, column = 0, row = 1, text = "For Buy Above ", bgcolor=color.green ,text_size=txtSize)
    table.cell(table_id = testTable, column = 0, row = 2, text = "For Sell Below ", bgcolor=color.orange ,text_size=txtSize)

    table.cell(table_id = testTable, column = 1, row = 1, text = str.tostring(buy_above), bgcolor=color_g ,text_size=txtSize, text_color=txt_color_r)
    table.cell(table_id = testTable, column = 2, row = 1, text = str.tostring(buy_conf), bgcolor=color_g,text_size=txtSize, text_color=txt_color_r)
    table.cell(table_id = testTable, column = 3, row = 1, text = str.tostring(b_t1), bgcolor=color_wh,text_size=txtSize, text_color=txt_color_r)
    table.cell(table_id = testTable, column = 4, row = 1, text = str.tostring(b_t2), bgcolor=color_n,text_size=txtSize, text_color=txt_color_r)
    table.cell(table_id = testTable, column = 5, row = 1, text = str.tostring(b_t3), bgcolor=color_n,text_size=txtSize, text_color=txt_color_r)
    table.cell(table_id = testTable, column = 6, row = 1, text = str.tostring(b_t4), bgcolor=color_g,text_size=txtSize, text_color=txt_color_r)
    table.cell(table_id = testTable, column = 7, row = 1, text = str.tostring(b_t5), bgcolor=color_g,text_size=txtSize, text_color=txt_color_r)
    table.cell(table_id = testTable, column = 8, row = 1, text = str.tostring(b_t6), bgcolor=color_g,text_size=txtSize, text_color=txt_color_r)

    table.cell(table_id = testTable, column = 1, row = 2, text = str.tostring(sell_below) , bgcolor=coor_r,text_size=txtSize,text_color=txt_color_g)
    table.cell(table_id = testTable, column = 2, row = 2, text = str.tostring(sell_conf), bgcolor=coor_r,text_size=txtSize,text_color=txt_color_g)
    table.cell(table_id = testTable, column = 3, row = 2, text = str.tostring(s_t1), bgcolor=color_wh,text_size=txtSize,text_color=txt_color_g)
    table.cell(table_id = testTable, column = 4, row = 2, text = str.tostring(s_t2), bgcolor=color_rg,text_size=txtSize,text_color=txt_color_g)
    table.cell(table_id = testTable, column = 5, row = 2, text = str.tostring(s_t3), bgcolor=color_rg,text_size=txtSize,text_color=txt_color_g)
    table.cell(table_id = testTable, column = 6, row = 2, text = str.tostring(s_t4), bgcolor=coor_r,text_size=txtSize,text_color=txt_color_g)
    table.cell(table_id = testTable, column = 7, row = 2, text = str.tostring(s_t5), bgcolor=coor_r,text_size=txtSize,text_color=txt_color_g)
    table.cell(table_id = testTable, column = 8, row = 2, text = str.tostring(s_t6), bgcolor=coor_r,text_size=txtSize,text_color=txt_color_g)
tf = timeframe.isintraday ? "D" : "W"
d_high = f_secureSecurity(syminfo.tickerid, tf, high[1+test1])
d_low = f_secureSecurity(syminfo.tickerid, tf, low[1+test1])
d_close =  f_secureSecurity(syminfo.tickerid, tf, close[1+test1])


pivot = (d_high + d_low + d_close)/3
BC = (d_high + d_low)/2
TC = (pivot - BC) + pivot
R1 = (pivot * 2) - d_low
R2 = pivot + (d_high-d_low)
S1 = (pivot * 2) - d_high
S2 = pivot - (d_high-d_low)

var testPTable = table.new(position = position.top_right, columns = 8, rows = 2, bgcolor = color.yellow, border_width = 1, border_color=color.white)
table.cell(table_id = testPTable, column = 0, row = 0, text = "S2 ",text_size=txtSize )
table.cell(table_id = testPTable, column = 1, row = 0, text = "S1 ",text_size=txtSize )
table.cell(table_id = testPTable, column = 2, row = 0, text = "Pivot" ,text_size=txtSize)
table.cell(table_id = testPTable, column = 3, row = 0, text = "R1 ",text_size=txtSize )
table.cell(table_id = testPTable, column = 4, row = 0, text = "R2",text_size=txtSize )
table.cell(table_id = testPTable, column = 5, row = 0, text = "BC",text_size=txtSize )
table.cell(table_id = testPTable, column = 6, row = 0, text = "TC",text_size=txtSize )
table.cell(table_id = testPTable, column = 7, row = 0, text = "Range",text_size=txtSize )
table.cell(table_id = testPTable, column = 0, row = 1, text = str.tostring(math.round(S2,round_preci)) ,bgcolor=color.green,text_size=txtSize)
table.cell(table_id = testPTable, column = 1, row = 1, text =  str.tostring(math.round(S1,round_preci)), bgcolor=color.green,text_size=txtSize )
table.cell(table_id = testPTable, column = 2, row = 1, text =  str.tostring(math.round(pivot,round_preci)) ,text_size=txtSize)
table.cell(table_id = testPTable, column = 3, row = 1, text =  str.tostring(math.round(R1,round_preci)) , bgcolor=color.orange,text_size=txtSize )
table.cell(table_id = testPTable, column = 4, row = 1, text =  str.tostring(math.round(R2,round_preci)) , bgcolor=color.orange,text_size=txtSize )
table.cell(table_id = testPTable, column = 5, row = 1, text =  str.tostring(math.round(BC,round_preci)) , bgcolor=color.green,text_size=txtSize )
table.cell(table_id = testPTable, column = 6, row = 1, text =  str.tostring(math.round(TC,round_preci)) , bgcolor=color.green,text_size=txtSize )
table.cell(table_id = testPTable, column = 7, row = 1, text =  str.tostring(math.round((TC-BC),round_preci+1)) , bgcolor=color.orange,text_size=txtSize )

// * * * * * * * * * * * * * * * * * * * * * * * * * * * * * * * * * * * * * * * * * * * * * * * * * *
// Auto trendlines

// Input:
var string GROUP_ATL    = "===== Auto trendlines ====="
var int n = input.int(10, title="Fractal Periods", minval=2)

bool upflagDown = true, bool upflagUp0  = true, bool upflagUp1  = true
bool upflagUp2  = true, bool upflagUp3  = true, bool upflagUp4  = true

for i = 1 to n
    upflagDown := upflagDown and (high[n-i] < high[n])
    upflagUp0 := upflagUp0 and (high[n+i] < high[n])
    upflagUp1 := upflagUp1 and (high[n+1] <= high[n] and high[n+i + 1] < high[n])
    upflagUp2 := upflagUp2 and (high[n+1] <= high[n] and high[n+2] <= high[n] and high[n+i + 2] < high[n])
    upflagUp3 := upflagUp3 and (high[n+1] <= high[n] and high[n+2] <= high[n] and high[n+3] <= high[n] and high[n+i + 3] < high[n])
    upflagUp4 := upflagUp4 and (high[n+1] <= high[n] and high[n+2] <= high[n] and high[n+3] <= high[n] and high[n+4] <= high[n] and high[n+i + 4] < high[n])
flagUp = upflagUp0 or upflagUp1 or upflagUp2 or upflagUp3 or upflagUp4

bool downflagDown = true, bool downflagUp0  = true, bool downflagUp1  = true
bool downflagUp2  = true, bool downflagUp3  = true, bool downflagUp4  = true

for i = 1 to n
    downflagDown := downflagDown and (low[n-i] > low[n])
    downflagUp0  := downflagUp0 and (low[n+i] > low[n])
    downflagUp1  := downflagUp1 and (low[n+1] >= low[n] and low[n+i + 1] > low[n])
    downflagUp2  := downflagUp2 and (low[n+1] >= low[n] and low[n+2] >= low[n] and low[n+i + 2] > low[n])
    downflagUp3  := downflagUp3 and (low[n+1] >= low[n] and low[n+2] >= low[n] and low[n+3] >= low[n] and low[n+i + 3] > low[n])
    downflagUp4  := downflagUp4 and (low[n+1] >= low[n] and low[n+2] >= low[n] and low[n+3] >= low[n] and low[n+4] >= low[n] and low[n+i + 4] > low[n])
flagDown = downflagUp0 or downflagUp1 or downflagUp2 or downflagUp3 or downflagUp4

bool upfract = upflagDown[1] and flagUp[1]
bool downfract = downflagDown[1] and flagDown[1]


// Input:

var int LINE_WIDTH1     = 2, var string LINE_WIDTH1_STR = "Width 1"
var int LINE_WIDTH2     = 2, var string LINE_WIDTH2_STR = "Width 2"

var string subgroup1    = "recent line"
var color ln_col_recent = input.color(color.new(color.yellow, 0), title="Recent Line", group=GROUP_ATL, inline=subgroup1)
int _lnwidth_recent = switch input.string(LINE_WIDTH1_STR, options=[LINE_WIDTH1_STR, LINE_WIDTH2_STR], title="", inline=subgroup1, group=GROUP_ATL)
    LINE_WIDTH1_STR => LINE_WIDTH1
    LINE_WIDTH2_STR => LINE_WIDTH2
var int lnwidth_recent  = _lnwidth_recent

var string subgroup2    = "historical line"
var color ln_col_prev   = input.color(color.new(#dee2f1, 50), title="Historical Line", group=GROUP_ATL, inline=subgroup2)
int _lnwidth_prev = switch input.string(LINE_WIDTH1_STR, options=[LINE_WIDTH1_STR, LINE_WIDTH2_STR], title="", inline=subgroup2, group=GROUP_ATL)
    LINE_WIDTH1_STR => LINE_WIDTH1
    LINE_WIDTH2_STR => LINE_WIDTH2
var int lnwidth_prev  = _lnwidth_prev

var int max_tl          = input.int(1, title="Max pair of lines", maxval=250, minval=1, group=GROUP_ATL)*2
var string _str_extend  = input.string("Right", options=["Right", "Both ways"], title="Which way to extend lines", group=GROUP_ATL)
var string str_extend   = _str_extend == "Both ways" ? extend.both : extend.right

var bool show_crosses   = input.bool(false, title="Show crosses", tooltip="Instances when closing price of a bar has crossed lower/upper trendlines", group=GROUP_ATL)
//

// Recent fractals.
var float recent_dn1   = low,   var int i_recent_dn1 = bar_index
var float recent_up1   = high,  var int i_recent_up1 = bar_index
var float recent_dn2   = low,   var int i_recent_dn2 = bar_index
var float recent_up2   = high,  var int i_recent_up2 = bar_index

// Array of lines, newest elements inserted to front.
var line[] arr_ln_up = array.new_line()
var line[] arr_ln_dn = array.new_line()

// @function : Clean up
// @param arr : either arr_ln_up/arr_ln_dn should be passed into it.
// @returns void : To delete excess lines and assign new color to historical lines.
cleanup(line[] arr) =>
    if array.size(arr) > 1
        line.set_color(array.get(arr, 1), ln_col_prev)
        line.set_width(array.get(arr, 1), lnwidth_prev)
        while array.size(arr) > math.floor(max_tl/2)
            line.delete(array.pop(arr))

// Checking for fractals & Drawing trendlines
if downfract
    recent_dn2:=recent_dn1
    i_recent_dn2:=i_recent_dn1
    recent_dn1:=low[n+1]
    i_recent_dn1 := bar_index-n-1

    ln_dn = line.new(i_recent_dn2, recent_dn2, i_recent_dn1, recent_dn1, xloc.bar_index, str_extend, color=ln_col_recent, style=line.style_dashed, width=lnwidth_recent)
    array.unshift(arr_ln_dn, ln_dn)
    cleanup(arr_ln_dn)

if upfract
    recent_up2:=recent_up1
    i_recent_up2:=i_recent_up1
    recent_up1:=high[n+1]
    i_recent_up1 := bar_index-n-1

    ln_up = line.new(i_recent_up2, recent_up2, i_recent_up1, recent_up1, xloc.bar_index, str_extend, color=ln_col_recent, style=line.style_dashed, width=lnwidth_recent)
    array.unshift(arr_ln_up, ln_up)
    cleanup(arr_ln_up)

// * * * * * * * * * * * * * * * * * * * * * * * * * * * * * * * * * * * * * * * * * * * * * * * *
// Finding crosses

// @function : Get slope
// @param int xA , xB: x values of known points A and B
// @param float yA, yB : y values of known points A and B
// @returns float m : Slope value, commonly expressed as rise over run.
get_slope(xA, yA, xB, yB) =>
    (yB - yA) / (xB - xA)

// Linear extrapolation
// Solving for price at current x (bar_index), given two pairs of fractals with x values < bar_index.
float m_dn = get_slope(i_recent_dn1, recent_dn1, i_recent_dn2, recent_dn2)
float y_dn = (m_dn * bar_index) + recent_dn1 - (m_dn * i_recent_dn1)

float m_up = get_slope(i_recent_up1, recent_up1, i_recent_up2, recent_up2)
float y_up = (m_up * bar_index) + recent_up1 - (m_up * i_recent_up1)
//

bool crossed_top = ta.cross(close, y_up)
bool crossed_bottom = ta.cross(close, y_dn)

plotshape(show_crosses and crossed_top, title = "Crossed upper trendline", style = shape.xcross, location = location.belowbar, color = color.new(color = color.green, transp = 50), size = size.small)
plotshape(show_crosses and crossed_bottom, title = "Crossed lower trendline", style = shape.xcross, location = location.abovebar, color = color.new(color = color.red, transp = 50), size = size.small)

alertcondition(crossed_top or crossed_bottom, title="Upper/lower trendline crossed", message="Upper/lower trendline crossed")


// Alerts --------------------------------------------------------------------------------------- //
// ---------------------------------------------------------------------------------------------- //
showPSAR = input(title='Show PSAR', defval=false, group = '===== PSAR =====')
showPSAR2 = input(title='Show PSAR2', defval=false, group = '===== PSAR2 =====')
showPSAR3 = input(title='Show PSAR3', defval=false, group = '===== PSAR3 =====')
/////////////////////////////////////////////////////////////////////////////////////////////////////////////////
///////////////////////////////////////////// PARABOLIC SAR //////////////////////////////////////////////////////
/////////////////////////////////////////////////////////////////////////////////////////////////////////////////
start1 = input.float(0.01,"Start",minval=0.001, group = '===== PSAR =====')
increment = input.float(0.01,"Increament",minval=0.001, group = '===== PSAR =====')
maximum = 0.1
psar_out = ta.sar(start1, increment, maximum)
plot(showPSAR ? psar_out : na, 'ParabolicSAR', style=plot.style_cross, color=color.new(#f32121, 0))

//////////////////////////////////////////////////////////////////////////////////////////////////////////////////
///////////////////////////////////////////// PARABOLIC SAR2 //////////////////////////////////////////////////////
/////////////////////////////////////////////////////////////////////////////////////////////////////////////////
start2 = input.float(0.02,"Start",minval=0.001, group = '===== PSAR2 =====')
increment2 = input.float(0.02,"Increament",minval=0.001, group = '===== PSAR2 =====')
maximum2 = 0.2
psar_out2 = ta.sar(start2, increment2, maximum2)
plot(showPSAR2 ? psar_out2 : na, 'ParabolicSAR2', style=plot.style_cross, color=color.new(#04dc41, 0))

/////////////////////////////////////////////////////////////////////////////////////////////////////////////////
///////////////////////////////////////////// PARABOLIC SAR3 //////////////////////////////////////////////////////
/////////////////////////////////////////////////////////////////////////////////////////////////////////////////
start3 = input.float(0.03,"Start",minval=0.001, group = '===== PSAR3 =====')
increment3 = input.float(0.03,"Increament",minval=0.001, group = '===== PSAR3 =====')
maximum3 = 0.3
psar_out3 = ta.sar(start3, increment3, maximum3)
plot(showPSAR3 ? psar_out3 : na, 'ParabolicSAR3', style=plot.style_cross, color=color.new(#efeff6, 0))

///////////////////////////////////////////////////////////////////////////////////////////////////////////////////
// Alerts --------------------------------------------------------------------------------------- //
// ---------------------------------------------------------------------------------------------- //
show3Bc = input(title='Show 3Bc', defval=false, group = '3Bc')

int   length     = input.int(     8, 'Moving Average Length:')
float src1        = input.source(hl2, 'Source series:')
float deviations = input.float( 2.0, 'Number of Deviations:')

float ma = ta.sma(src1, length)
float sd = ta.stdev(src1, length)
float ma_fall = ta.valuewhen(ma < ma[1], ma[1], 0)
float ma_rise = ta.valuewhen(ma > ma[1], ma[1], 0)
var float oma = src1

if ma > ma[1]
    oma := ma_fall
if ma < ma[1]
    oma := ma_rise

float upper = oma + sd * deviations
float lower = oma - sd * deviations

color col_body = ma >= upper ? #9ce0b2 : ma <= lower ? #ca9c88 : ma >= ma[1] ? color.green : color.maroon
color col_bord = color.rgb(70, 70, 70, 40)
plotcandle(oma, upper, lower, ma, '3Bc', col_body, col_bord, bordercolor=col_body)

/////////////////////////////////////////////////////////////////////////////////////////////
showAMA = input(title='Show AMA', defval=true, group = '===== Adaptive MA(TR) =====')

length1 = input(99)
src2 = input(close)
//----
ama = 0.
hh = math.max(math.sign(ta.change(ta.highest(length1))), 0)
ll = math.max(math.sign(ta.change(ta.lowest(length1)) * -1), 0)
tc = math.pow(ta.sma(hh or ll ? 1 : 0, length1), 2)
ama := nz(ama[1] + tc * (src - ama[1]), src2)
plot(ama, 'Plot2', color.new(#ff1100, 0), 2)


showSMLM= input(title='Show SMLM', defval=true, group = '===== SML Major =====')

//      INDICATOR SETTINGS
swing_length = input.int(10, title = 'Swing High/Low Length', group = 'Settings', minval = 1, maxval = 50)
history_of_demand_to_keep = input.int(20, title = 'History To Keep', minval = 5, maxval = 50)
box_width = input.float(2.5, title = 'Supply/Demand Box Width', group = 'Settings', minval = 1, maxval = 10, step = 0.5)

//      INDICATOR VISUAL SETTINGS
show_zigzag = input.bool(false, title = 'Show Zig Zag', group = 'Visual Settings', inline = '1')
show_price_action_labels = input.bool(false, title = 'Show Price Action Labels', group = 'Visual Settings', inline = '2')

supply_color = input.color(color.new(#EDEDED,70), title = 'Supply', group = 'Visual Settings', inline = '3')
supply_outline_color = input.color(color.new(color.white,75), title = 'Outline', group = 'Visual Settings', inline = '3')

demand_color = input.color(color.new(#00FFFF,70), title = 'Demand', group = 'Visual Settings', inline = '4')
demand_outline_color = input.color(color.new(color.white,75), title = 'Outline', group = 'Visual Settings', inline = '4')

bos_label_color = input.color(color.white, title = 'BOS Label', group = 'Visual Settings', inline = '5')
poi_label_color = input.color(color.white, title = 'POI Label', group = 'Visual Settings', inline = '7')

swing_type_color = input.color(color.black, title = 'Price Action Label', group = 'Visual Settings', inline = '8')
zigzag_color = input.color(color.new(#000000,0), title = 'Zig Zag', group = 'Visual Settings', inline = '9')

//
//END SETTINGS
//


//
//FUNCTIONS
//

//      FUNCTION TO ADD NEW AND REMOVE LAST IN ARRAY
f_array_add_pop(array, new_value_to_add) =>
    array.unshift(array, new_value_to_add)
    array.pop(array)

//      FUNCTION SWING H & L LABELS
f_sh_sl_labels(array, swing_type) =>

    var string label_text = na
    if swing_type == 1
        if array.get(array, 0) >= array.get(array, 1)
            label_text := 'HH'
        else
            label_text := 'LH'
        label.new(bar_index - swing_length, array.get(array,0), text = label_text, style=label.style_label_down, textcolor = swing_type_color, color = color.new(swing_type_color, 100), size = size.tiny)

    else if swing_type == -1
        if array.get(array, 0) >= array.get(array, 1)
            label_text := 'HL'
        else
            label_text := 'LL'
        label.new(bar_index - swing_length, array.get(array,0), text = label_text, style=label.style_label_up, textcolor = swing_type_color, color = color.new(swing_type_color, 100), size = size.tiny)

//      FUNCTION MAKE SURE SUPPLY ISNT OVERLAPPING
f_check_overlapping(new_poi, box_array, atr) =>

    atr_threshold = atr * 2
    okay_to_draw = true

    for i = 0 to array.size(box_array) - 1
        top = box.get_top(array.get(box_array, i))
        bottom = box.get_bottom(array.get(box_array, i))
        poi = (top + bottom) / 2

        upper_boundary = poi + atr_threshold
        lower_boundary = poi - atr_threshold

        if new_poi >= lower_boundary and new_poi <= upper_boundary
            okay_to_draw := false
            break
        else
            okay_to_draw := true
    okay_to_draw


//      FUNCTION TO DRAW SUPPLY OR DEMAND ZONE
f_supply_demand(value_array, bn_array, box_array, label_array, box_type, atr) =>

    atr_buffer = atr * (box_width / 10)
    box_left = array.get(bn_array, 0)
    box_right = bar_index

    var float box_top = 0.00
    var float box_bottom = 0.00
    var float poi = 0.00


    if box_type == 1
        box_top := array.get(value_array, 0)
        box_bottom := box_top - atr_buffer
        poi := (box_top + box_bottom) / 2
    else if box_type == -1
        box_bottom := array.get(value_array, 0)
        box_top := box_bottom + atr_buffer
        poi := (box_top + box_bottom) / 2

    okay_to_draw = f_check_overlapping(poi, box_array, atr)
    // okay_to_draw = true

    //delete oldest box, and then create a new box and add it to the array
    if box_type == 1 and okay_to_draw
        box.delete( array.get(box_array, array.size(box_array) - 1) )
        f_array_add_pop(box_array, box.new( left = box_left, top = box_top, right = box_right, bottom = box_bottom, border_color = supply_outline_color,
             bgcolor = supply_color, extend = extend.right, text = 'SUPPLY', text_halign = text.align_center, text_valign = text.align_center, text_color = poi_label_color, text_size = size.small, xloc = xloc.bar_index))

        box.delete( array.get(label_array, array.size(label_array) - 1) )
        f_array_add_pop(label_array, box.new( left = box_left, top = poi, right = box_right, bottom = poi, border_color = color.new(poi_label_color,90),
             bgcolor = color.new(poi_label_color,90), extend = extend.right, text = 'POI', text_halign = text.align_left, text_valign = text.align_center, text_color = poi_label_color, text_size = size.small, xloc = xloc.bar_index))

    else if box_type == -1 and okay_to_draw
        box.delete( array.get(box_array, array.size(box_array) - 1) )
        f_array_add_pop(box_array, box.new( left = box_left, top = box_top, right = box_right, bottom = box_bottom, border_color = demand_outline_color,
             bgcolor = demand_color, extend = extend.right,  text = 'DEMAND', text_halign = text.align_center, text_valign = text.align_center, text_color = poi_label_color, text_size = size.small, xloc = xloc.bar_index))

        box.delete( array.get(label_array, array.size(label_array) - 1) )
        f_array_add_pop(label_array, box.new( left = box_left, top = poi, right = box_right, bottom = poi, border_color = color.new(poi_label_color,90),
             bgcolor = color.new(poi_label_color,90), extend = extend.right,  text = 'POI', text_halign = text.align_left, text_valign = text.align_center, text_color = poi_label_color, text_size = size.small, xloc = xloc.bar_index))


//      FUNCTION TO CHANGE SUPPLY/DEMAND TO A BOS IF BROKEN
f_sd_to_bos(box_array, bos_array, label_array, zone_type) =>

    if zone_type == 1
        for i = 0 to array.size(box_array) - 1
            level_to_break = box.get_top(array.get(box_array,i))
            // if ta.crossover(close, level_to_break)
            if close >= level_to_break
                copied_box = box.copy(array.get(box_array,i))
                f_array_add_pop(bos_array, copied_box)
                mid = (box.get_top(array.get(box_array,i)) + box.get_bottom(array.get(box_array,i))) / 2
                box.set_top(array.get(bos_array,0), mid)
                box.set_bottom(array.get(bos_array,0), mid)
                box.set_extend( array.get(bos_array,0), extend.none)
                box.set_right( array.get(bos_array,0), bar_index)
                box.set_text( array.get(bos_array,0), 'BOS' )
                box.set_text_color( array.get(bos_array,0), bos_label_color)
                box.set_text_size( array.get(bos_array,0), size.small)
                box.set_text_halign( array.get(bos_array,0), text.align_center)
                box.set_text_valign( array.get(bos_array,0), text.align_center)
                box.delete(array.get(box_array, i))
                box.delete(array.get(label_array, i))


    if zone_type == -1
        for i = 0 to array.size(box_array) - 1
            level_to_break = box.get_bottom(array.get(box_array,i))
            // if ta.crossunder(close, level_to_break)
            if close <= level_to_break
                copied_box = box.copy(array.get(box_array,i))
                f_array_add_pop(bos_array, copied_box)
                mid = (box.get_top(array.get(box_array,i)) + box.get_bottom(array.get(box_array,i))) / 2
                box.set_top(array.get(bos_array,0), mid)
                box.set_bottom(array.get(bos_array,0), mid)
                box.set_extend( array.get(bos_array,0), extend.none)
                box.set_right( array.get(bos_array,0), bar_index)
                box.set_text( array.get(bos_array,0), 'BOS' )
                box.set_text_color( array.get(bos_array,0), bos_label_color)
                box.set_text_size( array.get(bos_array,0), size.small)
                box.set_text_halign( array.get(bos_array,0), text.align_center)
                box.set_text_valign( array.get(bos_array,0), text.align_center)
                box.delete(array.get(box_array, i))
                box.delete(array.get(label_array, i))


//      FUNCTION MANAGE CURRENT BOXES BY CHANGING ENDPOINT
f_extend_box_endpoint(box_array) =>

    for i = 0 to array.size(box_array) - 1
        box.set_right(array.get(box_array, i), bar_index + 100)


//
//END FUNCTIONS
//


//
//CALCULATIONS
//

//      CALCULATE ATR
atr = ta.atr(50)

//      CALCULATE SWING HIGHS & SWING LOWS
swing_high = ta.pivothigh(high, swing_length, swing_length)
swing_low = ta.pivotlow(low, swing_length, swing_length)

//      ARRAYS FOR SWING H/L & BN
var swing_high_values = array.new_float(5,0.00)
var swing_low_values = array.new_float(5,0.00)

var swing_high_bns = array.new_int(5,0)
var swing_low_bns = array.new_int(5,0)

//      ARRAYS FOR SUPPLY / DEMAND
var current_supply_box = array.new_box(history_of_demand_to_keep, na)
var current_demand_box = array.new_box(history_of_demand_to_keep, na)

//      ARRAYS FOR SUPPLY / DEMAND POI LABELS
var current_supply_poi = array.new_box(history_of_demand_to_keep, na)
var current_demand_poi = array.new_box(history_of_demand_to_keep, na)

//      ARRAYS FOR BOS
var supply_bos = array.new_box(5, na)
var demand_bos = array.new_box(5, na)
//
//END CALCULATIONS
//

//      NEW SWING HIGH
if not na(swing_high)

    //MANAGE SWING HIGH VALUES
    f_array_add_pop(swing_high_values, swing_high)
    f_array_add_pop(swing_high_bns, bar_index[swing_length])
    if show_price_action_labels
        f_sh_sl_labels(swing_high_values, 1)

    f_supply_demand(swing_high_values, swing_high_bns, current_supply_box, current_supply_poi, 1, atr)

//      NEW SWING LOW
else if not na(swing_low)

    //MANAGE SWING LOW VALUES
    f_array_add_pop(swing_low_values, swing_low)
    f_array_add_pop(swing_low_bns, bar_index[swing_length])
    if show_price_action_labels
        f_sh_sl_labels(swing_low_values, -1)

    f_supply_demand(swing_low_values, swing_low_bns, current_demand_box, current_demand_poi, -1, atr)


f_sd_to_bos(current_supply_box, supply_bos, current_supply_poi, 1)
f_sd_to_bos(current_demand_box, demand_bos, current_demand_poi, -1)

f_extend_box_endpoint(current_supply_box)
f_extend_box_endpoint(current_demand_box)

//ZIG ZAG
h = ta.highest(high, swing_length * 2 + 1)
l = ta.lowest(low, swing_length * 2 + 1)
f_isMin(len) =>
    l == low[len]
f_isMax(len) =>
    h == high[len]

var dirUp = false
var lastLow = high * 100
var lastHigh = 0.0
var timeLow = bar_index
var timeHigh = bar_index
var line li = na

f_drawLine() =>
    _li_color = show_zigzag ? zigzag_color : color.new(#ffffff,100)
    line.new(timeHigh - swing_length, lastHigh, timeLow - swing_length, lastLow, xloc.bar_index, color=_li_color, width=2)

if dirUp
    if f_isMin(swing_length) and low[swing_length] < lastLow
        lastLow := low[swing_length]
        timeLow := bar_index
        line.delete(li)
        li := f_drawLine()
        li

    if f_isMax(swing_length) and high[swing_length] > lastLow
        lastHigh := high[swing_length]
        timeHigh := bar_index
        dirUp := false
        li := f_drawLine()
        li

if not dirUp
    if f_isMax(swing_length) and high[swing_length] > lastHigh
        lastHigh := high[swing_length]
        timeHigh := bar_index
        line.delete(li)
        li := f_drawLine()
        li
    if f_isMin(swing_length) and low[swing_length] < lastHigh
        lastLow := low[swing_length]
        timeLow := bar_index
        dirUp := true
        li := f_drawLine()
        if f_isMax(swing_length) and high[swing_length] > lastLow
            lastHigh := high[swing_length]
            timeHigh := bar_index
            dirUp := false
            li := f_drawLine()
            li
// if barstate.islast
    // label.new(x = bar_index + 10, y = close[1], text = str.tostring( array.size(current_supply_poi) ))
//     label.new(x = bar_index + 20, y = close[1], text = str.tostring( box.get_bottom( array.get(current_supply_box, 0))))
//     label.new(x = bar_index + 30, y = close[1], text = str.tostring( box.get_bottom( array.get(current_supply_box, 1))))
//     label.new(x = bar_index + 40, y = close[1], text = str.tostring( box.get_bottom( array.get(current_supply_box, 2))))
//     label.new(x = bar_index + 50, y = close[1], text = str.tostring( box.get_bottom( array.get(current_supply_box, 3))))
//     label.new(x = bar_index + 60, y = close[1], text = str.tostring( box.get_bottom( array.get(current_supply_box, 4))))


// ---------------------------------------------------------------------------------------------- //
showTR = input(title='Show TR', defval=false, group = '===== TR ALGO=====')

source = input(defval=close, title='Source')

// Smooth Average Range

per1 = input.int(defval=27, minval=1, title='Fast period')
mult1 = input.float(defval=1.6, minval=0.1, title='Fast range')

per2 = input.int(defval=55, minval=1, title='Slow period')
mult2 = input.float(defval=2, minval=0.1, title='Slow range')

smoothrng(x, t, m) =>
    wper = t * 2 - 1
    avrng = ta.ema(math.abs(x - x[1]), t)
    smoothrng = ta.ema(avrng, wper) * m
    smoothrng
smrng1 = smoothrng(source, per1, mult1)
smrng2 = smoothrng(source, per2, mult2)
smrng = (smrng1 + smrng2) / 2

// Range Filter

rngfilt(x, r) =>
    rngfilt = x
    rngfilt := x > nz(rngfilt[1]) ? x - r < nz(rngfilt[1]) ? nz(rngfilt[1]) : x - r : x + r > nz(rngfilt[1]) ? nz(rngfilt[1]) : x + r
    rngfilt
filt = rngfilt(source, smrng)

upward = 0.0
upward := filt > filt[1] ? nz(upward[1]) + 1 : filt < filt[1] ? 0 : nz(upward[1])
downward = 0.0
downward := filt < filt[1] ? nz(downward[1]) + 1 : filt > filt[1] ? 0 : nz(downward[1])

hband = filt + smrng
lband = filt - smrng

longCond = bool(na)
shortCond = bool(na)
longCond := source > filt and source > source[1] and upward > 0 or source > filt and source < source[1] and upward > 0
shortCond := source < filt and source < source[1] and downward > 0 or source < filt and source > source[1] and downward > 0

CondIni = 0
CondIni := longCond ? 1 : shortCond ? -1 : CondIni[1]

long = longCond and CondIni[1] == -1
short = shortCond and CondIni[1] == 1

// Plotting

plotshape(long, title='Long', text='Long', style=shape.labelup, textcolor=color.new(color.black, 0), size=size.tiny, location=location.belowbar, color=color.new(color.lime, 0))
plotshape(short, title='Short', text='Short', style=shape.labeldown, textcolor=color.new(color.white, 0), size=size.tiny, location=location.abovebar, color=color.new(color.red, 0))

// Alerts

alertcondition(long, title='Long', message='Long')
alertcondition(short, title='Short', message='Short')
How to Apply Pine Script in TradingView:
- Open TradingView and log in.
- Navigate to the Pine Script Editor at the bottom of the screen.
- Copy the provided Pine Script code.
- Paste it into the editor and click Save.
- Name the script, e.g., “KARALYTIX Options SuperNova.”
- Click Add to Chart to apply the script.
- Adjust settings in the indicator panel to suit your trading preferences.
Final Verdict:
The KARALYTIX Options SuperNova v1.0 is a comprehensive trading script tailored for precise market analysis across multiple timeframes. Its non-repainting nature ensures dependable signals for real-time and historical use. While the extensive features require some learning, the script is an excellent tool for traders looking to integrate key market levels, VWAPs, and volatility analysis into their trading strategies.
RELATED POSTS
View all
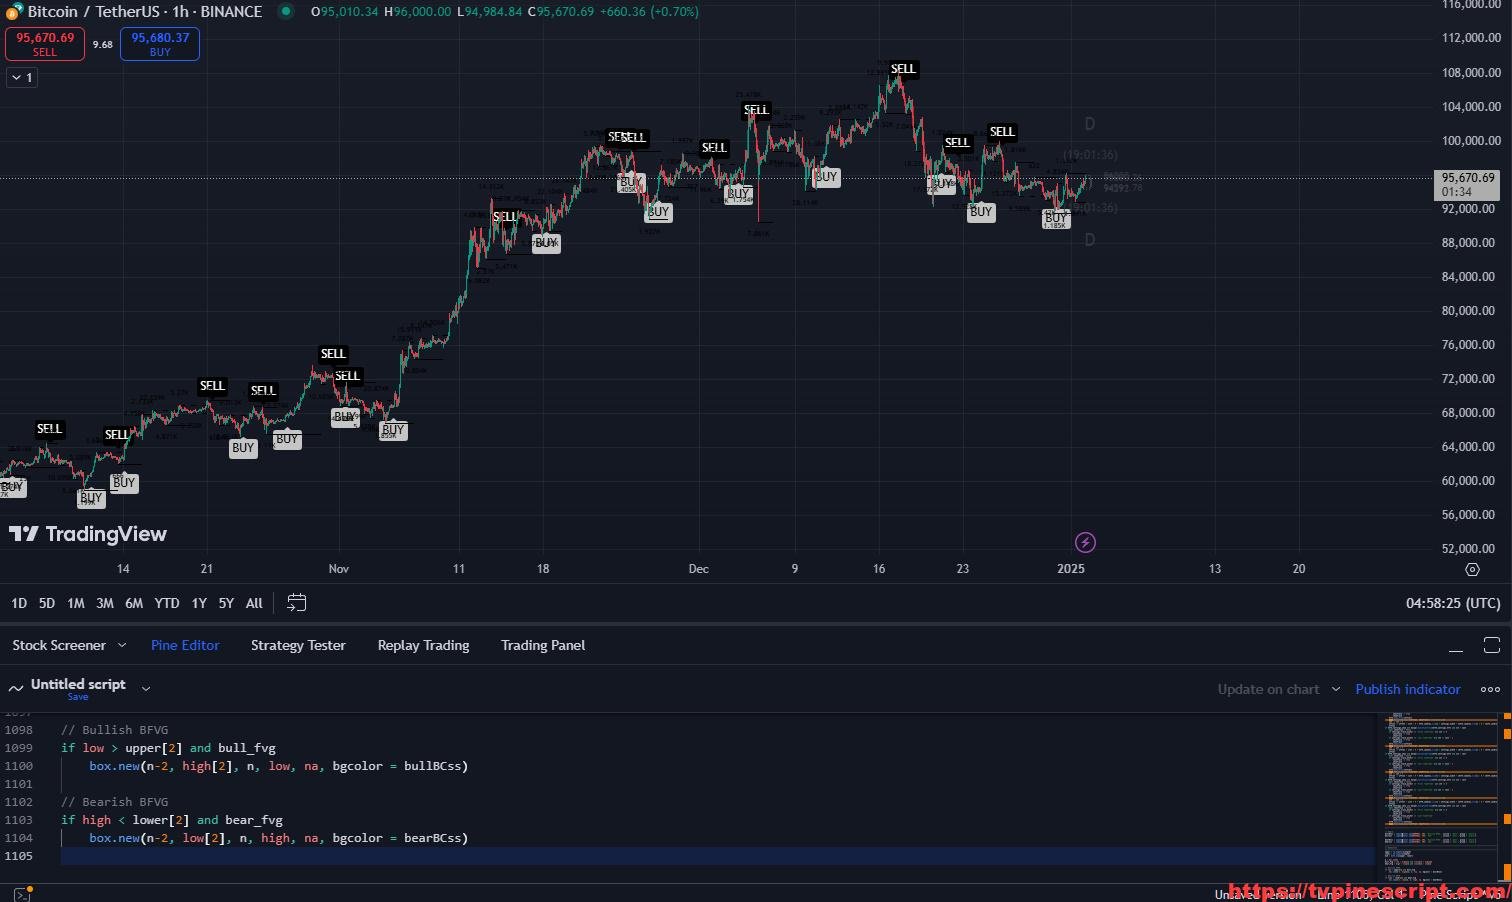
Comprehensive Market Analysis with Indian SnR + ICT HTF Candles + FVG + VWAP by Kuldeep Singh Negi
January 3, 2025 | by admin
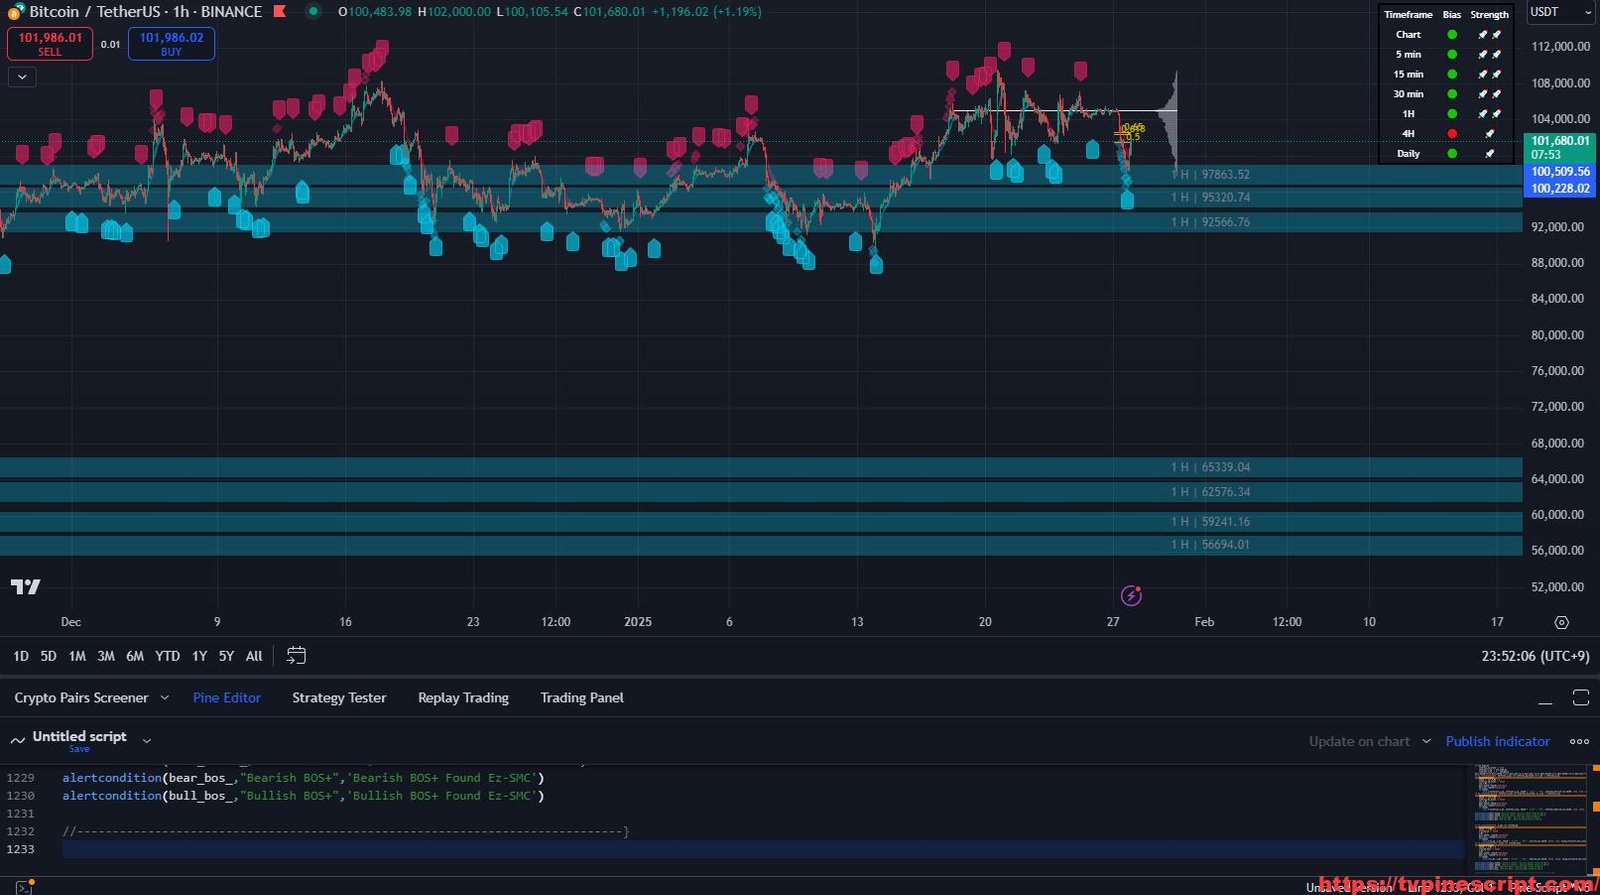
Indicator X – A Comprehensive Multi-Strategy Trading Indicator for Trend Analysis and Market Structure
January 27, 2025 | by admin
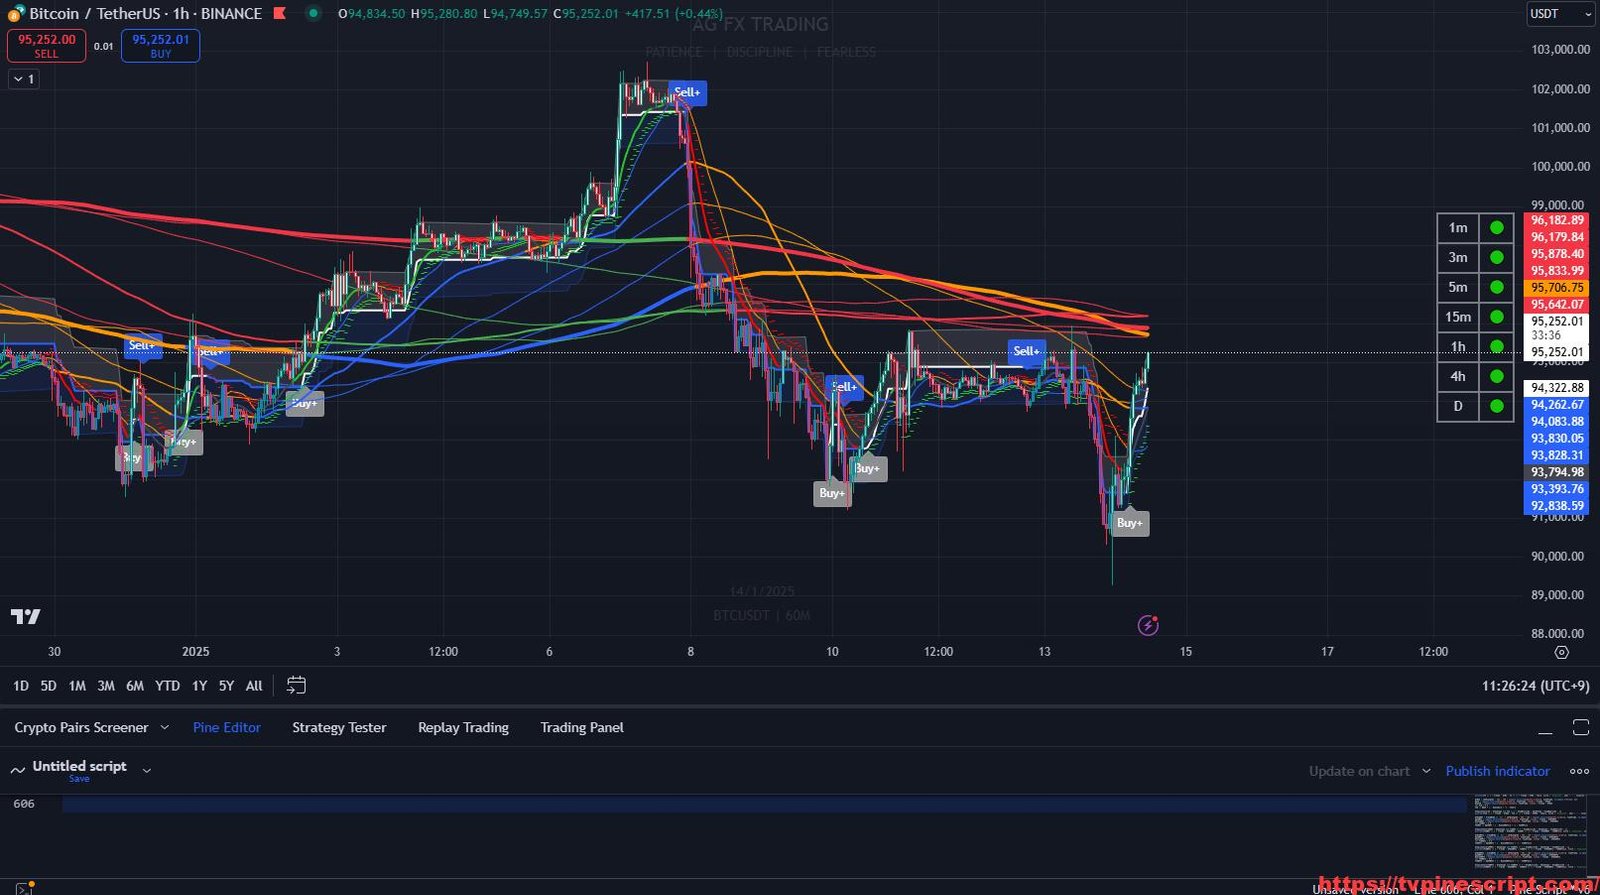
The REAL-GAINS Algo: Advanced ATR-Driven Trend and Range Filter Trading Strategy
January 14, 2025 | by admin