MagicFlakes Indicator: Precision Trading with Custom Volatility and Trend Signals
January 21, 2025 | by admin
Navigating the financial markets requires tools that not only track trends but also measure volatility with precision. The MagicFlakes Indicator offers a dynamic approach to market analysis by integrating custom volatility adjustments with trend confirmation signals. Whether you’re a short-term trader looking for quick entries or a long-term investor seeking trend validation, this indicator provides valuable insights to enhance your trading strategy.
However, always remember: no trading indicator guarantees profits. The MagicFlakes Indicator should be used as part of a comprehensive trading plan that includes risk management and a well-defined strategy.
Key Features of the Script:
- Custom Volatility Index (CVI):
- The indicator calculates a custom volatility index based on the difference between the closing price and a moving average of the high-low average (HL2).
- ATR (Average True Range) smoothing is used to dynamically adjust volatility readings.
- Bullish and Bearish Signal Detection:
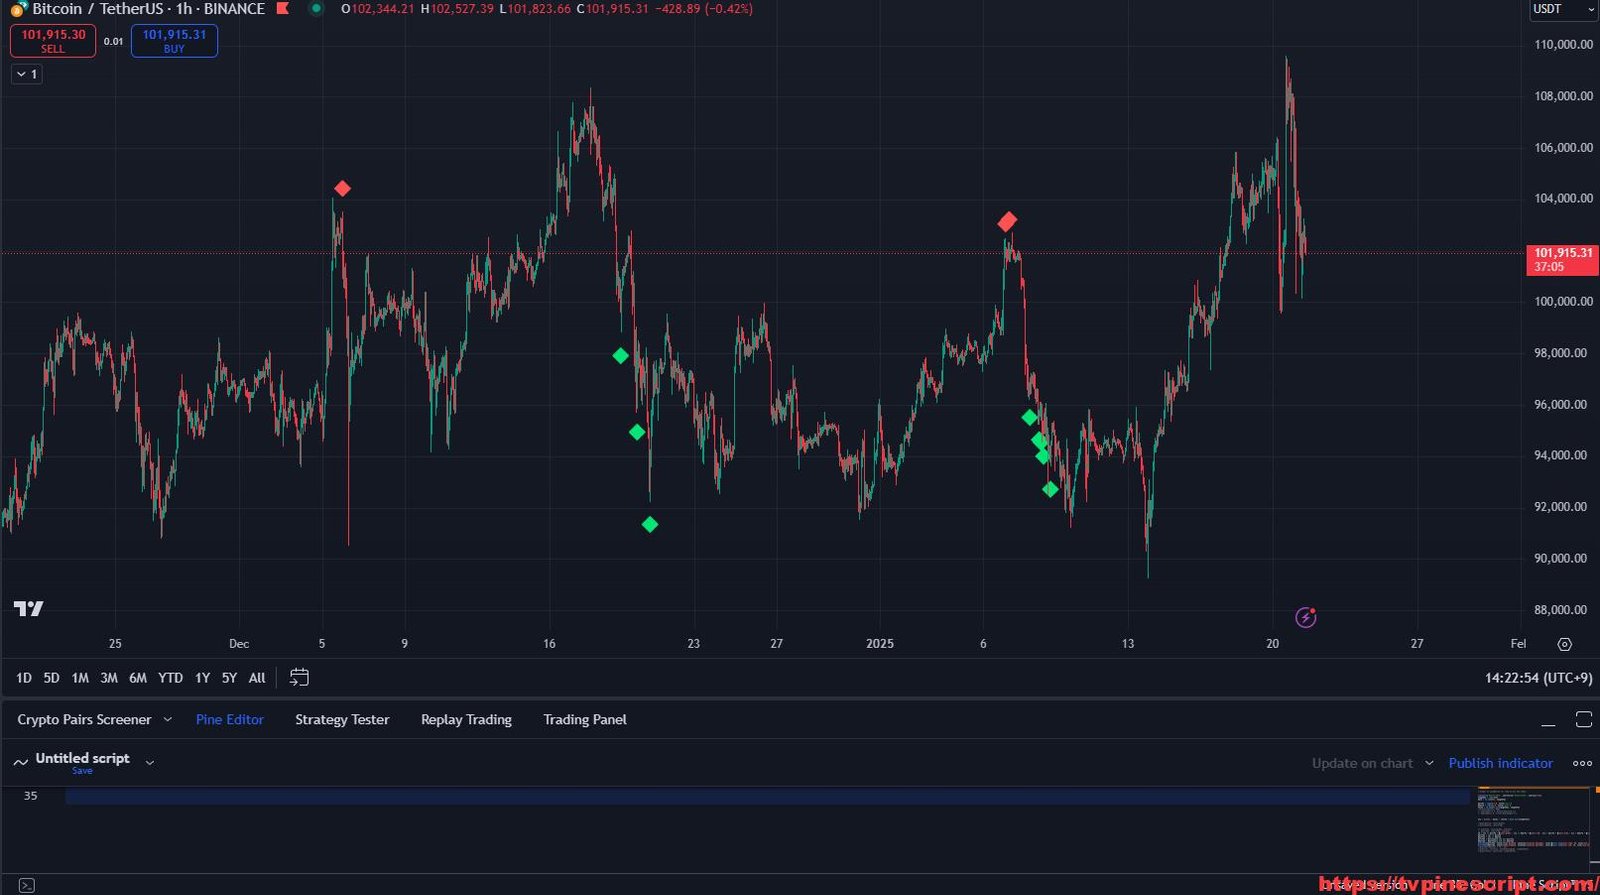
- The script identifies market conditions by comparing the CVI to predefined bullish (
-1.0) and bearish (1.0) thresholds. - Plots green diamonds for bullish trends and red diamonds for bearish trends, making trend shifts easy to visualize.
- The script identifies market conditions by comparing the CVI to predefined bullish (
- Adaptive Signal Filtering:
- Provides noise reduction by using moving averages over long periods to filter out minor fluctuations and focus on significant market movements.
- Color-Coded Trend Visualization:
- Candlestick colors are adjusted based on CVI values, highlighting bullish (green), bearish (red), and neutral (blue) conditions.
- This helps traders quickly interpret market sentiment at a glance.
- Configurable Inputs for Customization:
- Adjustable length for the CVI calculation, allowing traders to fine-tune sensitivity based on their trading style.
- Threshold customization to align with different risk tolerances and market conditions.
- Real-Time Alerts and Signal Confirmation:
- The script can be modified to trigger alerts when significant trend changes occur, ensuring traders don’t miss critical opportunities.
- Alerts can be used to confirm trend reversals and potential breakout/breakdown levels.
- Simple and Lightweight Design:
- Optimized for minimal chart clutter while still providing essential market insights.
- Suitable for use alongside other indicators like moving averages or oscillators.
Recommended Usage:
- Scalping:
- Best suited for 5-minute to 15-minute charts.
- Utilize bullish/bearish signals for quick in-and-out trades with tight stop-losses.
- Day Trading:
- Effective on 30-minute to 1-hour charts.
- Identify intraday trend shifts and align with support/resistance levels for entry.
- Swing Trading:
- Recommended for 4-hour to daily charts.
- Use the CVI to confirm larger trend movements and validate potential reversals.
- Risk Management Strategy:
- Leverage CVI thresholds to place stop-loss and take-profit levels strategically.
- Avoid entering trades in choppy markets by using trend confirmations from multiple timeframes.
Script Evaluation:
- Functionality: 4.5/5
A versatile trend and volatility indicator offering valuable insights for different trading styles. - Ease of Use: 4.2/5
While intuitive, traders may need to experiment with threshold settings to optimize for their market. - Accuracy: 4.3/5
Effective at detecting major trend shifts but should be combined with volume analysis for greater precision. - Repainting Analysis:
This script does not repaint.
Signals are generated based on confirmed bar data, making it reliable for both live trading and backtesting. - Optimal Timeframes:
- Scalping: 5-minute to 15-minute charts.
- Day Trading: 30-minute to 1-hour charts.
- Swing Trading: 4-hour to daily charts.
- Author and Development Quality:
The script credits LazyBearTy for some of the CVI code, reflecting a blend of community-driven and customized development. - Overall Score: 4.5/5
A solid trend-following and volatility-tracking tool with room for customization and further enhancements.
//@version=5

//Credit to LazyBearTy for some of his CVI code\\

indicator('MAGICFLAKES', shorttitle='MAGICFLAKES', overlay=true)
lengthTy = input(50)
ValC = ta.sma(hl2, lengthTy)

bullTy = input(-1.0, title='Bull')
bearTy = input(1.0, title='Bear')
volTy = ta.sma(ta.atr(lengthTy), lengthTy)
//filter=sma(cvi, 400)
// os2=input(-1.5, title="Oversold 2")
// ob2=input(1.5, title="Overbought 2")


cvi = (close - ValC) / (volTy * math.sqrt(lengthTy))

//plot(bullTy, color=green)
//plot(bearTy, color=red)

// plot(os2, color=green, style=3)
// plot(ob2, color=red, style=3)
cb = cvi <= bullTy ? color.green : cvi >= bearTy ? color.red : cvi > bullTy ? color.blue : cvi < bearTy ? color.blue : na
bullTy1 = cvi <= bullTy
bearTy1 = cvi >= bearTy
bullTy2 = bullTy1[1] and not bullTy1
bearTy2 = bearTy1[1] and not bearTy1
plotshape(bullTy2, style=shape.diamond, location=location.belowbar, color=color.new(color.lime, 0), size=size.small)
plotshape(bearTy2, style=shape.diamond, location=location.abovebar, color=color.new(color.red, 0), size=size.small)
//plotchar(bearTy1 ? cb : na)
//plot(cvi, color=cb, style=histogram, linewidth=2)
//plot(filter, color=red, linewidth=2)
How to Apply Pine Script in TradingView:
- Open TradingView and log in to your account.
- Navigate to the Pine Script Editor (bottom of the screen).
- Copy and paste the provided script code.
- Click Save, then name the script (e.g., “MagicFlakes Indicator”).
- Click Add to Chart to apply it.
- Customize parameters to fit your trading strategy.
Additional Trading Tips:
- Pair with Volume Indicators:
Combine the MagicFlakes Indicator with OBV or volume profile tools to confirm the strength of detected trends. - Backtest on Different Timeframes:
Before going live, ensure to test the indicator across multiple assets and timeframes to find the most effective settings. - Avoid Overtrading:
Focus on high-confluence setups rather than reacting to every signal to maintain a disciplined trading approach.
Final Thoughts:
The MagicFlakes Indicator offers traders a unique blend of volatility and trend analysis, making it a useful tool for spotting high-probability trade opportunities. Whether you’re a scalper looking for quick trades or a swing trader analyzing broader trends, this indicator provides a clear framework for market decision-making.
However, always remember that no trading strategy is foolproof, and success comes from combining technical analysis with solid risk management.
RELATED POSTS
View all
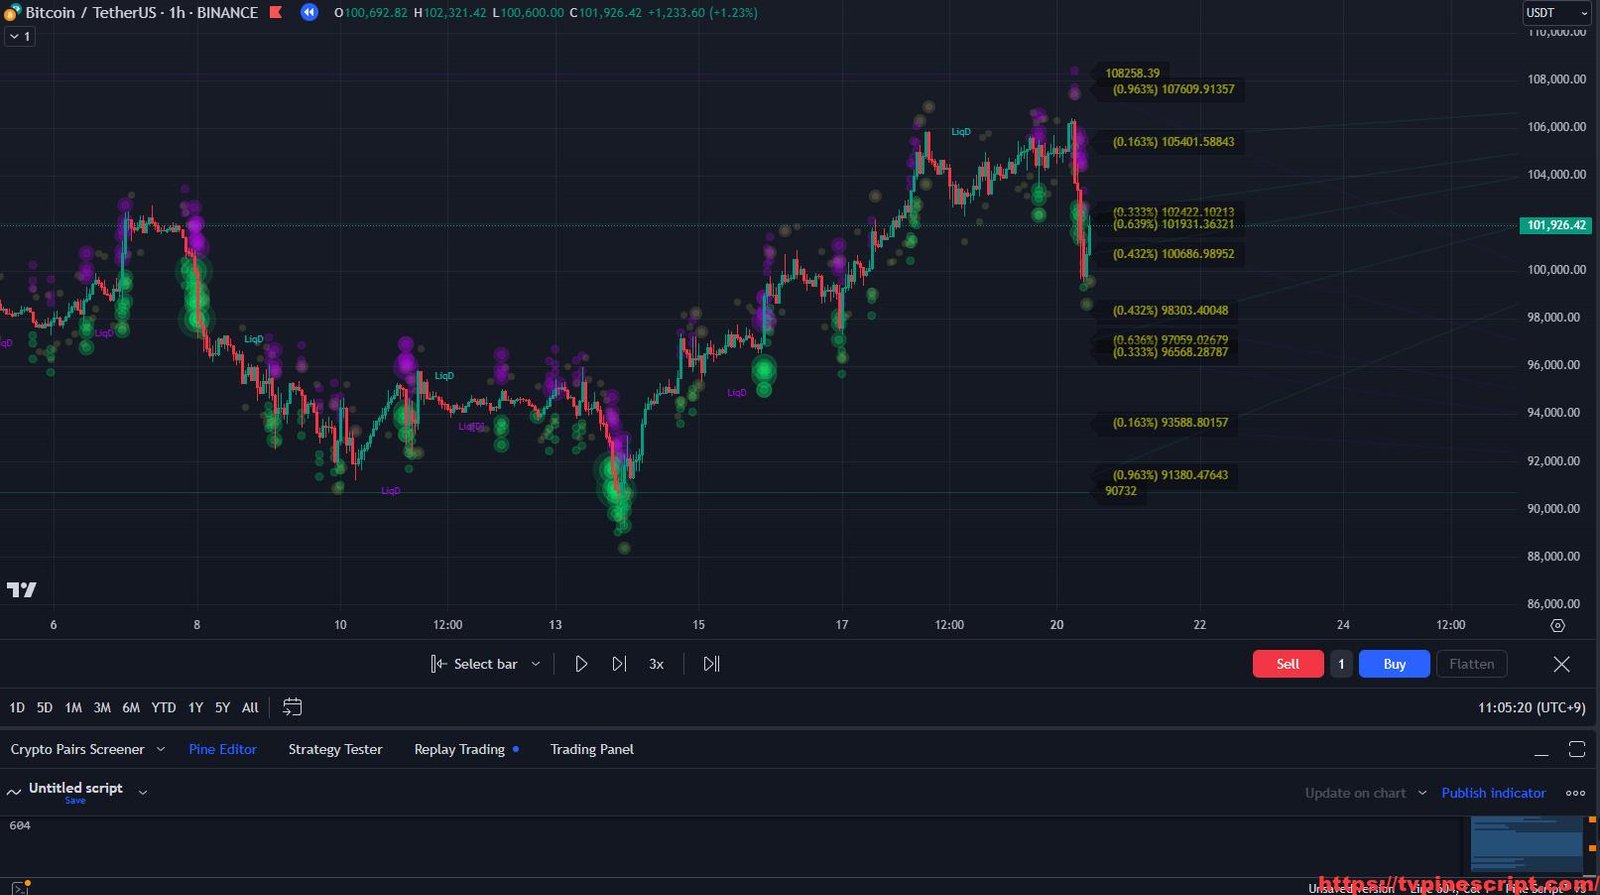
Master Market Liquidity with LiqD Liquidation Heatmap SB[ɅI]: A Game-Changer for Smart Trading Decisions
January 21, 2025 | by admin
KARALYTIX Options SuperNova v1.0: Comprehensive Market Levels and Volatility Analysis Tool
January 14, 2025 | by admin
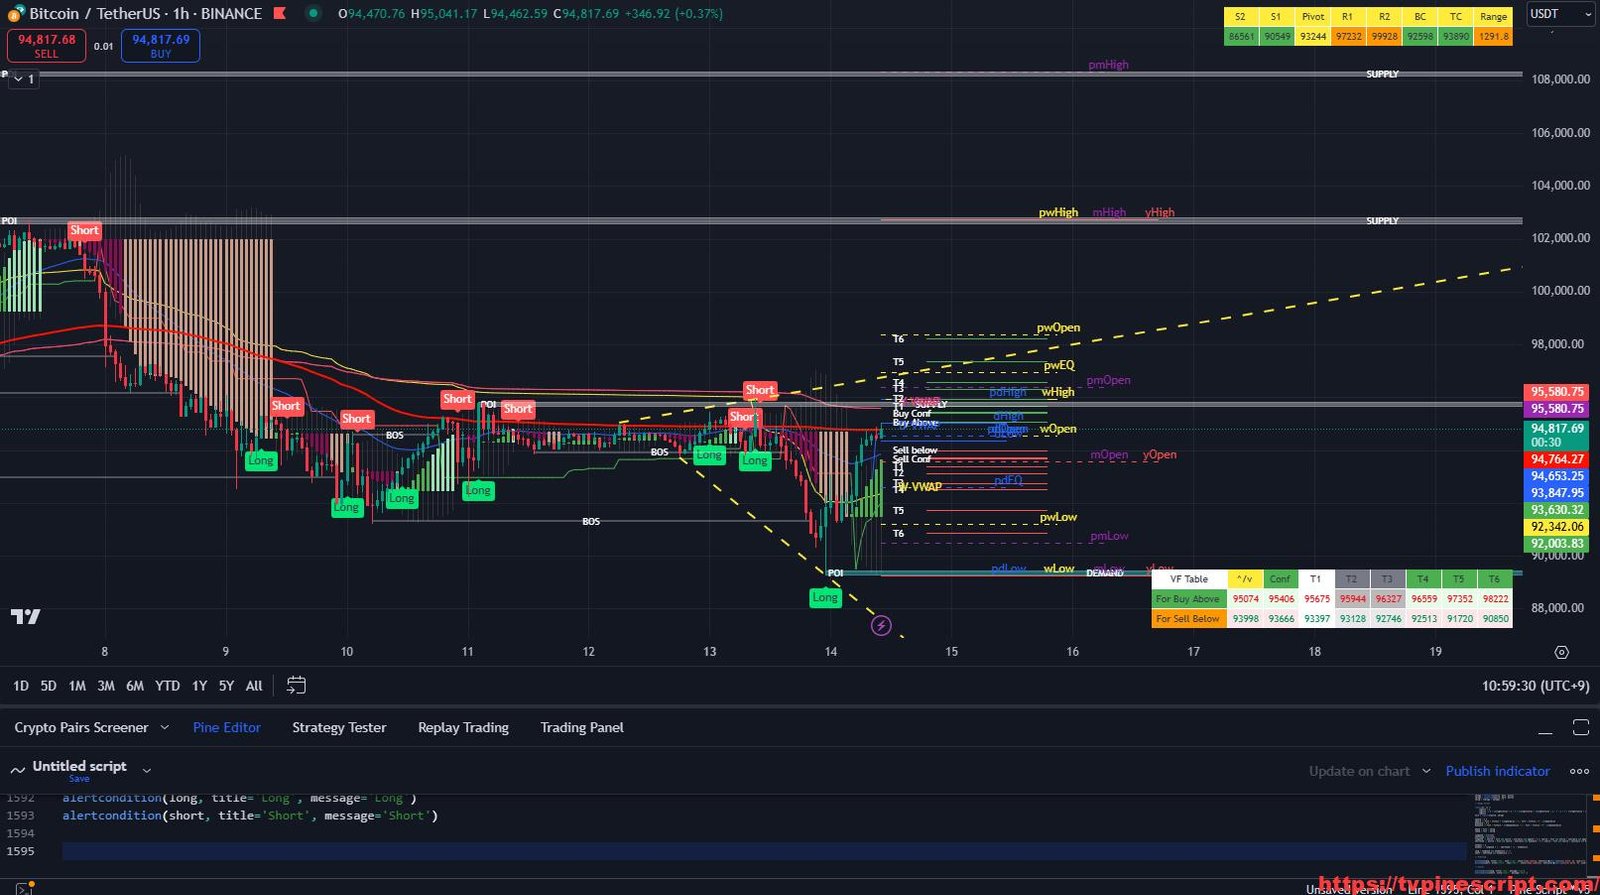
Algo Sambu: A Comprehensive Indicator for Multi-Faceted Trading Analysis
January 3, 2025 | by admin