Matrix Oscillator: Precision Market Analysis with Divergence Detection
January 23, 2025 | by admin
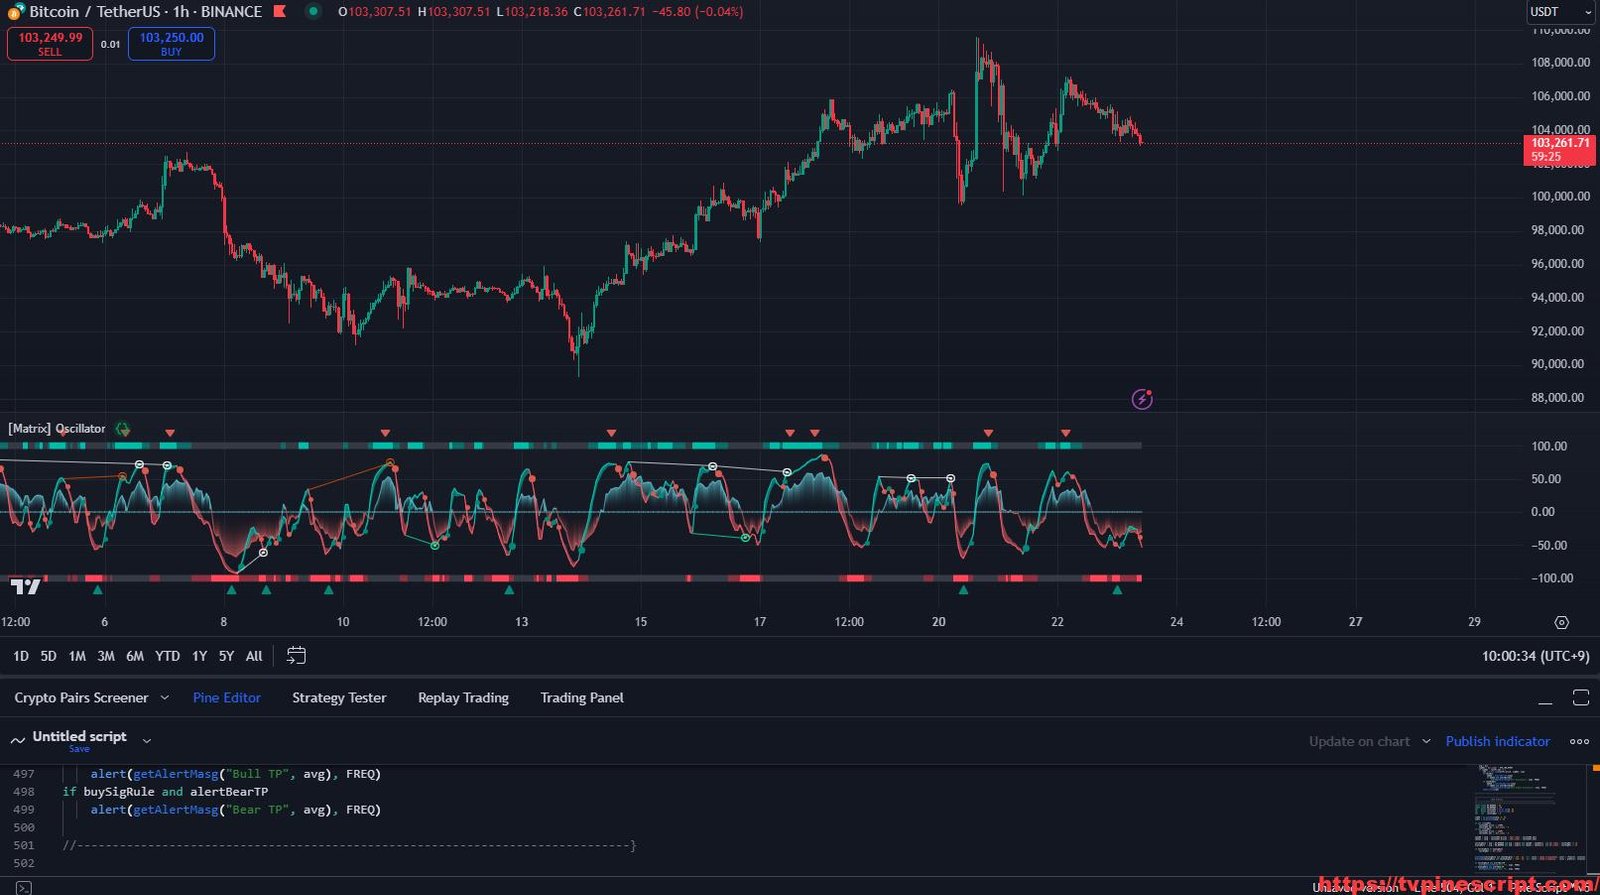
Understanding market momentum and price action is key to profitable trading. The Matrix Oscillator is a powerful indicator designed to provide traders with comprehensive insights into market trends by combining RSI, MFI, and Stochastic calculations. It helps identify overbought/oversold conditions, divergences, and trend reversals, making it an essential tool for both novice and experienced traders.
⚠ Disclaimer: No trading indicator guarantees profits. The Matrix Oscillator should be used as a supplementary analysis tool within a well-structured trading plan and proper risk management strategies.
🛠 Key Features of the Matrix Oscillator
- Signal Line for Trend Direction:
- Combines RSI, MFI, and Stochastic indicators for a comprehensive market sentiment overview.
- Smooths out market noise for clear buy/sell signals.
- Customizable colors for bullish and bearish trends.
- Histogram for Momentum Visualization:
- Displays market strength with easy-to-interpret color-coded bars.
- Highlights shifts in momentum for potential trend changes.
- Divergence Detection (Regular & Hidden):
- Identifies both regular and hidden divergences to predict possible reversals.
- Plots bullish (green) and bearish (red) divergence lines.
- Automatically removes invalid divergence lines for better chart clarity.
- Dynamic Reversal Points:
- Marks potential turning points with color-coded circles.
- Helps traders anticipate trend shifts before they occur.
- Take Profit (TP) Signal System:
- Suggests optimal take-profit levels based on market conditions.
- Customizable to match different trading styles.
- Custom Alerts for Entry/Exit Points:
- Alerts for divergence, take-profit signals, and trend shifts.
- Keeps traders informed without the need for constant monitoring.
- Multi-Timeframe Compatibility:
- Effective across different timeframes, from 1-minute scalping to daily swing trading.
- Best suited for 5-minute, 15-minute, 1-hour, and 4-hour charts.
📊 Recommended Usage
- Scalping (1M-15M Charts):
- Focus on quick trades using histogram momentum and reversal points.
- Combine with moving averages for additional confirmation.
- Day Trading (30M-1H Charts):
- Use divergence detection to enter trades at key support/resistance levels.
- Utilize alerts for trend-following strategies.
- Swing Trading (4H-Daily Charts):
- Leverage take-profit signals for longer-term trend analysis.
- Identify overbought/oversold zones for high-probability entries.
🔍 Script Evaluation
- Functionality: 4.8/5
A comprehensive oscillator that provides multiple trading signals, reducing noise and improving decision-making. - Ease of Use: 4.3/5
Requires some learning curve due to the number of features available, but customizable settings make it flexible. - Accuracy: 4.5/5
Performs well in trending markets but may need additional filters for ranging conditions. - Repainting Analysis:
No repainting detected. The script calculates and confirms values based on closed bars, ensuring reliable signals for live trading. - Optimal Timeframes:
- Scalping: 1-minute to 15-minute charts.
- Day Trading: 30-minute to 1-hour charts.
- Swing Trading: 4-hour to daily charts.
- Overall Score: 4.7/5
A highly reliable oscillator that combines multiple technical indicators to provide a comprehensive market outlook.
//@version=5
indicator("[𝖬𝖺𝗍𝗋𝗂𝗑] 𝖮𝗌𝖼𝗂𝗅𝗅𝖺𝗍𝗈𝗋", overlay = false, max_lines_count = 500,max_labels_count = 500)

//-----------------------------------------------------------------------------
//              Input | Settings
//------------------------------------------------------------------------------
//------------------------------------------------------------------------------{
const string FREQ = alert.freq_once_per_bar_close
const color NO_COLOR = color.new(#000000, 100)

const string MAIN_INPUT = "🚀 Signal Line"
showMainLine    = input.bool    (true,            "Turn On/Off",        group = MAIN_INPUT, inline="Main", display = display.none)
gColor          = input.color   (#00cfba,    "",                   group = MAIN_INPUT, inline="Main", display = display.none)
rColor          = input.color   (#ff5f6a,       "",                   group = MAIN_INPUT, inline="Main", display = display.none)
rsiLen          = input.int     (10,              "Length", minval = 1, group = MAIN_INPUT,                display = display.none)
smoothLen       = input.int     (3,               "Smooth", minval = 1, group = MAIN_INPUT,                display = display.none)
const string HIST_INPUT = "📊 Histogram"
showHist        = input.bool    (true,            "Turn On/Off",        group = HIST_INPUT, inline="hist", display = display.none)
histColorUp     = input.color   (#6de6f693,     "",                   group = HIST_INPUT, inline="hist", display = display.none)
histColorDn     = input.color   (#f66d6d93,     "",                   group = HIST_INPUT, inline="hist", display = display.none)
inputMfiLen     = input.int     (15,              "Length", minval = 5, group = HIST_INPUT,                display = display.none)
smoothHist      = input.int     (1,               "Smooth", minval = 1, group = HIST_INPUT,                display = display.none)
fastMfiLen      = math.round    (inputMfiLen / 1.33)
slowMfiLen      = math.round    (inputMfiLen * 1.33)

const string OTHER_INPUT = "💡 Other"
showDiv         = input.bool    (true,          "Show Divergence Line   ", group = OTHER_INPUT, inline="div",     display = display.none)
bullDivColor    = input.color   (color.white, "",                        group = OTHER_INPUT, inline="div",     display = display.none)
bearDivColor    = input.color   (color.white, "",                        group = OTHER_INPUT, inline="div",     display = display.none)

showHidDiv      = input.bool    (true,         "Show Hidden Divergence",  group = OTHER_INPUT, inline="hiddiv",  display = display.none)
bullHidDivColor = input.color   (#07ffac,     "",                        group = OTHER_INPUT, inline="hiddiv",  display = display.none)
bearHidDivColor = input.color   (#ff5500,     "",                        group = OTHER_INPUT, inline="hiddiv",  display = display.none)

showStatusLine  = input.bool    (true,          "Show Status Line       ", group = OTHER_INPUT, inline="Status",  display = display.none)
gStatColor      = input.color   (#02bcaa,  "",                        group = OTHER_INPUT, inline="Status",  display = display.none)
rStatColor      = input.color   (#ff475c,  "",                          group = OTHER_INPUT, inline="Status",  display = display.none)

showTpSignal    = input.bool    (true,          "Show TP Signal         ", group = OTHER_INPUT, inline="tp",      display = display.none)
gTpColor        = input.color   (color.teal,  "",                        group = OTHER_INPUT, inline="tp",      display = display.none)
rTpColor        = input.color   (#da5b52,     "",                        group = OTHER_INPUT, inline="tp",      display = display.none)

showReverseDots = input.bool    (true,          "Show Reversal points    ", group = OTHER_INPUT, inline="rd",     display = display.none)
gRdColor        = input.color   (color.teal,  "",                         group = OTHER_INPUT, inline="rd",     display = display.none)
rRdColor        = input.color   (#da5b52,     "",                         group = OTHER_INPUT, inline="rd",     display = display.none)

delOldDiv       = input.bool    (true,    "Delete Broken Divergence Lines", group = OTHER_INPUT,                  display = display.none)


//------------------------------------------------------------------------------}

//-----------------------------------------------------------------------------
//              Alerts
//------------------------------------------------------------------------------
//------------------------------------------------------------------------------{

const string ALERT_INPUT = "🔔 ALERTS CUSTOMIZATION\n"

alertSigUp = input.bool     (false,     "Signal Line Bull       ",  inline="a1", group = ALERT_INPUT, display = display.none)
alertSigDn = input.bool     (false,     "Bear",                     inline="a1", group = ALERT_INPUT, display = display.none)

alertBullTP = input.bool    (false,     "TP Bull               ",   inline="a2", group = ALERT_INPUT, display = display.none)
alertBearTP = input.bool    (false,     "Bear",                     inline="a2", group = ALERT_INPUT, display = display.none)

alertStatusUp = input.bool  (false,     "Status Bull            ",  inline="a3", group = ALERT_INPUT, display = display.none)
alertStatusDn = input.bool  (false,     "Bear",                     inline="a3", group = ALERT_INPUT, display = display.none)
alertStatusUpP = input.bool (false,     "Status Bull+           ",  inline="a4", group = ALERT_INPUT, display = display.none)
alertStatusDnP = input.bool (false,     "Bear+",                    inline="a4", group = ALERT_INPUT, display = display.none)

alertBullDiv = input.bool   (false,     "Divergence Bull       ",   inline="a5", group = ALERT_INPUT, display = display.none)
alertBearDiv = input.bool   (false,     "Bear",                     inline="a5", group = ALERT_INPUT, display = display.none)

alertBullHidDiv = input.bool(false,     "Hidden Divergence Bull ",  inline="a6", group = ALERT_INPUT, display = display.none)
alertBearHidDiv = input.bool(false,     "Bear",                     inline="a6", group = ALERT_INPUT, display = display.none)

inputMsg = input.text_area("List of Supported Placeholders:\n{{trigger}} - Trigger name ('Buy', 'Bullish Take Profit')\n{{indicator}} - Indicator Value\n{{exchange}} - Exchange ('Binance')\n{{ticker}} - Ticker ('BTCUSD')\n{{interval}} - Timeframe ('1s', '1', 'D')\n{{open}}-{{close}}-{{high}}-{{low}} - Candle price values\n{{volume}} - Candle volume\n{{time}} - Candle open time in UTC timezone\n{{timenow}} - Signal time in UTC timezone\n{{syminfo.currency}} - 'USD' for BTCUSD pair\n{{syminfo.basecurrency}} - 'BTC' for BTCUSD pair", "", group = ALERT_INPUT, display = display.none)


getAlertMasg(string trigger, float ind=0.0)=>
    alertMsg =  str.replace_all(inputMsg, "{{exchange}}", syminfo.prefix)
    alertMsg := str.replace_all(alertMsg, "{{ticker}}",   syminfo.ticker)
    alertMsg := str.replace_all(alertMsg, "{{volume}}",   str.tostring(volume, format.volume))
    alertMsg := str.replace_all(alertMsg, "{{close}}",    str.tostring(close, format.price))
    alertMsg := str.replace_all(alertMsg, "{{open}}",     str.tostring(open, format.price))
    alertMsg := str.replace_all(alertMsg, "{{high}}",     str.tostring(high, format.price))
    alertMsg := str.replace_all(alertMsg, "{{low}}",      str.tostring(low, format.price))
    alertMsg := str.replace_all(alertMsg, "{{time}}",     str.format_time(time, "yyyy-MM-dd", "Etc/UTC")+"T"+str.format_time(time, "HH:mm:ss", "Etc/UTC")+"Z")
    alertMsg := str.replace_all(alertMsg, "{{timenow}}",  str.format_time(timenow, "yyyy-MM-dd", "Etc/UTC")+"T"+str.format_time(timenow, "HH:mm:ss", "Etc/UTC")+"Z")
    alertMsg := str.replace_all(alertMsg, "{{interval}}", timeframe.period)
    alertMsg := str.replace_all(alertMsg, "{{syminfo.currency}}", syminfo.currency)
    alertMsg := str.replace_all(alertMsg, "{{syminfo.basecurrency}}", syminfo.basecurrency)
    alertMsg := str.replace_all(alertMsg, "{{trigger}}", trigger)
    alertMsg := str.replace_all(alertMsg, "{{indicator}}", str.tostring(ind, "##.#"))
    alertMsg

//------------------------------------------------------------------------------}

//-----------------------------------------------------------------------------
//              Main
//------------------------------------------------------------------------------
//------------------------------------------------------------------------------{
const int   MFI_LEN     = 7
const int   STOCH_K     = 2
const int   STOCH_D     = 5
const float SMOOTH_LEN  = 1.75
const float STOCH_WEIGHT = 0.4
const float OVERBOUGHT   = 60.0
const float EXTEND_MULT  = 1
var   float mfiWeight    = 0.4

rsiSrc = hlc3

transform(src, mult=1)=>
    tmp = (src / 100 - 0.5)*2
    mult * 100 * ((tmp > 0 ? 1 : -1) * math.pow(math.abs(tmp), 0.75))

//Histogram
fastMfi = ta.mfi(rsiSrc, fastMfiLen)
slowMfi = ta.mfi(rsiSrc, slowMfiLen)
resMfi = transform(ta.sma(fastMfi*0.5 + slowMfi*0.5, smoothHist), 0.7)

midLine = plot(0, color = histColorUp, editable = false, display = display.pane)
histColor = showHist ? resMfi >= 0 ? histColorUp : histColorDn : NO_COLOR
longterm = plot(resMfi, color = histColor, editable = false, display = display.pane) //20*macd/ta.highest(absMACD,20) + 50
fill(longterm, midLine, resMfi, 0, histColor, NO_COLOR, editable = false)

//Siganl
mfi = ta.mfi(rsiSrc, MFI_LEN)
rsi = ta.rsi(rsiSrc, rsiLen)
stoch = ta.sma(ta.stoch(rsi, rsi, rsi, rsiLen), STOCH_K)
sigStoch = ta.sma(stoch, STOCH_D)
if na(volume)
    mfi := 0
    mfiWeight := 0

signal = (rsi + mfiWeight*mfi + STOCH_WEIGHT*stoch)/(1+mfiWeight+STOCH_WEIGHT)
avg =  transform(ta.ema(signal, smoothLen), EXTEND_MULT)
avg2 = transform(ta.ema(signal, math.round(smoothLen * SMOOTH_LEN)), EXTEND_MULT)

resColor = showMainLine ? avg2 < avg ? gColor : rColor : NO_COLOR
s1 = plot(avg, "Avg",   resColor, linewidth = 1, editable = false, display = display.pane)
s2 = plot(avg2, "Avg2", NO_COLOR, linewidth = 1, editable = false, display = display.pane)
fill(s1, s2, color.new(resColor, 50), "diff", editable = false)


plot(showMainLine and showReverseDots and avg2 < avg and resColor != resColor[1] and avg[1] < -OVERBOUGHT ? avg2 : na, "Signal Direction Up",       color = gRdColor, display = display.pane, style = plot.style_circles, linewidth = 3, editable = false)
plot(showMainLine and showReverseDots and avg2 < avg and resColor != resColor[1] and avg[1] >= -OVERBOUGHT ? avg2 : na, "Signal Direction Up ch",   color = gRdColor, display = display.pane, style = plot.style_circles, linewidth = 2, editable = false)
plot(showMainLine and showReverseDots and avg2 > avg and resColor != resColor[1] and avg[1] > OVERBOUGHT ? avg2 : na, "Signal Direction Down",      color = rRdColor, display = display.pane, style = plot.style_circles, linewidth = 3, editable = false)
plot(showMainLine and showReverseDots and avg2 > avg and resColor != resColor[1] and avg[1] <= OVERBOUGHT ? avg2 : na, "Signal Direction Down ch",  color = rRdColor, display = display.pane, style = plot.style_circles, linewidth = 2, editable = false)

if alertSigUp and avg2 < avg and avg2[1] >= avg[1]
    alert(getAlertMasg("Signal Line Bull", avg), FREQ)
if alertSigDn and avg2 > avg and avg2[1] <= avg[1]
    alert(getAlertMasg("Signal Line Bear", avg), FREQ)

var allIndVal = array.new<float>()
var allLows = array.new<float>()
var allHighs = array.new<float>()

if barstate.isconfirmed
    allIndVal.unshift(avg)
    allLows.unshift(low)
    allHighs.unshift(high)
    if allIndVal.size() > 100
        allIndVal.pop()
        allLows.pop()
        allHighs.pop()
//------------------------------------------------------------------------------}

//-----------------------------------------------------------------------------
//              Status Line
//------------------------------------------------------------------------------
//------------------------------------------------------------------------------{
score = 0
if avg > avg2
    score += 1
if avg > 0
    score += 1
if resMfi > 0
    score += 1

upLimitColor = showStatusLine ? score == 3 ? gStatColor : score == 2 ? color.new(gStatColor, 50) : color.black : NO_COLOR
dnLimitColor = showStatusLine ? score == 0 ? rStatColor : score == 1 ? color.new(rStatColor, 50) : color.black : NO_COLOR

upLimit1 = plot(95, "upLimit1", NO_COLOR, editable = false, display = display.pane)
upLimit2 = plot(105, "upLimit2", NO_COLOR, editable = false, display = display.pane)
fill(upLimit1, upLimit2, upLimitColor, "Up Limit", editable = false)
dnLimit1 = plot(-95, "dnLimit1", NO_COLOR, editable = false, display = display.pane)
dnLimit2 = plot(-105, "dnLimit2", NO_COLOR, editable = false, display = display.pane)
fill(dnLimit1, dnLimit2,  dnLimitColor, "Down Limit", editable = false)

if alertStatusUp and score >= 2 and score[1] < 2
    alert(getAlertMasg("Status Bull", avg), FREQ)
if alertStatusUpP and score >= 3 and score[1] < 3
    alert(getAlertMasg("Status Bull+", avg), FREQ)
if alertStatusDn and score <= 1 and score[1] > 1
    alert(getAlertMasg("Status Bear", avg), FREQ)
if alertStatusDnP and score <= 0 and score[1] > 0
    alert(getAlertMasg("Status Bear+", avg), FREQ)

//------------------------------------------------------------------------------}

//-----------------------------------------------------------------------------
//              Divergence Functions
//------------------------------------------------------------------------------
//------------------------------------------------------------------------------{
type Pivot
    float price
    int   ndx
    float indicator

type DiverLine
    line    ln
    label   lb

const int MAX_ARR_PIV_SIZE = 5
const int MAX_ARR_LINE_SIZE = 250
const int PIV_LEN_LEFT = 7
const int PIV_LEN_RIGHT = 1
const int MIN_PEAK_DIST = 7
const int MAX_PEAK_DIST = 80

var pivHigh = array.new<Pivot>()
var pivLow  = array.new<Pivot>()

var bullDivers = array.new<DiverLine>()
var bearDivers = array.new<DiverLine>()
var bullHidDivers = array.new<DiverLine>()
var bearHidDivers = array.new<DiverLine>()

addPivotHigh(Pivot newPiv)=>
    if pivHigh.size() > 0
        prev = pivHigh.first()
        if prev.price < newPiv.price and prev.indicator < newPiv.indicator
            pivHigh.shift()
    pivHigh.unshift(newPiv)
    if pivHigh.size() > MAX_ARR_PIV_SIZE
        pivHigh.pop()

addPivotLow(Pivot newPiv)=>
    if pivLow.size() > 0
        prev = pivLow.first()
        if prev.price > newPiv.price and prev.indicator > newPiv.indicator
            pivLow.shift()
    pivLow.unshift(newPiv)
    if pivLow.size() > MAX_ARR_PIV_SIZE
        pivLow.pop()

method checkArrLineLength(array<DiverLine> arr)=>
    if arr.size() > MAX_ARR_LINE_SIZE
        _ln = arr.shift()
        _ln.ln.delete()
        _ln.lb.delete()

method addDiverLine(array<DiverLine> arr, DiverLine newLine)=>
    x1 = newLine.ln.get_x1()
    x2 = newLine.ln.get_x2()
    if arr.size() > 0
        for i = arr.size() - 1 to 0
            _ln  = arr.get(i)
            if _ln.ln.get_x1() < x1
                break
            else if delOldDiv
                _ln.ln.delete()
                _ln.lb.delete()
                arr.remove(i)
            else
                _ln.ln.set_style(line.style_dotted)
                _ln.ln.set_width(1)
                _ln.lb.set_textcolor(NO_COLOR)
    arr.push(newLine)
    arr.checkArrLineLength()

isGreaterIndValue(int start, int end, float maxIndVal)=>
    res = true
    for i = bar_index - end to bar_index - start
        if allIndVal.get(i) > maxIndVal
            res := false
            break
    res

isLowerIndValue(int start, int end, float minIndVal)=>
    res = true
    for i = bar_index - start to bar_index - end
        if allIndVal.get(i) < minIndVal
            res := false
            break
    res

isGreaterHigh(int start, int end, float pointHigh)=>
    res = true
    for i = bar_index - end to bar_index - start
        if allHighs.get(i) > pointHigh
            res := false
            break
    res

isLowerLow(int start, int end, float pointLow)=>
    res = true
    for i = bar_index - start to bar_index - end
        if allLows.get(i) < pointLow
            res := false
            break
    res

isNoCrossAbove(Pivot piv1, Pivot piv2)=>
    res = true
    speed = (piv2.indicator - piv1.indicator) / (piv2.ndx - piv1.ndx)
    y0 = piv1.indicator - speed * piv1.ndx
    for i = bar_index - piv2.ndx to bar_index - piv1.ndx
        yi = y0 + speed * (bar_index - i)
        if allIndVal.get(i) > yi
            res := false
            break
    res

isNoCrossBelow(Pivot piv1, Pivot piv2)=>
    res = true
    speed = (piv2.indicator - piv1.indicator) / (piv2.ndx - piv1.ndx)
    y0 = piv1.indicator - speed * piv1.ndx
    for i = bar_index - piv2.ndx to bar_index - piv1.ndx
        yi = y0 + speed * (bar_index - i)
        if allIndVal.get(i) < yi
            res := false
            break
    res

drawNewDiv(Pivot piv1, Pivot piv2, bool isBull, bool isHid = false)=>
    clr = switch
        not isHid => isBull ? bullDivColor : bearDivColor
        isHid => isBull ? bullHidDivColor : bearHidDivColor
    _line = line.new(x1 = piv1.ndx, x2 = piv2.ndx, y1 = piv1.indicator, y2 = piv2.indicator, color = color.new(clr, 30), width = 1)
    _label = label.new(x = piv2.ndx, y = piv2.indicator, text = "⊚︎", color = NO_COLOR, style = label.style_text_outline, size = size.small, textcolor = clr)
    divLine = DiverLine.new(_line, _label)
    arr = switch
        not isHid => isBull ? bullDivers : bearDivers
        isHid => isBull ? bullHidDivers : bearHidDivers
    arr.addDiverLine(divLine)

searchBearDiv(Pivot newPiv)=>
    result = false
    lastIndHigh = newPiv.indicator
    if lastIndHigh > 0
        for piv in pivHigh
            if newPiv.ndx - piv.ndx >= MAX_PEAK_DIST
                break
            if piv.price > newPiv.price
                break
            if piv.indicator > lastIndHigh
                lastIndHigh := piv.indicator
            if piv.price <= newPiv.price and piv.indicator > newPiv.indicator and piv.indicator >= lastIndHigh and (newPiv.ndx - piv.ndx >= MIN_PEAK_DIST) and piv.indicator > 50
                if isGreaterIndValue(piv.ndx, newPiv.ndx, piv.indicator) and isGreaterHigh(piv.ndx, newPiv.ndx, newPiv.price)
                    drawNewDiv(piv, newPiv, false)
                    result := true
                    break
    result

searchBullDiv(Pivot newPiv)=>
    result = false
    newIndLow = newPiv.indicator
    if newIndLow < 0
        for piv in pivLow
            if newPiv.ndx - piv.ndx >= MAX_PEAK_DIST
                break
            if piv.price < newPiv.price
                break
            if piv.indicator < newIndLow
                newIndLow := piv.indicator
            if piv.price >= newPiv.price and piv.indicator < newPiv.indicator and piv.indicator <= newIndLow and (newPiv.ndx - piv.ndx >= MIN_PEAK_DIST) and piv.indicator < -50
                if isLowerIndValue(piv.ndx, newPiv.ndx, piv.indicator) and isLowerLow(piv.ndx, newPiv.ndx, newPiv.price)
                    drawNewDiv(piv, newPiv, true)
                    result := true
                    break
    result

searchHidBullDiv(Pivot newPiv)=>
    result = false
    maxSpeed = -200.0
    for piv in pivLow
        if newPiv.ndx - piv.ndx >= MAX_PEAK_DIST
            break
        speed = (newPiv.indicator - piv.indicator) / (newPiv.ndx - piv.ndx)
        if speed > maxSpeed
            maxSpeed := speed
            if piv.price <= newPiv.price and piv.indicator > newPiv.indicator and (newPiv.ndx - piv.ndx >= MIN_PEAK_DIST) and piv.indicator < 0
                if isLowerIndValue(piv.ndx, newPiv.ndx, newPiv.indicator) and isLowerLow(piv.ndx, newPiv.ndx, piv.price) and isNoCrossBelow(piv, newPiv)
                    drawNewDiv(piv, newPiv, true, true)
                    result := true
                    break
    result

searchHidBearDiv(Pivot newPiv)=>
    result = false
    minSpeed = 200.0
    for piv in pivHigh
        if newPiv.ndx - piv.ndx >= MAX_PEAK_DIST
            break
        speed = (newPiv.indicator - piv.indicator) / (newPiv.ndx - piv.ndx)
        if speed < minSpeed
            minSpeed := speed
            if piv.price >= newPiv.price and piv.indicator < newPiv.indicator and (newPiv.ndx - piv.ndx >= MIN_PEAK_DIST) and piv.indicator > 0
                if isGreaterIndValue(piv.ndx, newPiv.ndx, newPiv.indicator) and isGreaterHigh(piv.ndx, newPiv.ndx, piv.price) and isNoCrossAbove(piv, newPiv)
                    drawNewDiv(piv, newPiv, false, true)
                    result := true
                    break
    result
//-----------------------------------------------------------------------------
//              Divergence Calcs
//------------------------------------------------------------------------------
//------------------------------------------------------------------------------{
type Point
    float   price
    int     ndx

var Point lastPh = na
var Point lastPl = na

ph = ta.pivothigh(high, PIV_LEN_LEFT, PIV_LEN_RIGHT)
pl = ta.pivotlow(low, PIV_LEN_LEFT, PIV_LEN_RIGHT)
phI = ta.pivothigh(avg, PIV_LEN_LEFT, PIV_LEN_RIGHT)
plI = ta.pivotlow(avg, PIV_LEN_LEFT, PIV_LEN_RIGHT)


if not na(ph)
    lastPh := Point.new(ph, bar_index - PIV_LEN_RIGHT)
if not na(pl)
    lastPl := Point.new(pl, bar_index - PIV_LEN_RIGHT)

if not na(phI) and barstate.isconfirmed and not na(lastPh)
    sig = phI
    sigNdx = bar_index - PIV_LEN_RIGHT
    if sigNdx - lastPh.ndx <= 2
        new = Pivot.new(lastPh.price, sigNdx, sig)
        if showDiv
            added = searchBearDiv(new)
            if added and alertBearDiv
                alert(getAlertMasg("Bear Divergence", avg), FREQ)
        if showHidDiv
            added = searchHidBearDiv(new)
            if added and alertBearHidDiv
                alert(getAlertMasg("Bear Hidden Divergence", avg), FREQ)
        addPivotHigh(new)

if not na(plI) and barstate.isconfirmed and not na(lastPl)
    sig = plI
    sigNdx = bar_index - PIV_LEN_RIGHT
    if sigNdx - lastPl.ndx <= 2
        new = Pivot.new(lastPl.price, sigNdx, sig)
        if showDiv
            added = searchBullDiv(new)
            if added and alertBullDiv
                alert(getAlertMasg("Bull Divergence", avg), FREQ)
        if showHidDiv
            added = searchHidBullDiv(new)
            if added and alertBullHidDiv
                alert(getAlertMasg("Bull Hidden Divergence", avg), FREQ)
        addPivotLow(new)

//------------------------------------------------------------------------------}

//-----------------------------------------------------------------------------
//              Take Profits
//------------------------------------------------------------------------------
//------------------------------------------------------------------------------{
const float UP_BORDER = 50
const float DN_BORDER = -50
var   Point lastIndPh = Point.new(0, 0)
var   Point lastIndPl = Point.new(0, 0)
var   int   lastSigBar = 0

indPh = ta.pivothigh(avg, 5, 5)
indPl = ta.pivotlow(avg, 5, 5)

if not na(indPh)
    lastIndPh.price := indPh
    lastIndPh.ndx := bar_index - 5
if not na(indPl)
    lastIndPl.price := indPl
    lastIndPl.ndx := bar_index - 5

speedH = (avg - lastIndPh.price) / (bar_index - lastIndPh.ndx)
speedL = (avg - lastIndPl.price) / (bar_index - lastIndPl.ndx)

sellSigRule = avg > UP_BORDER and avg > avg[2] and speedH < speedH[1]  and bar_index - lastSigBar >= 10
buySigRule  = avg < DN_BORDER and avg < avg[2] and speedL > speedL[1]  and bar_index - lastSigBar >= 10

if sellSigRule or buySigRule
    lastSigBar := bar_index


plotshape(sellSigRule and showTpSignal ? 120 : na, "Dn", style = shape.triangledown, color = rTpColor, location = location.absolute, size = size.tiny, display = display.pane)
plotshape(buySigRule and showTpSignal ? -120 : na, "Up", style = shape.triangleup,   color = gTpColor, location = location.absolute, size = size.tiny, display = display.pane)

if sellSigRule and alertBullTP
    alert(getAlertMasg("Bull TP", avg), FREQ)
if buySigRule and alertBearTP
    alert(getAlertMasg("Bear TP", avg), FREQ)

//------------------------------------------------------------------------------}
🛠 How to Apply the Matrix Oscillator in TradingView
- Open TradingView and log in.
- Navigate to the Pine Script Editor at the bottom of the screen.
- Copy and paste the provided script code.
- Click Save, then assign a suitable name (e.g., “Matrix Oscillator”).
- Click Add to Chart to visualize the indicator.
- Adjust input settings to match your trading style and asset preference.
💡 Additional Trading Tips
- Combine with Trend-Following Indicators:
Use moving averages (SMA, EMA) alongside the oscillator to confirm trend direction. - Avoid Overtrading in Low-Volatility Periods:
Focus on high-liquidity sessions for better signal accuracy. - Backtest Before Live Trading:
Test the indicator on historical data to understand its performance in different market conditions.
🎯 Final Thoughts
The Matrix Oscillator is an advanced tool that combines multiple momentum indicators into one, offering traders clear insights into market conditions, trend strength, and reversal opportunities. Whether you’re a day trader or a swing trader, this indicator can enhance your trading decisions with reliable signals.
However, always remember that no indicator guarantees success, and proper analysis combined with solid risk management is crucial to long-term profitability.
Gain an edge in the markets with the Matrix Oscillator – your all-in-one solution for smarter trading decisions! 🚀
RELATED POSTS
View all
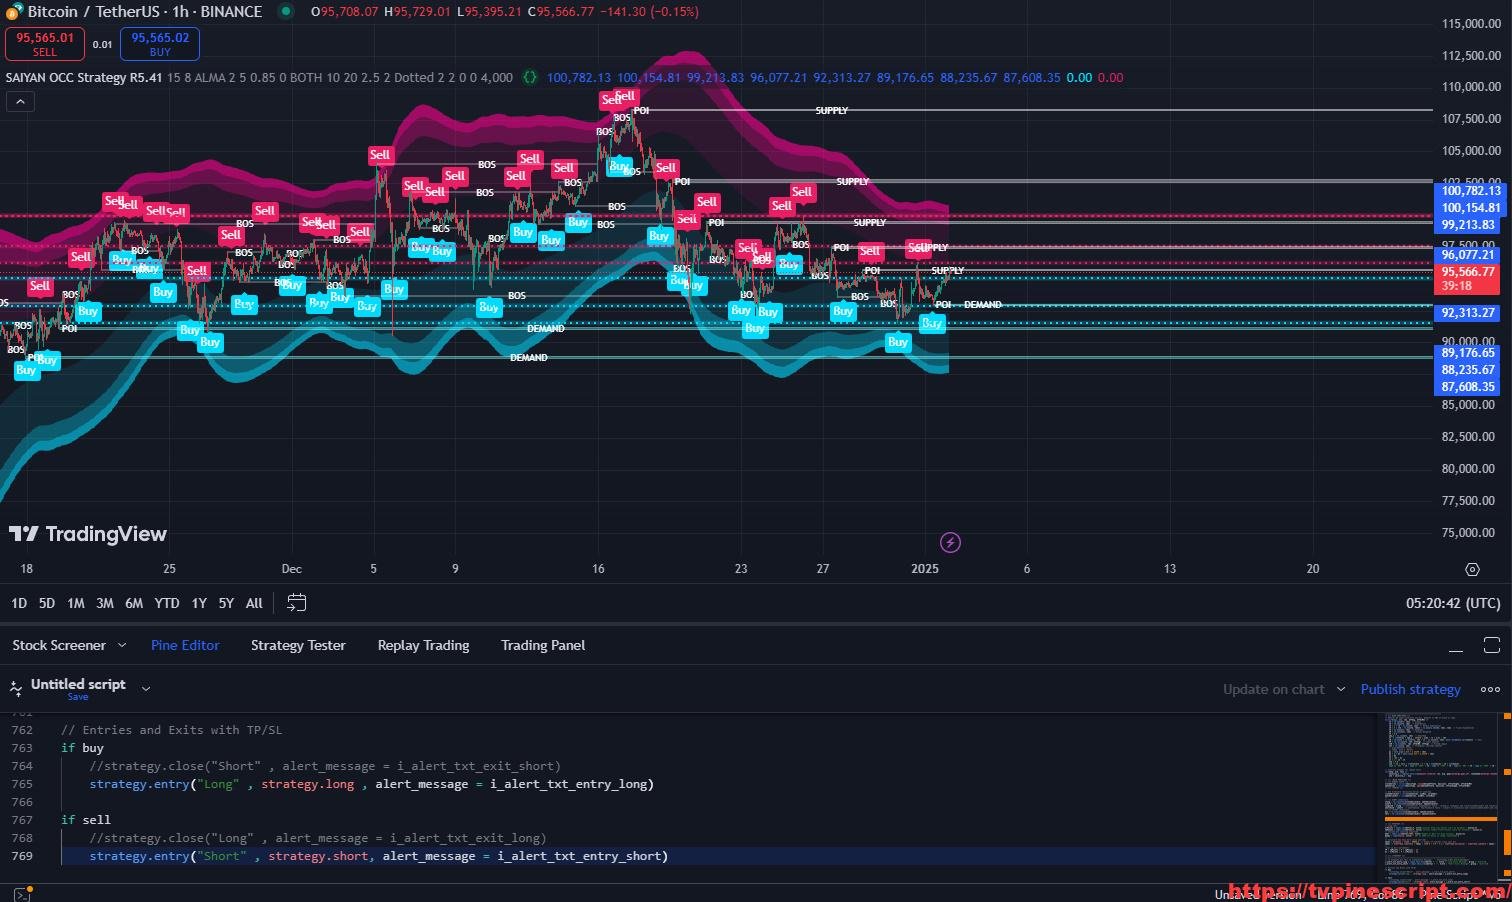
SAIYAN OCC Strategy R5.41: Advanced Supply/Demand Analysis and Trend Detection for Traders
January 3, 2025 | by admin
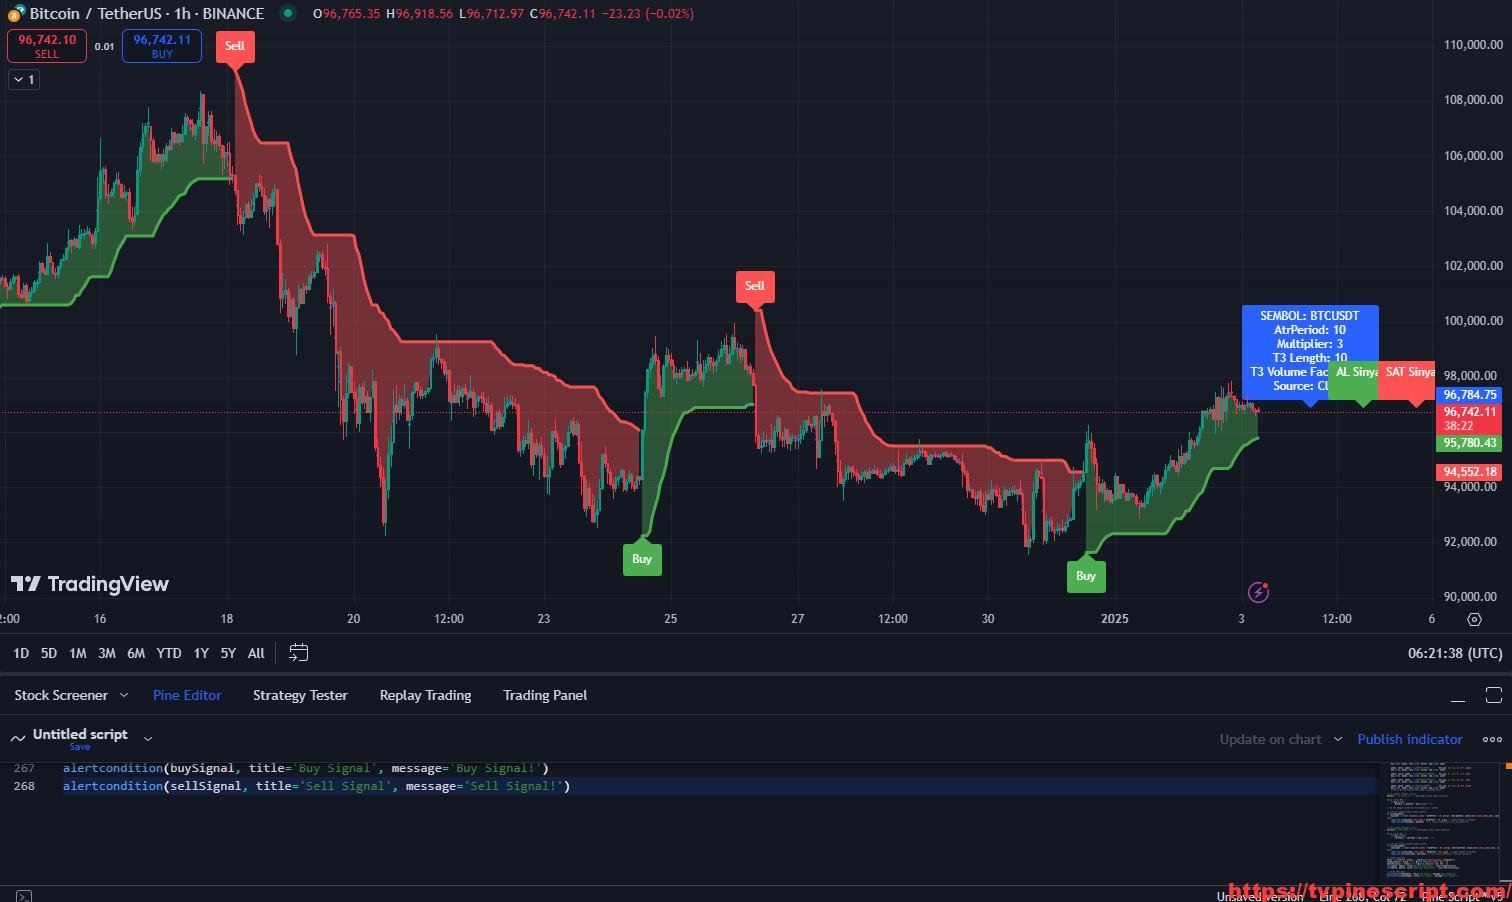
Super Mxx: Advanced Trend and Signal Detection with Kalman Filter and ATR Integration
January 3, 2025 | by admin
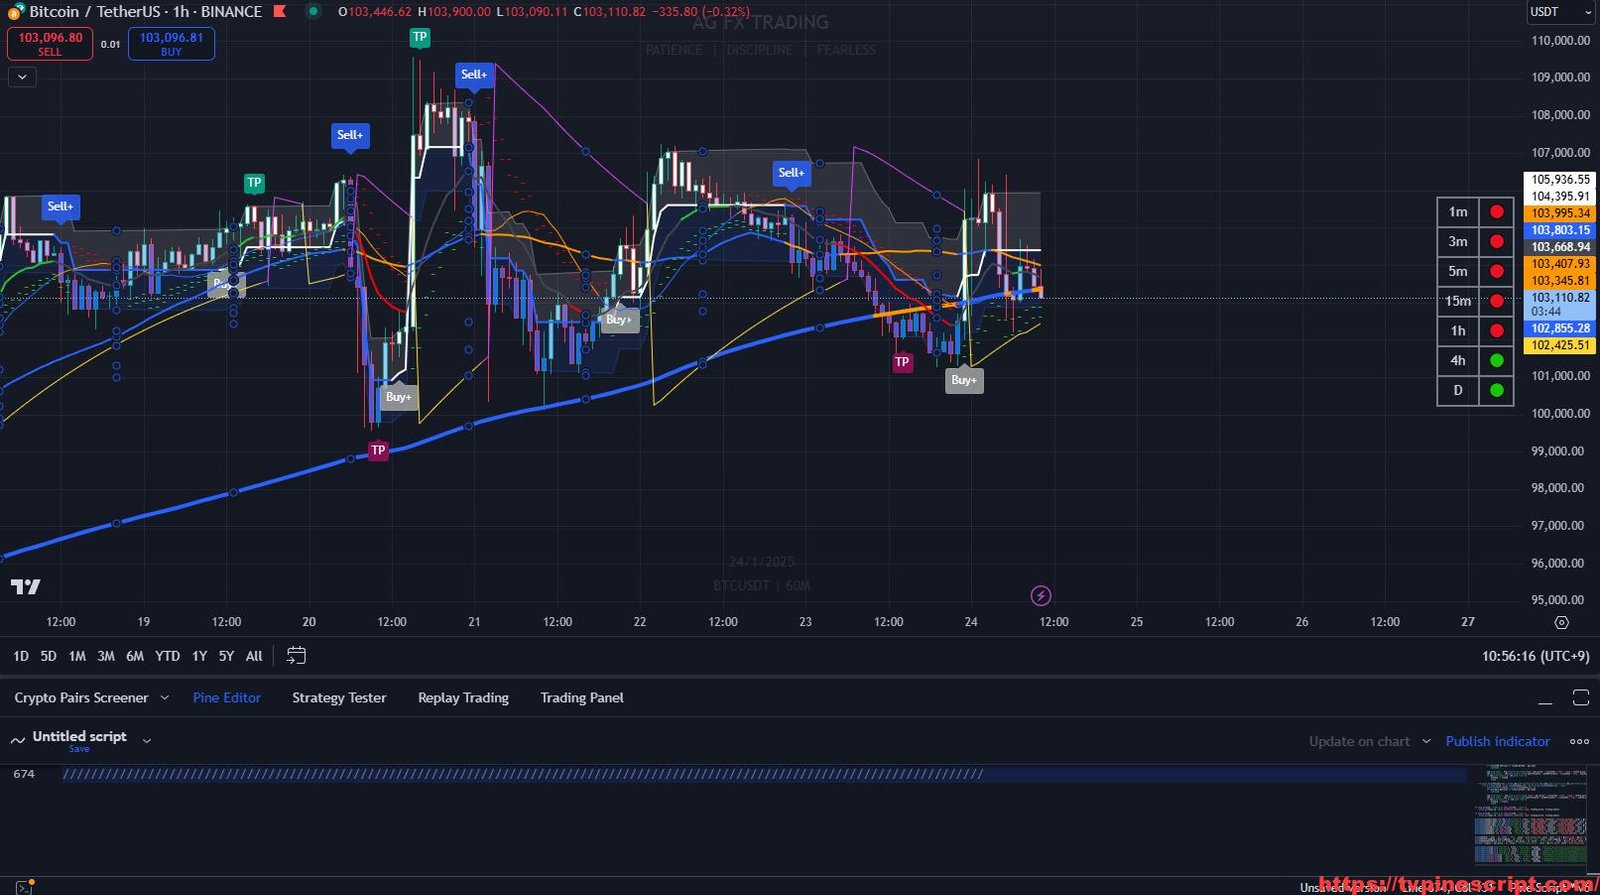
The REAL-GAINS Algo: A Comprehensive Range Filter Strategy for Precise Market Entries
January 24, 2025 | by admin