Nas Rivera Indicator: Multi-Tool Trading System with ATR-Based Risk Management
January 3, 2025 | by admin
Key Features of the Script:
- Customizable Supertrend:
- Combines Supertrend with Keltner Channels to track volatility and trend shifts.
- Integrates customizable sensitivity for precise signal adjustments.
- Dynamic Risk Management:
- Implements ATR-based stop-loss and take-profit levels.
- Supports configurable profit targets (1:1, 2:1, 3:1) and trailing stops.
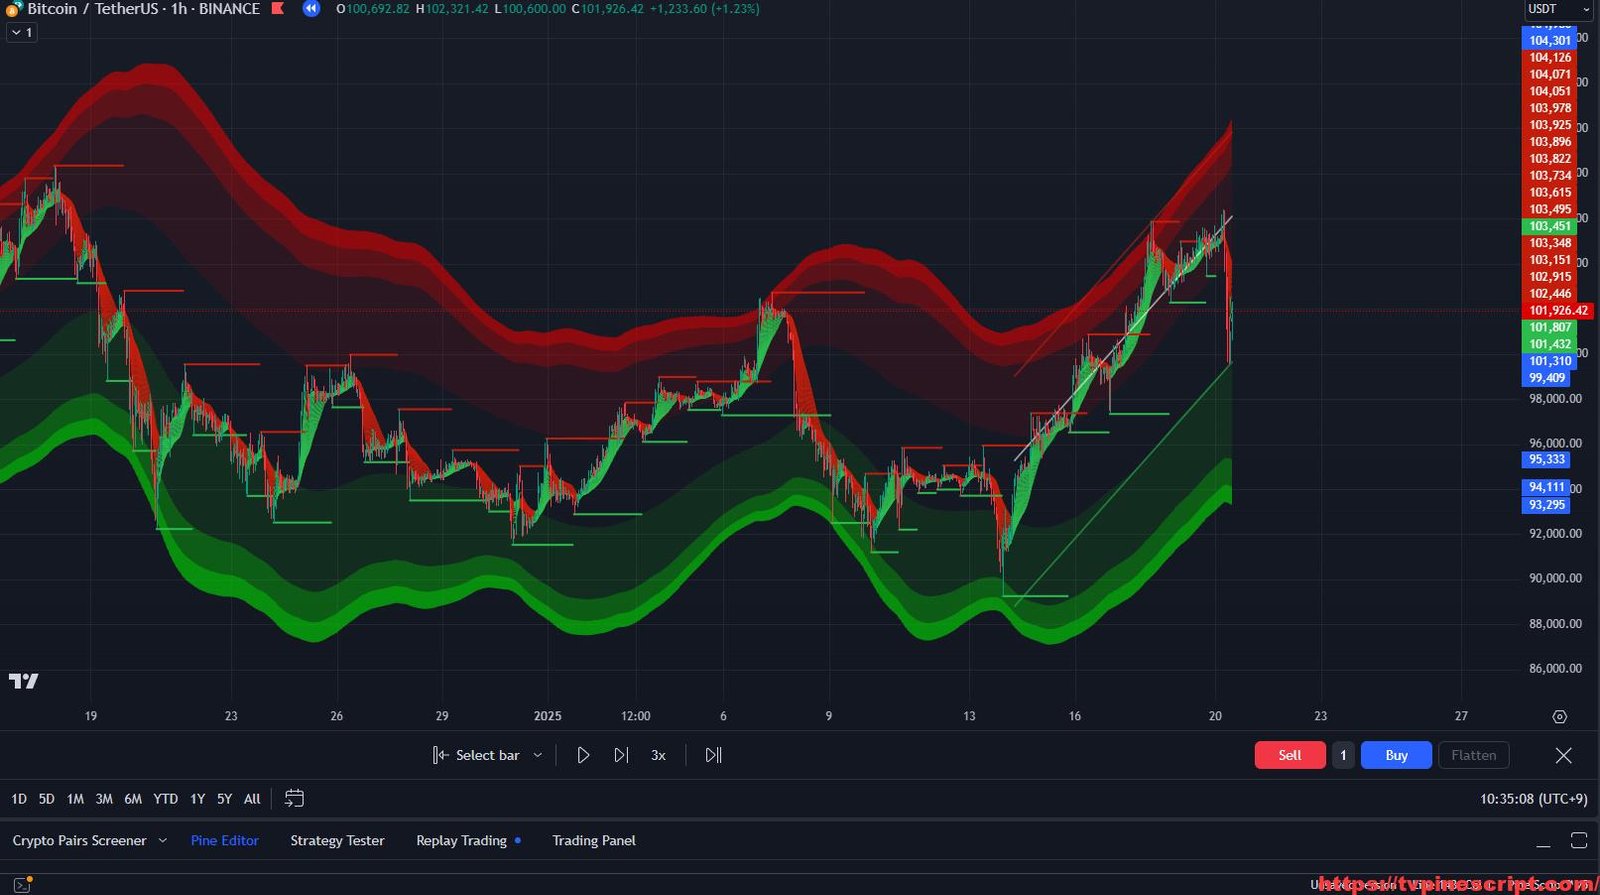
- EMA Ribbon for Trend Visualization:
- Includes a visual EMA ribbon for quick trend identification.
- Plots multiple EMA levels (e.g., 9, 12, 15) with color-coded signals.
- Reversal and Pullback Detection:
- Identifies pullbacks using trend-specific RSI levels.
- Alerts traders to exhaustion points with labeled take-profit and stop-loss markers.
- Trend Catcher and Braid Filter:
- Integrates crossover-based trend-catching logic for entry signals.
- Tracks price consistency across multiple moving averages using a braid filter.
- Multi-Timeframe Analysis:
- Adapts signals based on higher timeframe trends using supertrend and EMA crossovers.
- Offers dynamic switching between short-term and long-term trend detection.
- Real-Time Alerts:
- Configurable alerts for buy/sell signals, stop-loss breaches, and trend reversals.
- Detailed alerts for trend exhaustion at varying intensity levels.
Recommended Usage:
- Scalping:
- Ideal for 5-minute to 15-minute charts.
- Use braid filters and high-sensitivity Supertrend settings for rapid entries.
- Swing Trading:
- Effective on 1-hour to 4-hour charts.
- Combine Supertrend with multi-timeframe EMA analysis to confirm trade direction.
- Intraday Strategies:
- Leverage ATR stop-loss and take-profit levels for day trades.
- Track RSI and reversal labels for potential pullback opportunities.
- Risk and Position Management:
- Apply ATR-based levels to manage risk dynamically.
- Use take-profit markers to lock in incremental gains during extended trends.
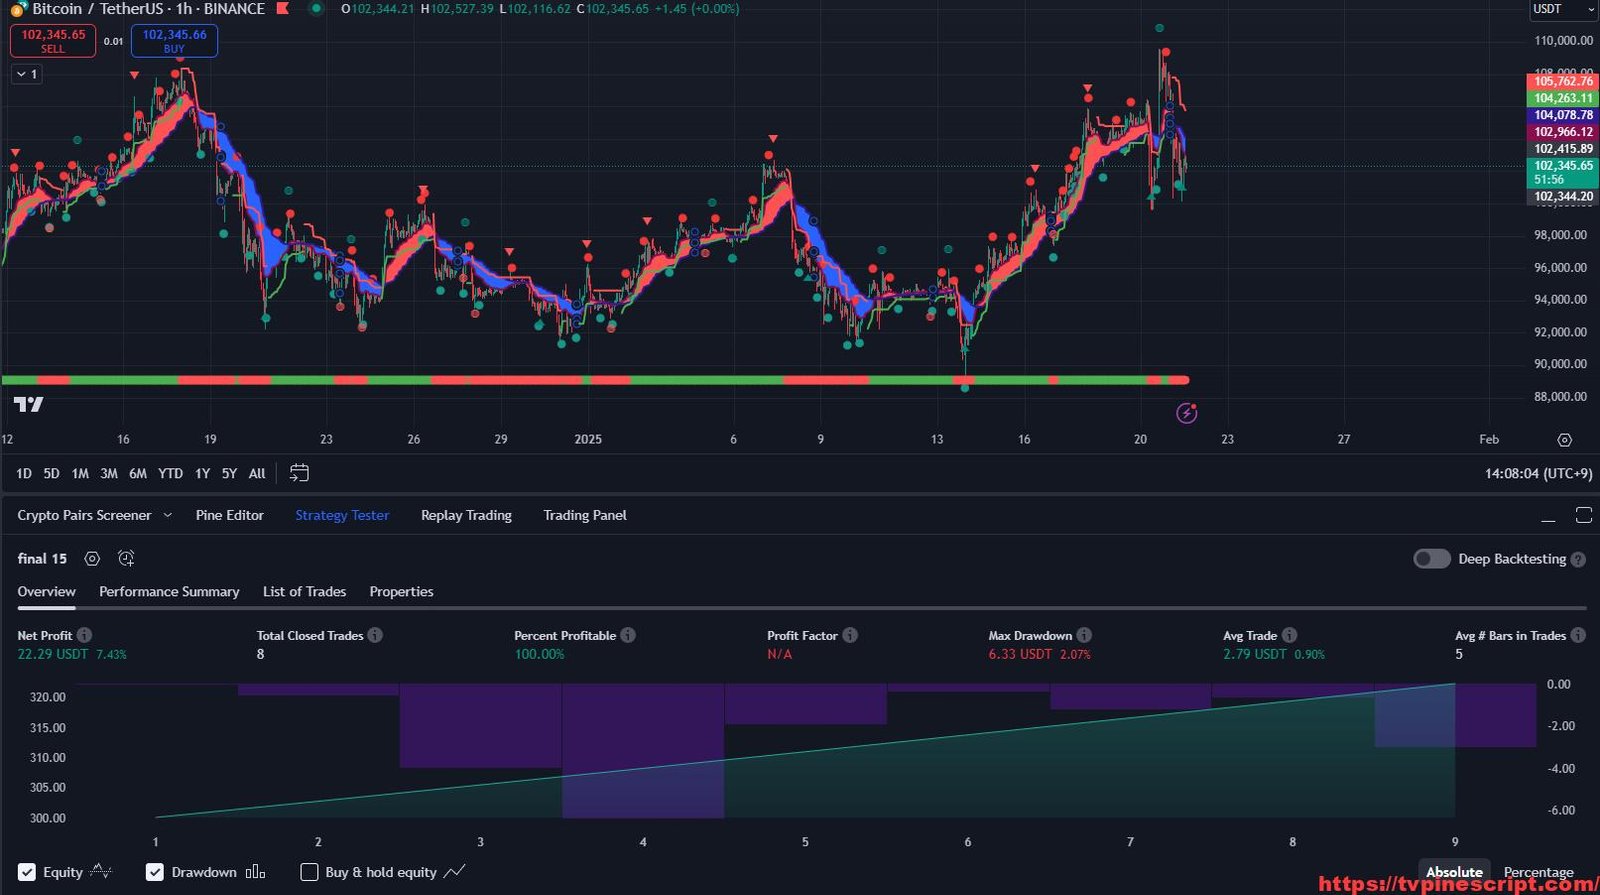
Script Evaluation:
- Functionality: 4.8/5
The script integrates multiple features, from trend analysis to advanced risk management, offering a versatile toolkit for traders. - Ease of Use: 4.2/5
Its detailed options may require a learning curve for beginners, but experienced traders will appreciate its flexibility. - Accuracy: 4.6/5
Reliable signals when combined with higher timeframe analysis and proper configurations. - Repainting Analysis:
This script does not repaint. Signals are based on confirmed bar data, ensuring consistency for both real-time trading and backtesting. - Optimal Timeframes:
- Scalping: 5-minute to 15-minute charts.
- Swing Trading: 1-hour to 4-hour charts.
- Author and Development Quality:
The author, Nas Rivera, demonstrates expertise in integrating technical indicators and risk management strategies. However, the script’s complexity could benefit from improved documentation and performance optimization for high-frequency use. - Overall Score: 4.6/5
A comprehensive trading tool for intermediate to advanced traders, offering a mix of trend-following, risk management, and multi-timeframe analysis.
//@version=5
indicator("Nas Rivera", overlay=true, precision=0, explicit_plot_zorder=true, max_labels_count=500)
// Get user input
sensitivity = input.float(4, "Sensitivity (0.5 - 10)", 0.5, 10, step=0.1)
emaEnergy = input.bool(false, title="Show EMA Ribbon")
enCloud = input.bool(true, 'Enable Trend Ribbon', group='Cloud')
ShowTEX = input.bool(true, "Show Take Profit Signals")
levels = input.bool(false, "Show TP/SL Levels", group = "Risk Management")
lvlLines = input.bool(false, "Show Lines", group = "Risk Management")
linesStyle = input.string("SOLID", "", ["SOLID", "DASHED", "DOTTED"], group = "Risk Management")
atrRisk = input.int(1, "Risk %", 1, group = "Risk Management")
atrLen = input.int(14, "ATR Length", 1, group = "Risk Management")
lvlDecimals = input.int(2, "Decimals", 1, 8, group = "Risk Management")
maType = input.string('McGinley', 'Filter', options=['EMA', 'DEMA', 'TEMA', 'WMA', 'VWMA', 'SMA', 'SMMA', 'HMA', 'LSMA', 'Kijun', 'McGinley', 'RMA'])
PipsMinSepPercent = input(60, 'Filter Strength')
// Colors
green = color.new(#2BBC4D, 0)
red = color.new(#C51D0B, 0)
green2 = color.new(#00DD00, 0)
red2 = color.new(#DD0000, 0)
bullcolorr = color.rgb(0, 255, 8)
bearcolorr = color.rgb(255, 0, 0)
// Keltner Channel function
keltner_channel(src, length) =>
ma = ta.sma(src, length)
rangec = high - low
upper = ma + rangec
lower = ma - rangec
[upper, lower]
// Supertrend function
supertrend(_src, factor, atrLen, kel_length) =>
[upperKeltner, lowerKeltner] = keltner_channel(_src, kel_length)
rangec = upperKeltner - lowerKeltner
upperBand = _src + factor * rangec
lowerBand = _src - factor * rangec
prevLowerBand = nz(lowerBand[1])
prevUpperBand = nz(upperBand[1])
lowerBand := lowerBand > prevLowerBand or close[1] < prevLowerBand ? lowerBand : prevLowerBand
upperBand := upperBand < prevUpperBand or close[1] > prevUpperBand ? upperBand : prevUpperBand
int direction = na
float superTrend = na
prevSuperTrend = superTrend[1]
if na(rangec[1])
direction := 1
else if prevSuperTrend == prevUpperBand
direction := close > upperBand ? -1 : 1
else
direction := close < lowerBand ? 1 : -1
superTrend := direction == -1 ? lowerBand : upperBand
[superTrend, direction]
[supertrend, direction] = supertrend(close, sensitivity, 11, 10)
bull = ta.crossover(close, supertrend)
bear = ta.crossunder(close, supertrend)
y1 = low - (ta.atr(30) * 2)
y2 = high + (ta.atr(30) * 2)
// Moving Average function
ma(type, src, len) =>
float result = 0
if type == 'SMA'
result := ta.sma(src, len)
else if type == 'EMA'
result := ta.ema(src, len)
else if type == 'DEMA'
e = ta.ema(src, len)
result := 2 * e - ta.ema(e, len)
else if type == 'TEMA'
e = ta.ema(src, len)
result := 3 * (e - ta.ema(e, len)) + ta.ema(ta.ema(e, len), len)
else if type == 'WMA'
result := ta.wma(src, len)
else if type == 'VWMA'
result := ta.vwma(src, len)
else if type == 'SMMA'
w = ta.wma(src, len)
sma_prev = ta.sma(src, len)
sma_value = na(w[1]) ? sma_prev : (w[1] * (len - 1) + src) / len
result := sma_value
else if type == 'RMA'
result := ta.rma(src, len)
else if type == 'HMA'
result := ta.wma(2 * ta.wma(src, len / 2) - ta.wma(src, len), math.round(math.sqrt(len)))
else if type == 'LSMA'
result := ta.linreg(src, len, 0)
else if type == 'Kijun'
kijun = math.avg(ta.lowest(len), ta.highest(len))
result := kijun
else if type == 'McGinley'
mg = 0.0
ema_value = ta.ema(src, len)
mg := na(mg[1]) ? ema_value : mg[1] + (src - mg[1]) / (len * math.pow(src / mg[1], 4))
result := mg
result
// Braid Filter
ma01 = ma(maType, close, 3)
ma02 = ma(maType, open, 7)
ma03 = ma(maType, close, 20)
max = math.max(math.max(ma01, ma02), ma03)
min = math.min(math.min(ma01, ma02), ma03)
dif = max - min
filter = ta.atr(14) * PipsMinSepPercent / 100
BraidColor = ma01 > ma02 and dif > filter ? color.green : ma02 > ma01 and dif > filter ? color.red : color.gray
// EMAs
ema1 = ta.ema(high, 9)
ema2 = ta.ema(high, 12)
ema3 = ta.ema(high, 15)
ema4 = ta.ema(high, 18)
ema5 = ta.ema(high, 21)
ema6 = ta.ema(high, 24)
ema7 = ta.ema(high, 27)
ema8 = ta.ema(high, 30)
ema9 = ta.ema(high, 33)
ema10 = ta.ema(high, 36)
ema11 = ta.ema(high, 39)
ema12 = ta.ema(high, 42)
ema13 = ta.ema(high, 45)
ema14 = ta.ema(high, 48)
ema15 = ta.ema(high, 51)
emaEnergyColor(ma) =>
emaEnergy ? (close >= ma ? green : red) : color.new(na, 0)
plot(emaEnergy ? ema3 : na, "", emaEnergyColor(ema3), editable=false)
plot(emaEnergy ? ema4 : na, "", emaEnergyColor(ema4), editable=false)
plot(emaEnergy ? ema5 : na, "", emaEnergyColor(ema5), editable=false)
plot(emaEnergy ? ema6 : na, "", emaEnergyColor(ema6), editable=false)
plot(emaEnergy ? ema7 : na, "", emaEnergyColor(ema7), editable=false)
plot(emaEnergy ? ema8 : na, "", emaEnergyColor(ema8), editable=false)
plot(emaEnergy ? ema9 : na, "", emaEnergyColor(ema9), editable=false)
plot(emaEnergy ? ema10 : na, "", emaEnergyColor(ema10), editable=false)
plot(emaEnergy ? ema11 : na, "", emaEnergyColor(ema11), editable=false)
plot(emaEnergy ? ema12 : na, "", emaEnergyColor(ema12), editable=false)
plot(emaEnergy ? ema13 : na, "", emaEnergyColor(ema13), editable=false)
plot(emaEnergy ? ema14 : na, "", emaEnergyColor(ema14), editable=false)
plot(emaEnergy ? ema15 : na, "", emaEnergyColor(ema15), editable=false)
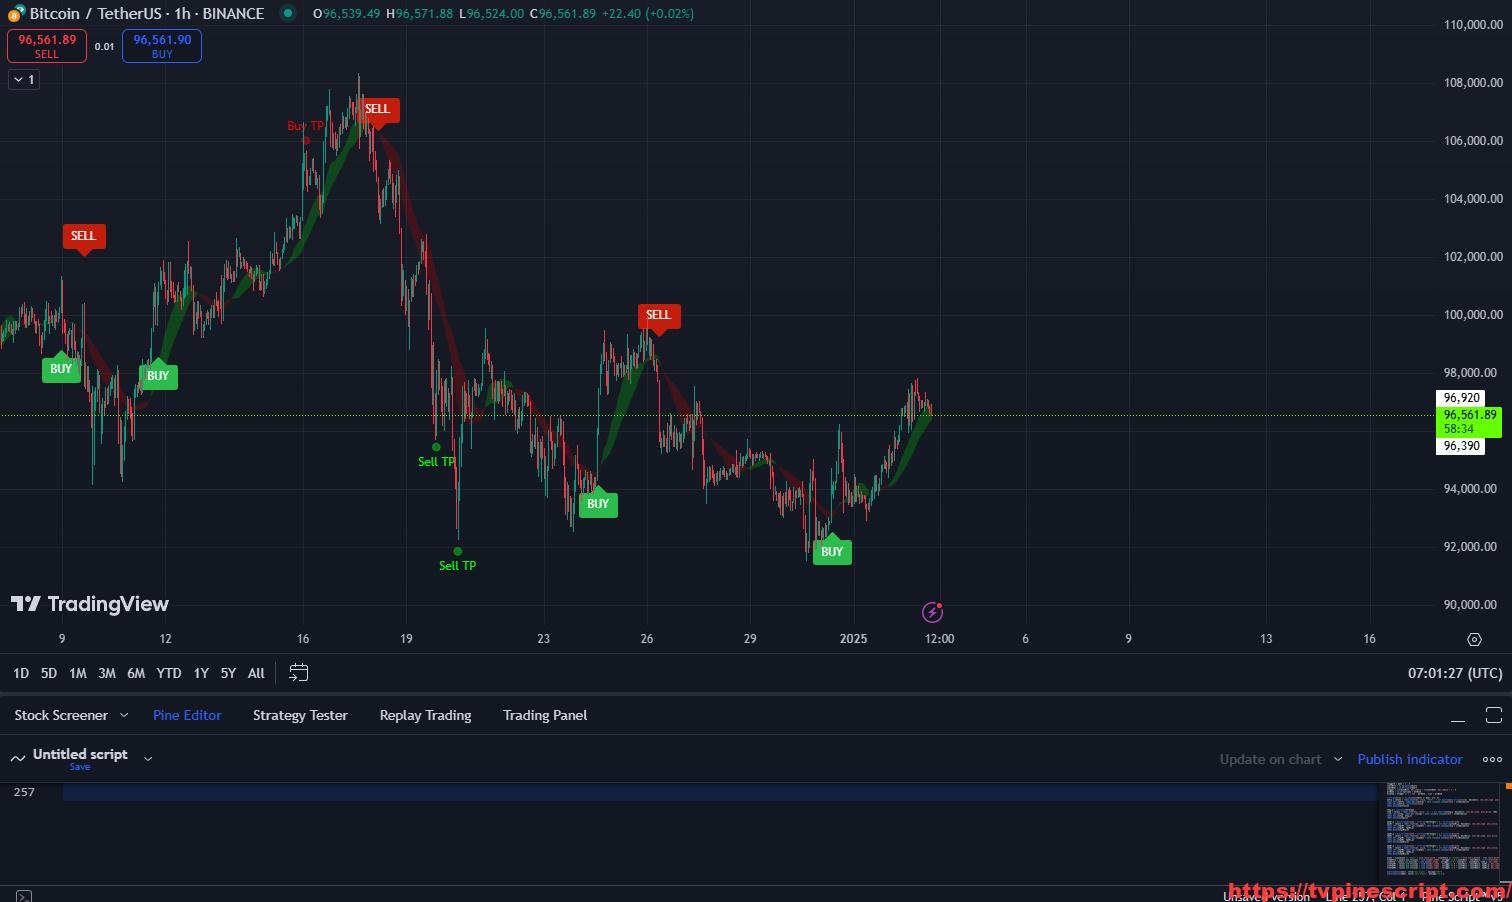
// Buy and Sell signals
buy = (bull and ma01 > ma02 and dif > filter)
sell = (bear and ma02 > ma01 and dif > filter)
if (buy)
label.new(bar_index, y1, "BUY", xloc.bar_index, yloc.price, green, label.style_label_up, color.white, size.normal)
if (sell)
label.new(bar_index, y2, "SELL", xloc.bar_index, yloc.price, red, label.style_label_down, color.white, size.normal)
// Alert conditions
alertcondition(buy or sell, title="BUY or SELL Signal", message="BUY or SELL Signal Triggered")
// Additional plots from NAS Ultimate Algo
sma4 = ta.sma(close, 8)
sma5 = ta.sma(close, 9)
sma9 = ta.sma(close, 13)
candle = ta.sma(close, 21)
reach = ta.sma(close, 34)
candlep = plot(enCloud ? candle : na, color=color.new(color.white, 100))
reachp = plot(enCloud ? reach : na, color=color.new(color.white, 100))
fill(reachp, candlep, color= candle > reach ? color.new(#00CC00, 75) : color.new(#CC0000, 75))
// Trend Catcher Indicator
ema100 = ta.ema(close, 10)
ema200 = ta.ema(close, 20)
crossover_condition = ta.crossover(ema100, ema200)
crossunder_condition = ta.crossunder(ema100, ema200)
trendCatcher = crossover_condition ? 1 : crossunder_condition ? -1 : 0
trendColor = trendCatcher == 1 ? color.rgb(90, 23, 102) : na
barcolor(trendColor)
barcolor(color = close > supertrend ? color.rgb(102, 255, 0) : color.rgb(255, 0, 0))
// Take Profit Signals
rsiLengthInput = 22
rsiSourceInput = close
maTypeInput = ta.sma(close, 14)
up66 = ta.rma(math.max(ta.change(rsiSourceInput), 0), rsiLengthInput)
downw = ta.rma(-math.min(ta.change(rsiSourceInput), 0), rsiLengthInput)
rsi66 = downw == 0 ? 100 : up66 == 0 ? 0 : 100 - (100 / (1 + up66 / downw))
rsiMA = maTypeInput
long1 = ta.crossover(rsi66, 30)
long2 = ta.crossover(rsi66, 20)
long3 = ta.crossover(rsi66, 15)
short1 = ta.crossunder(rsi66, 70)
short2 = ta.crossunder(rsi66, 80)
short3 = ta.crossunder(rsi66, 85)
plotshape(long1 and ShowTEX, "GO LONG 1", style=shape.circle, location=location.belowbar, size=size.tiny, color=color.new(bullcolorr, 60), text="Sell TP", textcolor=bullcolorr, editable=false)
plotshape(long2 and ShowTEX, "GO LONG 2", style=shape.circle, location=location.belowbar, size=size.tiny, color=color.new(bullcolorr, 50), text="Sell TP", textcolor=bullcolorr, editable=false)
plotshape(long3 and ShowTEX, "GO LONG 3", style=shape.circle, location=location.belowbar, size=size.tiny, color=color.new(bullcolorr, 10), text="Sell TP", textcolor=bullcolorr, editable=false)
plotshape(short1 and ShowTEX, "GO SHORT 1", style=shape.circle, location=location.abovebar, size=size.tiny, color=color.new(bearcolorr, 60), text="Buy TP", textcolor=bearcolorr, editable=false)
plotshape(short2 and ShowTEX, "GO SHORT 2", style=shape.circle, location=location.abovebar, size=size.tiny, color=color.new(bearcolorr, 50), text="Buy TP", textcolor=bearcolorr, editable=false)
plotshape(short3 and ShowTEX, "GO SHORT 3", style=shape.circle, location=location.abovebar, size=size.tiny, color=color.new(bearcolorr, 10), text="Buy TP", textcolor=bearcolorr, editable=false)
alertcondition(long1 or short1, 'Trend Exhausted - 1', 'Trend Exhausted | Strength - 1')
alertcondition(long2 or short2, 'Trend Exhausted - 2', 'Trend Exhausted | Strength - 2')
alertcondition(long3 or short3, 'Trend Exhausted - 3', 'Trend Exhausted | Strength - 3')
// High Lows
y1B = low - ta.atr(30)
y2B = high + ta.atr(30)
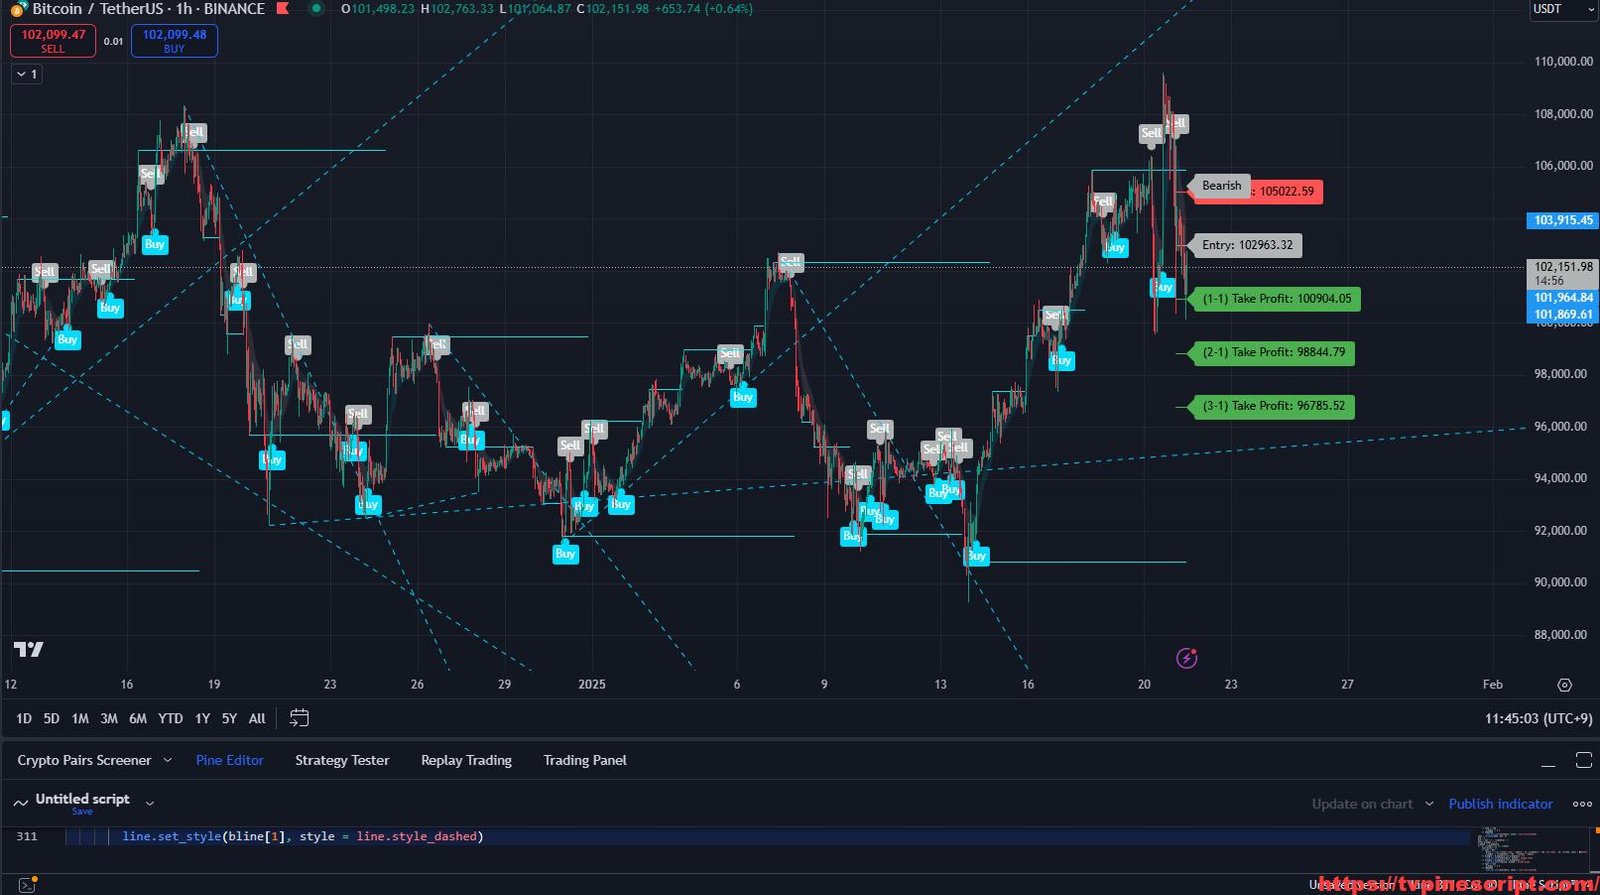
// Stop loss and take profit levels
decimals = lvlDecimals == 1 ? "#.#" : lvlDecimals == 2 ? "#.##" : lvlDecimals == 3 ? "#.###" : lvlDecimals == 4 ? "#.####" : lvlDecimals == 5 ? "#.#####" : lvlDecimals == 6 ? "#.######" : lvlDecimals == 7 ? "#.#######" : "#.########"
trigger2 = bull ? 1 : 0
countBull = ta.barssince(bull)
countBear = ta.barssince(bear)
trigger = nz(countBull, bar_index) < nz(countBear, bar_index) ? 1 : 0
atrBand = ta.atr(atrLen) * atrRisk
atrStop = trigger == 1 ? low - atrBand : high + atrBand
lastTrade(src) => ta.valuewhen(bull or bear, src, 0)
entry = levels ? label.new(time, close, "ENTRY " + str.tostring(lastTrade(close), decimals), xloc.bar_time, yloc.price, color.rgb(0, 255, 251), label.style_label_left, color.white, size.normal) : na
label.set_x(entry, label.get_x(entry) + math.round(ta.change(time) * lvlDecimals))
label.set_y(entry, lastTrade(close))
label.delete(entry[1])
stop_y = lastTrade(atrStop)
stop = levels ? label.new(time, close, "SL " + str.tostring(stop_y, decimals), xloc.bar_time, yloc.price, red2, label.style_label_left, color.white, size.normal) : na
label.set_x(stop, label.get_x(stop) + math.round(ta.change(time) * lvlDecimals))
label.set_y(stop, stop_y)
label.delete(stop[1])
tp1Rl_y = (lastTrade(close) - lastTrade(atrStop)) * 1 + lastTrade(close)
tp1Rl = levels ? label.new(time, close, "1:1 TP " + str.tostring(tp1Rl_y, decimals), xloc.bar_time, yloc.price, green2, label.style_label_left, color.white, size.normal) : na
label.set_x(tp1Rl, label.get_x(tp1Rl) + math.round(ta.change(time) * lvlDecimals))
label.set_y(tp1Rl, tp1Rl_y)
label.delete(tp1Rl[1])
tp2RL_y = (lastTrade(close) - lastTrade(atrStop)) * 2 + lastTrade(close)
tp2RL = levels ? label.new(time, close, "2:1 TP " + str.tostring(tp2RL_y, decimals), xloc.bar_time, yloc.price, green2, label.style_label_left, color.white, size.normal) : na
label.set_x(tp2RL, label.get_x(tp2RL) + math.round(ta.change(time) * lvlDecimals))
label.set_y(tp2RL, tp2RL_y)
label.delete(tp2RL[1])
tp3RL_y = (lastTrade(close) - lastTrade(atrStop)) * 3 + lastTrade(close)
tp3RL = levels ? label.new(time, close, "3:1 TP " + str.tostring(tp3RL_y, decimals), xloc.bar_time, yloc.price, green2, label.style_label_left, color.white, size.normal) : na
label.set_x(tp3RL, label.get_x(tp3RL) + math.round(ta.change(time) * lvlDecimals))
label.set_y(tp3RL, tp3RL_y)
label.delete(tp3RL[1])
style = linesStyle == "SOLID" ? line.style_solid : linesStyle == "DASHED" ? line.style_dashed : line.style_dotted
lineEntry = levels and lvlLines ? line.new(bar_index - (trigger == 0 ? countBull : countBear), lastTrade(close), bar_index + lvlDecimals, lastTrade(close), xloc.bar_index, extend.none, color.rgb(0, 255, 251), style, 2) : na, line.delete(lineEntry[1])
lineStop = levels and lvlLines ? line.new(bar_index - (trigger == 0 ? countBull : countBear), stop_y, bar_index + lvlDecimals, stop_y, xloc.bar_index, extend.none, red2, style, 2) : na, line.delete(lineStop[1])
lineTp1Rl = levels and lvlLines ? line.new(bar_index - (trigger == 0 ? countBull : countBear), tp1Rl_y, bar_index + lvlDecimals, tp1Rl_y, xloc.bar_index, extend.none, green2, style, 2) : na, line.delete(lineTp1Rl[1])
lineTp2RL = levels and lvlLines ? line.new(bar_index - (trigger == 0 ? countBull : countBear), tp2RL_y, bar_index + lvlDecimals, tp2RL_y, xloc.bar_index, extend.none, green2, style, 2) : na, line.delete(lineTp2RL[1])
lineTp3RL = levels and lvlLines ? line.new(bar_index - (trigger == 0 ? countBull : countBear), tp3RL_y, bar_index + lvlDecimals, tp3RL_y, xloc.bar_index, extend.none, green2, style, 2) : na, line.delete(lineTp3RL[1])
alertcondition(bull, title='Buy Signal', message="BUY")
alertcondition(bear, title='Sell Signal', message="SELL")
How to Apply Pine Script in TradingView:
- Open TradingView and log in.
- Navigate to the Pine Script Editor at the bottom of the screen.
- Copy the provided Pine Script code.
- Paste it into the editor and click Save.
- Name the script, e.g., “Nas Rivera Trading System.”
- Click Add to Chart to apply the script.
- Customize the settings via the indicator panel to suit your trading strategy.
Final Verdict:
The Nas Rivera Indicator is a powerful script combining advanced trend-following, ATR-based risk management, and multi-timeframe analysis. Its non-repainting nature ensures reliable outputs, making it ideal for scalping, swing trading, and intraday strategies. While its complexity may challenge beginners, experienced users will find it a valuable addition to their trading arsenal.
RELATED POSTS
View all
Asset Bender Algo Indicator: A Comprehensive Trading Tool for Trend and Risk Management
January 21, 2025 | by admin
RoyalPrince Indicator Pt.2: Comprehensive Market Trend and Support/Resistance Tool
January 21, 2025 | by admin
Final 15 Strategy: A Comprehensive Trading System Combining Adaptive Indicators
January 21, 2025 | by admin