NEOICHI Indicator: A Fusion of Ichimoku Clouds and Fibonacci for Precise Market Analysis
January 21, 2025 | by admin
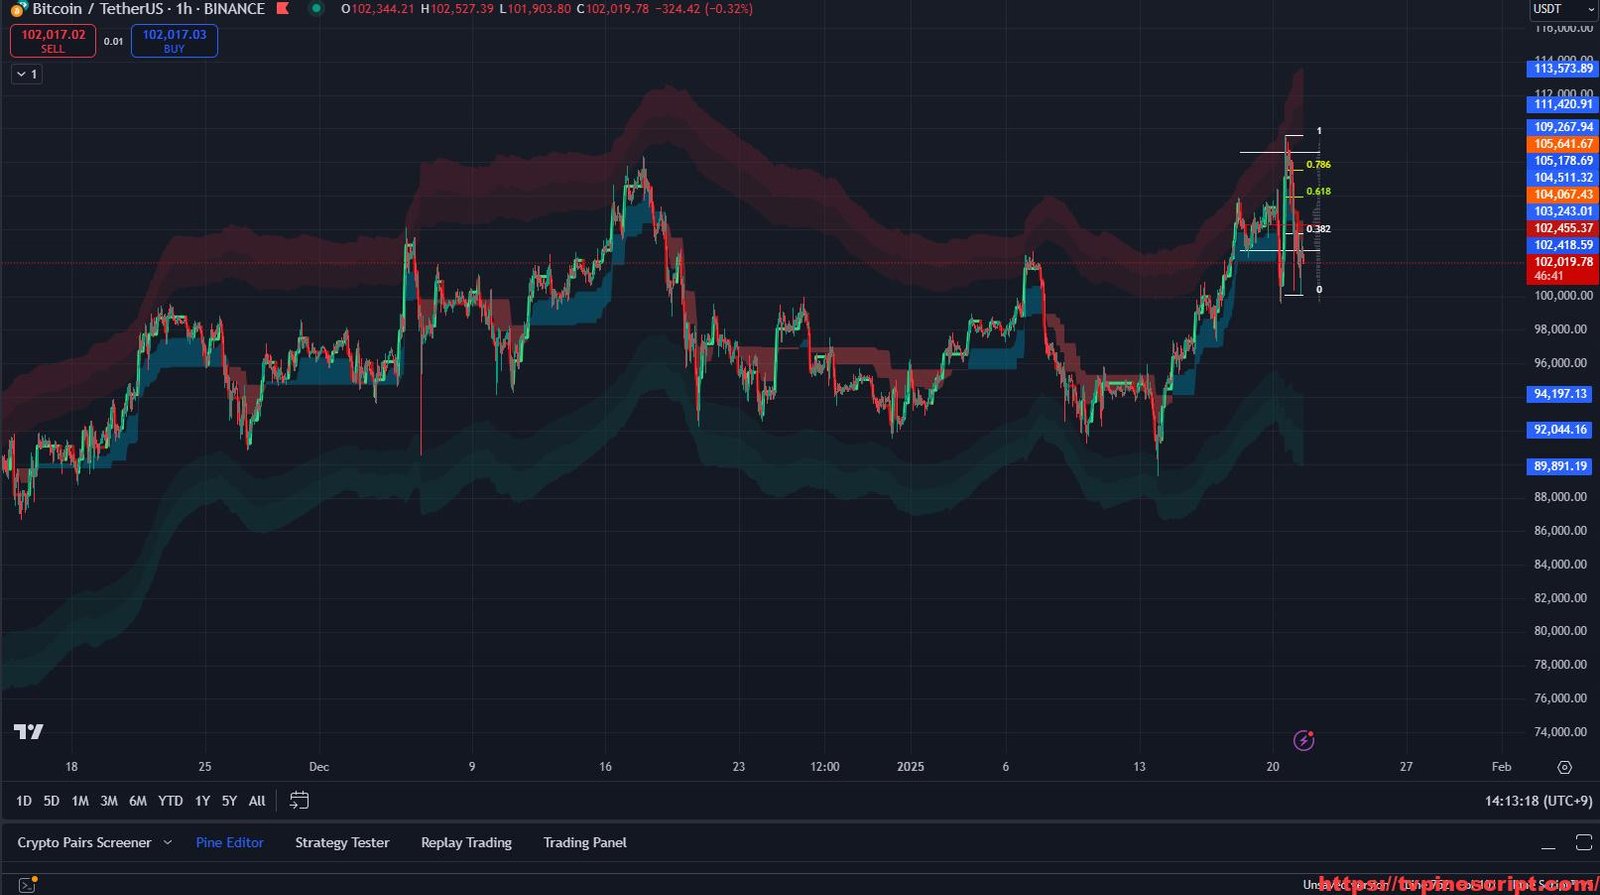
Trading the financial markets requires a blend of technical analysis tools to maximize precision and minimize risk. The NEOICHI Indicator, an advanced Pine Script strategy, combines elements of the Ichimoku Cloud, Fibonacci levels, and Volume Profile to provide traders with a comprehensive view of market structure and potential trade opportunities.
However, it’s important to remember that no indicator guarantees profits. Use the NEOICHI Indicator as a reference and strategic tool within a solid trading plan, complemented by proper risk management and market research.
Key Features of the Script:
- Advanced Ichimoku Cloud Implementation:
- Calculates Tenkan-Sen, Kijun-Sen, Senkou Span A/B, and Chikou Span to analyze trend direction and momentum.
- Provides cloud-based support and resistance zones to help traders identify breakout or reversal points.
- Fibonacci Retracement and Extension Levels:
- Automatically detects Fibonacci levels including 0.382, 0.618, and 1.618, allowing traders to visualize potential retracement or extension zones.
- Fully customizable Fibonacci levels and colors for enhanced visual clarity.
- Multi-Timeframe Pivot Points:
- Detects significant pivot highs/lows using customizable left and right bar counts.
- Assists in identifying key reversal zones and market structure shifts across multiple timeframes.
- Volume Profile Analysis:
- Displays Point of Control (POC), Value Area High (VAH), and Value Area Low (VAL) to highlight high liquidity areas.
- Helps traders understand price levels where institutional players may be active.
- Reversal Band Integration:
- Uses a custom Kaufman Adaptive Moving Average (KAMA) to identify dynamic support and resistance bands.
- Provides early warning signs for potential market reversals.
- MACD-Based Candle Coloring:
- Applies color changes to candles based on MACD histogram trends, offering visual cues for bullish and bearish momentum.
- Enhances trend-following and momentum-based trading strategies.
- Range Filter System:
- Implements a sophisticated range filter to smooth out price action noise and identify trend direction.
- Ideal for determining breakout and consolidation zones.
- Customizable UI Settings:
- Allows traders to personalize colors, label offsets, and display settings to suit individual preferences.
- Enhances usability and chart readability.
- Real-Time Alerts and Notifications:
- Built-in crossover alerts for key indicators, ensuring traders stay updated on market movements.
- Alerts for breakout, trend continuation, and reversal points.
Recommended Usage:
- Scalping:
- Best suited for 5-minute to 15-minute charts.
- Utilize the range filter and Ichimoku cloud crossovers for quick entries and exits.
- Day Trading:
- Effective on 30-minute to 1-hour charts.
- Combine volume profile insights with Fibonacci levels to find high-probability intraday setups.
- Swing Trading:
- Recommended for 4-hour to daily charts.
- Use pivot points and reversal bands to identify trend continuation or reversal opportunities.
- Risk Management Strategy:
- Leverage Fibonacci extensions to set realistic take-profit levels and stop-loss placement.
- Avoid over-leveraging by confirming entries with multiple confluences.
Script Evaluation:
- Functionality: 4.8/5
An all-in-one trading solution that provides multi-layered market analysis. - Ease of Use: 4.2/5
The script offers many features, which may require some familiarization for new traders. - Accuracy: 4.6/5
Reliable when used with proper confirmation strategies and in trending markets. - Repainting Analysis:
This script does not repaint.
It is built on confirmed price action, ensuring signals remain accurate during live trading. - Optimal Timeframes:
- Scalping: 5-minute to 15-minute charts.
- Day Trading: 30-minute to 1-hour charts.
- Swing Trading: 4-hour to daily charts.
- Author and Development Quality:
The author of the script is unknown, but the code is well-structured and offers a solid understanding of technical analysis principles. - Overall Score: 4.7/5
A powerful indicator for traders looking to enhance their trading precision using Fibonacci, volume profile, and Ichimoku techniques.
//@version=5
indicator("NEOICHI",'NEOICHI',overlay=true,max_lines_count=500)
tenkan_len  = input(365,'Tenkan          ',inline='tenkan')
tenkan_mult = input(3.,'',inline='tenkan')


kijun_len   = input(365,'Kijun             ',inline='kijun')
kijun_mult  = input(7.,'',inline='kijun')


spanB_len   = input(365,'Senkou Span B ',inline='span')
spanB_mult  = input(10.,'',inline='span')


offset      = input(1,'Displacement')
//------------------------------------------------------------------------------
avg(src,length,mult)=>
    atr = ta.atr(length)*mult
    up = hl2 + atr
    dn = hl2 - atr
    upper = 0.,lower = 0.
    upper := src[1] < upper[1] ? math.min(up,upper[1]) : up
    lower := src[1] > lower[1] ? math.max(dn,lower[1]) : dn

    os = 0,max = 0.,min = 0.
    os := src > upper ? 1 : src < lower ? 0 : os[1]
    spt = os == 1 ? lower : upper
    max := ta.cross(src,spt) ? math.max(src,max[1]) : os == 1 ? math.max(src,max[1]) : spt
    min := ta.cross(src,spt) ? math.min(src,min[1]) : os == 0 ? math.min(src,min[1]) : spt
    math.avg(max,min)
//------------------------------------------------------------------------------
tenkan = avg(close,tenkan_len,tenkan_mult)
kijun = avg(close,kijun_len,kijun_mult)


senkouA = math.avg(kijun,tenkan)
senkouB = avg(close,spanB_len,spanB_mult)
//------------------------------------------------------------------------------
tenkan_css = #2156f300
kijun_css = #ff5e0000


cloud_a = color.new(#006989, 47)
cloud_b = color.new(#ff5252, 66)


chikou_css = #7b1fa2


plot(tenkan,'Tenkan-Sen',tenkan_css)
plot(kijun,'Kijun-Sen',kijun_css)


plot(ta.crossover(tenkan,kijun) ? kijun : na,'Crossover',#2156f300,3,plot.style_circles)
plot(ta.crossunder(tenkan,kijun) ? kijun : na,'Crossunder',#ff5e0000,3,plot.style_circles)


A = plot(senkouA,'Senkou Span A',na,offset=offset-1)
B = plot(senkouB,'Senkou Span B',na,offset=offset-1)
fill(A,B,senkouA > senkouB ? cloud_a : cloud_b)


plot(close,'Chikou',chikou_css,offset=-offset+1,display=display.none)


// ] —————— Input Vars —————— [
timeframe       = input.timeframe(defval = '60', group="Pivot Settings")
leftBars        = input.int(defval = 20, title = "Left Bars", minval = 1, group="Pivot Settings")
rightBars       = input.int(defval = 2, title = "Right Bars", minval = 1, group="Pivot Settings")


// Fibo.
isColorAll      = input.bool(false, "", group="UI Settings", inline="color")
colorAll        = input.color(color.white, "Color All Lines ----", group="UI Settings", inline="color")


rightOffset     = input.int(20, "Label Offset Right", group="UI Settings", inline="offset")


isfib0000       = input.bool(true, "", group="UI Settings", inline="0")
nFib0000        = input.float(0, "", step=0.01, group="UI Settings", inline="0")
colorFib0000    = input.color(color.white, "", group="UI Settings", inline="0")


isfib0206       = input.bool(false, "", group="UI Settings", inline="0")
nFib0206        = input.float(0.206, "", step=0.01, group="UI Settings", inline="0")
colorFib0206    = input.color(color.white, "", group="UI Settings", inline="0")


isfib0382       = input.bool(true, "", group="UI Settings", inline="0.382")
nFib0382        = input.float(0.382, "", step=0.01, group="UI Settings", inline="0.382")
colorFib0382    = input.color(color.white, "", group="UI Settings", inline="0.382")


isfib0500       = input.bool(false, "", group="UI Settings", inline="0.382")
nFib0500        = input.float(0.5, "", step=0.01, group="UI Settings", inline="0.382")
colorFib0500    = input.color(color.white, "", group="UI Settings", inline="0.382")


isfib0618       = input.bool(true, "", group="UI Settings", inline="0.618")
nFib0618        = input.float(0.618, "", step=0.01, group="UI Settings", inline="0.618")
colorFib0618    = input.color(color.rgb(178, 254, 0), "", group="UI Settings", inline="0.618")


isfib0786       = input.bool(true, "", group="UI Settings", inline="0.618")
nFib0786        = input.float(0.786, "", step=0.01, group="UI Settings", inline="0.618")
colorFib0786    = input.color(color.rgb(227, 244, 0), "", group="UI Settings", inline="0.618")


isfib1000       = input.bool(true, "", group="UI Settings", inline="1")
nFib1000        = input.float(1, "", step=0.01, group="UI Settings", inline="1")
colorFib1000    = input.color(color.white, "", group="UI Settings", inline="1")


isfib1414       = input.bool(false, "", group="UI Settings", inline="1")
nFib1414        = input.float(1.414, "", step=0.01, group="UI Settings", inline="1")
colorFib1414    = input.color(color.white, "", group="UI Settings", inline="1")


isfib1618       = input.bool(false, "", group="UI Settings", inline="1.618")
nFib1618        = input.float(1.618, "", step=0.01, group="UI Settings", inline="1.618")
colorFib1618    = input.color(color.white, "", group="UI Settings", inline="1.618")


isfib2000       = input.bool(false, "", group="UI Settings", inline="1.618")
nFib2000        = input.float(2, "", step=0.01, group="UI Settings", inline="1.618")
colorFib2000    = input.color(color.white, "", group="UI Settings", inline="1.618")


isfib2618       = input.bool(false, "", group="UI Settings", inline="2.618")
nFib2618        = input.float(2.618, "", step=0.01, group="UI Settings", inline="2.618")
colorFib2618    = input.color(color.white, "", group="UI Settings", inline="2.618")


// ] —————— Vars —————— [
var fib0000     = close
var fib0206     = close
var fib0382     = close
var fib0500     = close
var fib0618     = close
var fib0786     = close
var fib1000     = close
var fib1414     = close
var fib1618     = close
var fib2000     = close
var fib2618     = close


// ] —————— Find Dev Pivots —————— [


getMultiTfPivots()=>
    float ph    = ta.pivothigh(leftBars, rightBars)
    float pl    = ta.pivotlow(leftBars, rightBars)
    phBIndexS   = ph ? time[rightBars] : na
    plBIndexS   = pl ? time[rightBars] : na


    [ph, phBIndexS, pl, plBIndexS]


// get if there if Pivot High/low and their start/end times
[ph, phBIndexS, pl, plBIndexS] = request.security(syminfo.tickerid, timeframe, getMultiTfPivots(), lookahead = barmerge.lookahead_on)


// ] —————— Fibs Handles —————— [
// Get last highs/lows.
pivothigh           = na(ph[1]) and ph ? ph : na
pivotlow            = na(pl[1]) and pl ? pl : na
var isHighLast      = true
var curPivotP       = 0.
var lastPivotP      = 0.
var curPivotBi      = 0
var lastPivotBi     = 0


// Special case: where high & low detected at the same time.
if not na(pivothigh) and not na(pivotlow)
    lastPivotP          := isHighLast ? pl : ph
    curPivotP           := isHighLast ? ph : pl
    lastPivotBi         := isHighLast ? plBIndexS : phBIndexS
    curPivotBi          := isHighLast ? phBIndexS : plBIndexS
// All cases
else
    isHighLast          := not na(pivothigh) ? true : not na(pivotlow) ? false : isHighLast

    lastPivotP          := not na(pivothigh) and not isHighLast[1] or not na(pivotlow) and isHighLast[1] ? curPivotP : lastPivotP
    curPivotP           := not na(pivothigh) ? ph : not na(pivotlow) ? pl : curPivotP

    lastPivotBi         := not na(pivothigh) and not isHighLast[1] or not na(pivotlow) and isHighLast[1] ? curPivotBi : lastPivotBi
    curPivotBi          := not na(pivothigh) ? phBIndexS : not na(pivotlow) ? plBIndexS : curPivotBi


// Logic fibo direction.
fiboDirUp           = isHighLast


// Last Update Barindex.
var barLastUpdate = 0
barLastUpdate       := lastPivotBi


// Calculate fibs levels.
rangeD          = isHighLast ? curPivotP - lastPivotP : lastPivotP - curPivotP
fib0000         := fiboDirUp ? curPivotP - nFib0000 * rangeD : curPivotP + nFib0000 * rangeD
fib0206         := fiboDirUp ? curPivotP - nFib0206 * rangeD : curPivotP + nFib0206 * rangeD
fib0382         := fiboDirUp ? curPivotP - nFib0382 * rangeD : curPivotP + nFib0382 * rangeD
fib0500         := fiboDirUp ? curPivotP - nFib0500 * rangeD : curPivotP + nFib0500 * rangeD
fib0618         := fiboDirUp ? curPivotP - nFib0618 * rangeD : curPivotP + nFib0618 * rangeD
fib0786         := fiboDirUp ? curPivotP - nFib0786 * rangeD : curPivotP + nFib0786 * rangeD
fib1000         := fiboDirUp ? curPivotP - nFib1000 * rangeD : curPivotP + nFib1000 * rangeD
fib1414         := fiboDirUp ? curPivotP - nFib1414 * rangeD : curPivotP + nFib1414 * rangeD
fib1618         := fiboDirUp ? curPivotP - nFib1618 * rangeD : curPivotP + nFib1618 * rangeD
fib2000         := fiboDirUp ? curPivotP - nFib2000 * rangeD : curPivotP + nFib2000 * rangeD
fib2618         := fiboDirUp ? curPivotP - nFib2618 * rangeD : curPivotP + nFib2618 * rangeD


// ] —————— Plot —————— [
var fib0000Line     = line.new(0, low, bar_index, high)
var fib0000Label    = label.new(bar_index, low, text="Init")


var fib0206Line     = line.new(0, low, bar_index, high)
var fib0206Label    = label.new(bar_index, low, text="Init")


var fib0382Line     = line.new(0, low, bar_index, high)
var fib0382Label    = label.new(bar_index, low, text="Init")


var fib0500Line     = line.new(0, low, bar_index, high)
var fib0500Label    = label.new(bar_index, low, text="Init")


var fib0618Line     = line.new(0, low, bar_index, high)
var fib0618Label    = label.new(bar_index, low, text="Init")


var fib0786Line     = line.new(0, low, bar_index, high)
var fib0786Label    = label.new(bar_index, low, text="Init")


var fib1000Line     = line.new(0, low, bar_index, high)
var fib1000Label    = label.new(bar_index, low, text="Init")


var fib1414Line     = line.new(0, low, bar_index, high)
var fib1414Label    = label.new(bar_index, low, text="Init")


var fib1618Line     = line.new(0, low, bar_index, high)
var fib1618Label    = label.new(bar_index, low, text="Init")


var fib2000Line     = line.new(0, low, bar_index, high)
var fib2000Label    = label.new(bar_index, low, text="Init")


var fib2618Line     = line.new(0, low, bar_index, high)
var fib2618Label    = label.new(bar_index, low, text="Init")


labelOffset = rightOffset


if isfib0000
    line.delete(fib0000Line)
    label.delete(fib0000Label)
    fib0000Line     := line.new(barLastUpdate, fib0000, time, fib0000, xloc=xloc.bar_time, color=isColorAll ? colorAll : colorFib0000,  width=1)
    fib0000Label    := label.new(x=bar_index + labelOffset, y = fib0000, xloc=xloc.bar_index, text=str.tostring(nFib0000), style=label.style_none, size=size.small, textcolor=isColorAll ? colorAll : colorFib0000, textalign=text.align_center)


if isfib0206
    line.delete(fib0206Line)
    label.delete(fib0206Label)
    fib0206Line     := line.new(barLastUpdate, fib0206, time, fib0206, xloc=xloc.bar_time, color=isColorAll ? colorAll : colorFib0206,  width=1)
    fib0206Label    := label.new(x=bar_index + labelOffset, y = fib0206, xloc=xloc.bar_index, text=str.tostring(nFib0206), style=label.style_none, size=size.small, textcolor=isColorAll ? colorAll : colorFib0206, textalign=text.align_center)


if isfib0382
    line.delete(fib0382Line)
    label.delete(fib0382Label)
    fib0382Line     := line.new(barLastUpdate, fib0382, time, fib0382, xloc=xloc.bar_time, color=isColorAll ? colorAll : colorFib0382,  width=1)
    fib0382Label    := label.new(x=bar_index + labelOffset, y = fib0382, xloc=xloc.bar_index, text=str.tostring(nFib0382), style=label.style_none, size=size.small, textcolor=isColorAll ? colorAll : colorFib0382, textalign=text.align_center)


if isfib0500
    line.delete(fib0500Line)
    label.delete(fib0500Label)
    fib0500Line     := line.new(barLastUpdate, fib0500, time, fib0500, xloc=xloc.bar_time, color=isColorAll ? colorAll : colorFib0500,  width=1)
    fib0500Label    := label.new(x=bar_index + labelOffset, y = fib0500, xloc=xloc.bar_index, text=str.tostring(nFib0500), style=label.style_none, size=size.small, textcolor=isColorAll ? colorAll : colorFib0500, textalign=text.align_center)


if isfib0618
    line.delete(fib0618Line)
    label.delete(fib0618Label)
    fib0618Line     := line.new(barLastUpdate, fib0618, time, fib0618, xloc=xloc.bar_time, color=isColorAll ? colorAll : colorFib0618,  width=1)
    fib0618Label    := label.new(x=bar_index + labelOffset, y = fib0618, xloc=xloc.bar_index, text=str.tostring(nFib0618), style=label.style_none, size=size.small, textcolor=isColorAll ? colorAll : colorFib0618, textalign=text.align_center)


if isfib0786
    line.delete(fib0786Line)
    label.delete(fib0786Label)
    fib0786Line     := line.new(barLastUpdate, fib0786, time, fib0786, xloc=xloc.bar_time, color=isColorAll ? colorAll : colorFib0786,  width=1)
    fib0786Label    := label.new(x=bar_index + labelOffset, y = fib0786, xloc=xloc.bar_index, text=str.tostring(nFib0786), style=label.style_none, size=size.small, textcolor=isColorAll ? colorAll : colorFib0786, textalign=text.align_center)


if isfib1000
    line.delete(fib1000Line)
    label.delete(fib1000Label)
    fib1000Line     := line.new(barLastUpdate, fib1000, time, fib1000, xloc=xloc.bar_time, color=isColorAll ? colorAll : colorFib1000,  width=1)
    fib1000Label    := label.new(x=bar_index + labelOffset, y = fib1000, xloc=xloc.bar_index, text=str.tostring(nFib1000), style=label.style_none, size=size.small, textcolor=isColorAll ? colorAll : colorFib1000, textalign=text.align_center)


if isfib1414
    line.delete(fib1414Line)
    label.delete(fib1414Label)
    fib1414Line     := line.new(barLastUpdate, fib1414, time, fib1414, xloc=xloc.bar_time, color=isColorAll ? colorAll : colorFib1414,  width=1)
    fib1414Label    := label.new(x=bar_index + labelOffset, y = fib1414, xloc=xloc.bar_index, text=str.tostring(nFib1414), style=label.style_none, size=size.small, textcolor=isColorAll ? colorAll : colorFib1414, textalign=text.align_center)


if isfib1618
    line.delete(fib1618Line)
    label.delete(fib1618Label)
    fib1618Line     := line.new(barLastUpdate, fib1618, time, fib1618, xloc=xloc.bar_time, color=isColorAll ? colorAll : colorFib1618,  width=1)
    fib1618Label    := label.new(x=bar_index + labelOffset, y = fib1618, xloc=xloc.bar_index, text=str.tostring(nFib1618), style=label.style_none, size=size.small, textcolor=isColorAll ? colorAll : colorFib1618, textalign=text.align_center)


if isfib2000
    line.delete(fib2000Line)
    label.delete(fib2000Label)
    fib2000Line     := line.new(barLastUpdate, fib2000, time, fib2000, xloc=xloc.bar_time, color=isColorAll ? colorAll : colorFib2000,  width=1)
    fib2000Label    := label.new(x=bar_index + labelOffset, y = fib2000, xloc=xloc.bar_index, text=str.tostring(nFib2000), style=label.style_none, size=size.small, textcolor=isColorAll ? colorAll : colorFib2000, textalign=text.align_center)


if isfib2618
    line.delete(fib2618Line)
    label.delete(fib2618Label)
    fib2618Line     := line.new(barLastUpdate, fib2618, time, fib2618, xloc=xloc.bar_time, color=isColorAll ? colorAll : colorFib2618,  width=1)
    fib2618Label    := label.new(x=bar_index + labelOffset, y = fib2618, xloc=xloc.bar_index, text=str.tostring(nFib2618), style=label.style_none, size=size.small, textcolor=isColorAll ? colorAll : colorFib2618, textalign=text.align_center)


// linefill.new(fib0786Line, fib1000Line, color.blue)


// ]


// Volume Profile


vp_lookback = input.int(defval=80, title='Volume Lookback Depth [10-1000]', minval=10, maxval=1000, group="Volume Profile")


vp_max_bars = input.int(defval=120, title='Number of Bars [10-500]', minval=10, maxval=500, group="Volume Profile")


vp_bar_mult = input.int(defval=10, title='Bar Length Multiplier [10-100]', minval=10, maxval=100, group="Volume Profile")


vp_bar_offset = input.int(defval=20, title='Bar Horizontal Offset [0-100]', minval=0, maxval=100, group="Volume Profile")


vp_bar_width = input.int(defval=1, title='Bar Width [1-20]', minval=1, maxval=20, group="Volume Profile")


vp_delta_type = input.string(defval='Both', title='Delta Type', options=['Both', 'Bullish', 'Bearish'], group="Volume Profile")


vp_poc_show = input(defval=true, title='Show POC Line', group="Volume Profile")


vp_vah_val_show = input(defval=true, title='Show VAH and VAL Lines', group="Volume Profile")


vp_profile_show = input(defval=true, title='Show Volume Profile', group="Volume Profile")  // added input switch


vp_bar_color = input(defval=color.new(color.gray, 60), title='Bar Color', group="Volume Profile")


vp_poc_color = input(defval=color.new(#f50101, 10), title='POC Color', group="Volume Profile")


vp_vah_color = input(defval=color.new(color.white, 10), title='VAH Color', group="Volume Profile")


vp_val_color = input(defval=color.new(color.white, 10), title='VAL Color', group="Volume Profile")


float vp_Vmax = 0.0
int vp_VmaxId = 0
int vp_N_BARS = vp_max_bars


var int vp_first = time


vp_a_P = array.new_float(vp_N_BARS + 1, 0.0)
vp_a_V = array.new_float(vp_N_BARS, 0.0)
vp_a_D = array.new_float(vp_N_BARS, 0.0)
vp_a_W = array.new_int(vp_N_BARS, 0)


float vp_HH = ta.highest(high, vp_lookback)
float vp_LL = ta.lowest(low, vp_lookback)


if barstate.islast
    float vp_HL = (vp_HH - vp_LL) / vp_N_BARS
    for j = 1 to vp_N_BARS + 1 by 1
        array.set(vp_a_P, j - 1, vp_LL + vp_HL * j)
    for i = 0 to vp_lookback - 1 by 1
        int Dc = 0
        array.fill(vp_a_D, 0.0)
        for j = 0 to vp_N_BARS - 1 by 1
            float Pj = array.get(vp_a_P, j)
            if low[i] < Pj and high[i] > Pj and (vp_delta_type == 'Bullish' ? close[i] >= open[i] : vp_delta_type == 'Bearish' ? close[i] <= open[i] : true)
                float Dj = array.get(vp_a_D, j)
                float dDj = Dj + nz(volume[i])
                array.set(vp_a_D, j, dDj)
                Dc += 1
                Dc
        for j = 0 to vp_N_BARS - 1 by 1
            float Vj = array.get(vp_a_V, j)
            float Dj = array.get(vp_a_D, j)
            float dVj = Vj + (Dc > 0 ? Dj / Dc : 0.0)
            array.set(vp_a_V, j, dVj)
    vp_Vmax := array.max(vp_a_V)
    vp_VmaxId := array.indexof(vp_a_V, vp_Vmax)
    for j = 0 to vp_N_BARS - 1 by 1
        float Vj = array.get(vp_a_V, j)
        int Aj = math.round(vp_bar_mult * Vj / vp_Vmax)
        array.set(vp_a_W, j, Aj)


if barstate.isfirst
    vp_first := time
    vp_first
vp_change = ta.change(time)
vp_x_loc = timenow + math.round(vp_change * vp_bar_offset)


f_setup_bar(n) =>
    if vp_profile_show
        x1 = vp_VmaxId == n and vp_poc_show ? math.max(time[vp_lookback], vp_first) : timenow + math.round(vp_change * (vp_bar_offset - array.get(vp_a_W, n)))
        ys = array.get(vp_a_P, n)
        line.new(x1=x1, y1=ys, x2=vp_x_loc, y2=ys, xloc=xloc.bar_time, extend=extend.none, color=vp_VmaxId == n ? vp_poc_color : vp_bar_color, style=line.style_solid, width=vp_bar_width)


if barstate.islast
    for i = 0 to vp_N_BARS - 1 by 1
        f_setup_bar(i)


float total_volume = array.sum(vp_a_V)
int VAL_id = na
int VAH_id = na
float cumulative_volume = 0.0
for j = 0 to vp_N_BARS - 1 by 1
    cumulative_volume := cumulative_volume + array.get(vp_a_V, j)
    if na(VAL_id) and cumulative_volume > total_volume * 0.26
        VAL_id := j
    if na(VAH_id) and cumulative_volume > total_volume * 0.963
        VAH_id := j
        break


f_setup_line(n, line_color) =>
    x1 = math.max(time[vp_lookback], vp_first)
    ys = array.get(vp_a_P, n)
    line.new(x1=x1, y1=ys, x2=vp_x_loc, y2=ys, xloc=xloc.bar_time,
     extend=extend.none, color=line_color, style=line.style_solid,
     width=vp_bar_width)


if barstate.islast and vp_vah_val_show
    f_setup_line(VAH_id, vp_vah_color)
    f_setup_line(VAL_id, vp_val_color)


// Lux Algo Reversal Band


//func
kama(ssrc, llen) =>
    kama = 0.0
    sum_1 = math.sum(math.abs(ssrc - ssrc[1]), llen)
    sum_2 = math.sum(math.abs(ssrc - ssrc[1]), llen)
    kama := nz(kama[1]) + math.pow((sum_1 != 0 ? math.abs(ssrc - ssrc[llen]) / sum_2 : 0) * (0.288 - 0.0666) + 0.0666, 2) * (ssrc - nz(kama[1]))
    kama


//inputs
llength = input(50, title='Band Length')
bd1 = input(7, title='Frontrun Band Deviation')
bd2 = input(9, title='Initial Band Deviation')
bd3 = input(11, title='Final Band Deviation')


//logic
rg = kama(ta.tr, llength)
basis = kama(close, llength)
upper1 = basis + rg * bd1
upper2 = basis + rg * bd2
upper3 = basis + rg * bd3
lower1 = basis - rg * bd1
lower2 = basis - rg * bd2
lower3 = basis - rg * bd3


//ploting
show_rev = input.bool(true, 'Reversal Clouds', inline = 'overlayLine4', group = 'Settings')
pp1 = plot(show_rev ? upper1 : na, transp=100)
pp2 = plot(show_rev ? upper2  : na, transp=100)
pp3 = plot(show_rev ? upper3  : na, transp=100)
pp4 = plot(show_rev ? lower1  : na, transp=100)
pp5 = plot(show_rev ? lower2  : na, transp=100)
pp6 = plot(show_rev ? lower3  : na, transp=100)
fill(pp1, pp2, color=color.new(#57202c, 70))
fill(pp2, pp3, color=color.new(#57202c, 50))
fill(pp4, pp5, color=color.new(#103c3c, 70))
fill(pp5, pp6, color=color.new(#103c3c, 50))


// Candle Coloring


// Input
fastLength = input(title="Fast Length", defval=12)
slowLength = input(title="Slow Length", defval=26)
srrrc = input(title="Source", defval=close)
signalLength = input.int(title="Signal Smoothing",  minval = 1, maxval = 50, defval = 9)


// Data reference
[macd, signal, hist] = ta.macd(srrrc, fastLength, slowLength, signalLength)


// 4 level of green
greenHigh = #05df09
greenMidHigh = #05df09
greenMidLow = #388E3C
greenLow = #5f3a97


// Yellow
yellowLow = #5f3a97


// 4 level of red
redHigh = #ea0402
redMidHigh = #ea0402
redMidLow = #cc0402
redLow = #5f3a97


// Default color
candleBody = yellowLow


// Ranging trend
if hist > 0
    if hist > hist[1] and hist[1] > 0
        candleBody := greenLow

if hist < 0
    if hist < hist[1] and hist[1] < 0
        candleBody := redLow


// Bullish trend
if macd > 0 and hist > 0
    candleBody := greenMidLow

    if hist > hist[1] and macd[1] > 0 and hist[1] > 0
        candleBody := greenMidHigh

        if hist > hist[2] and macd[2] > 0 and hist[2] > 0
            candleBody := greenHigh


// Bearish trend
if macd < 0 and hist < 0
    candleBody := redMidLow

    if hist < hist[1] and macd[1] < 0 and hist[1] < 0
        candleBody := redMidHigh

        if hist < hist[2] and macd[2] < 0 and hist[2] < 0
            candleBody := redHigh


barcolor(candleBody) // Include suggestion by Shaheen204


// Range Filter DW


//---------------------Range Filter----------------------------------------------------------------------------------------------------------------------


Show_rangefilter = input.bool(true, 'Range Filter', inline = 'overlayLine4', group = 'Settings')


//Conditional Sampling EMA Function
Cond_EMA(x, cond, n) =>
    var val = array.new_float(0)
    var ema_val = array.new_float(1)
    if cond
        array.push(val, x)
        if array.size(val) > 1
            array.remove(val, 0)
        if na(array.get(ema_val, 0))
            array.fill(ema_val, array.get(val, 0))
        array.set(ema_val, 0, (array.get(val, 0) - array.get(ema_val, 0)) * (2 / (n + 1)) + array.get(ema_val, 0))
    EMA = array.get(ema_val, 0)
    EMA


//Conditional Sampling SMA Function
Cond_SMA(x, cond, n) =>
    var vals = array.new_float(0)
    if cond
        array.push(vals, x)
        if array.size(vals) > n
            array.remove(vals, 0)
    SMA = array.avg(vals)
    SMA


//Standard Deviation Function
Stdev(x, n) =>
    math.sqrt(Cond_SMA(math.pow(x, 2), 1, n) - math.pow(Cond_SMA(x, 1, n), 2))


//Range Size Function
rng_size(x, scale, qty, n) =>
    ATR = Cond_EMA(ta.tr(true), 1, n)
    AC = Cond_EMA(math.abs(x - x[1]), 1, n)
    SD = Stdev(x, n)
    rng_size = scale == 'Pips' ? qty * 0.0001 : scale == 'Points' ? qty * syminfo.pointvalue : scale == '% of Price' ? close * qty / 100 : scale == 'ATR' ? qty * ATR : scale == 'Average Change' ? qty * AC : scale == 'Standard Deviation' ? qty * SD : scale == 'Ticks' ? qty * syminfo.mintick : qty
    rng_size


//Two Type Range Filter Function
rng_filt(h, l, rng_, n, type, smooth, sn, av_rf, av_n) =>
    rng_smooth = Cond_EMA(rng_, 1, sn)
    r = smooth ? rng_smooth : rng_
    var rfilt = array.new_float(2, (h + l) / 2)
    array.set(rfilt, 1, array.get(rfilt, 0))
    if type == 'Type 1'
        if h - r > array.get(rfilt, 1)
            array.set(rfilt, 0, h - r)
        if l + r < array.get(rfilt, 1)
            array.set(rfilt, 0, l + r)
    if type == 'Type 2'
        if h >= array.get(rfilt, 1) + r
            array.set(rfilt, 0, array.get(rfilt, 1) + math.floor(math.abs(h - array.get(rfilt, 1)) / r) * r)
        if l <= array.get(rfilt, 1) - r
            array.set(rfilt, 0, array.get(rfilt, 1) - math.floor(math.abs(l - array.get(rfilt, 1)) / r) * r)
    rng_filt1 = array.get(rfilt, 0)
    hi_band1 = rng_filt1 + r
    lo_band1 = rng_filt1 - r
    rng_filt2 = Cond_EMA(rng_filt1, rng_filt1 != rng_filt1[1], av_n)
    hi_band2 = Cond_EMA(hi_band1, rng_filt1 != rng_filt1[1], av_n)
    lo_band2 = Cond_EMA(lo_band1, rng_filt1 != rng_filt1[1], av_n)
    rng_filt = av_rf ? rng_filt2 : rng_filt1
    hi_band = av_rf ? hi_band2 : hi_band1
    lo_band = av_rf ? lo_band2 : lo_band1
    [hi_band, lo_band, rng_filt]


//-----------------------------------------------------------------------------------------------------------------------------------------------------------------
//Inputs
//-----------------------------------------------------------------------------------------------------------------------------------------------------------------


//Filter Type
f_type = 'Type 2'


//Movement Source
mov_src = 'Close'


//Range Size Inputs
rng_qty = 2.618
rng_scale = 'Average Change'


//Range Period
rng_per = 14


//Range Smoothing Inputs
smooth_range = true
smooth_per = 27


//Filter Value Averaging Inputs
av_vals = false
av_samples = 2


//-----------------------------------------------------------------------------------------------------------------------------------------------------------------
//Definitions
//-----------------------------------------------------------------------------------------------------------------------------------------------------------------


//High And Low Values
h_val = mov_src == 'Wicks' ? high : close
l_val = mov_src == 'Wicks' ? low : close


//Range Filter Values
[h_band, l_band, filt] = rng_filt(h_val, l_val, rng_size((h_val + l_val) / 2, rng_scale, rng_qty, rng_per), rng_per, f_type, smooth_range, smooth_per, av_vals, av_samples)


//Direction Conditions
var fdir = 0.0
fdir := filt > filt[1] ? 1 : filt < filt[1] ? -1 : fdir
upward = fdir == 1 ? 1 : 0
downward = fdir == -1 ? 1 : 0


//Colors
filt_color = upward ? #36db7f : downward ? #be130f : #cccccc


//-----------------------------------------------------------------------------------------------------------------------------------------------------------------
//Outputs
//-----------------------------------------------------------------------------------------------------------------------------------------------------------------


//Filter Plot
filt_plot = plot(Show_rangefilter ? filt : na, color=filt_color, linewidth=3, title='Filter', transp=0)


//Bar Color


//External Trend Output
plot(fdir, editable=false, display=display.none, title='External Output - Trend Signal', transp=100)
How to Apply Pine Script in TradingView:
- Open TradingView and log in.
- Navigate to the Pine Script Editor (bottom of the screen).
- Copy and paste the provided script code.
- Click Save, then name the script (e.g., “NEOICHI Indicator”).
- Click Add to Chart to apply it.
- Customize the settings based on your trading preferences.
Additional Trading Tips:
- Combine with Momentum Indicators:
Use RSI or MACD alongside this script to confirm trend strength before entering trades. - Monitor Key Liquidity Areas:
Pay attention to the POC and Fibonacci confluence zones for high-probability trade opportunities. - Backtest Before Going Live:
Test the script across different timeframes and market conditions to determine its effectiveness for your strategy.
Final Thoughts:
The NEOICHI Indicator provides a comprehensive approach to market analysis, combining the power of Ichimoku clouds, Fibonacci retracements, and volume profiling. Whether you’re a short-term trader or a long-term investor, this tool can enhance your decision-making process.
However, keep in mind that no trading indicator is infallible, and disciplined risk management should always be your top priority.
RELATED POSTS
View all
Nas Rivera Indicator: Multi-Tool Trading System with ATR-Based Risk Management
January 3, 2025 | by admin
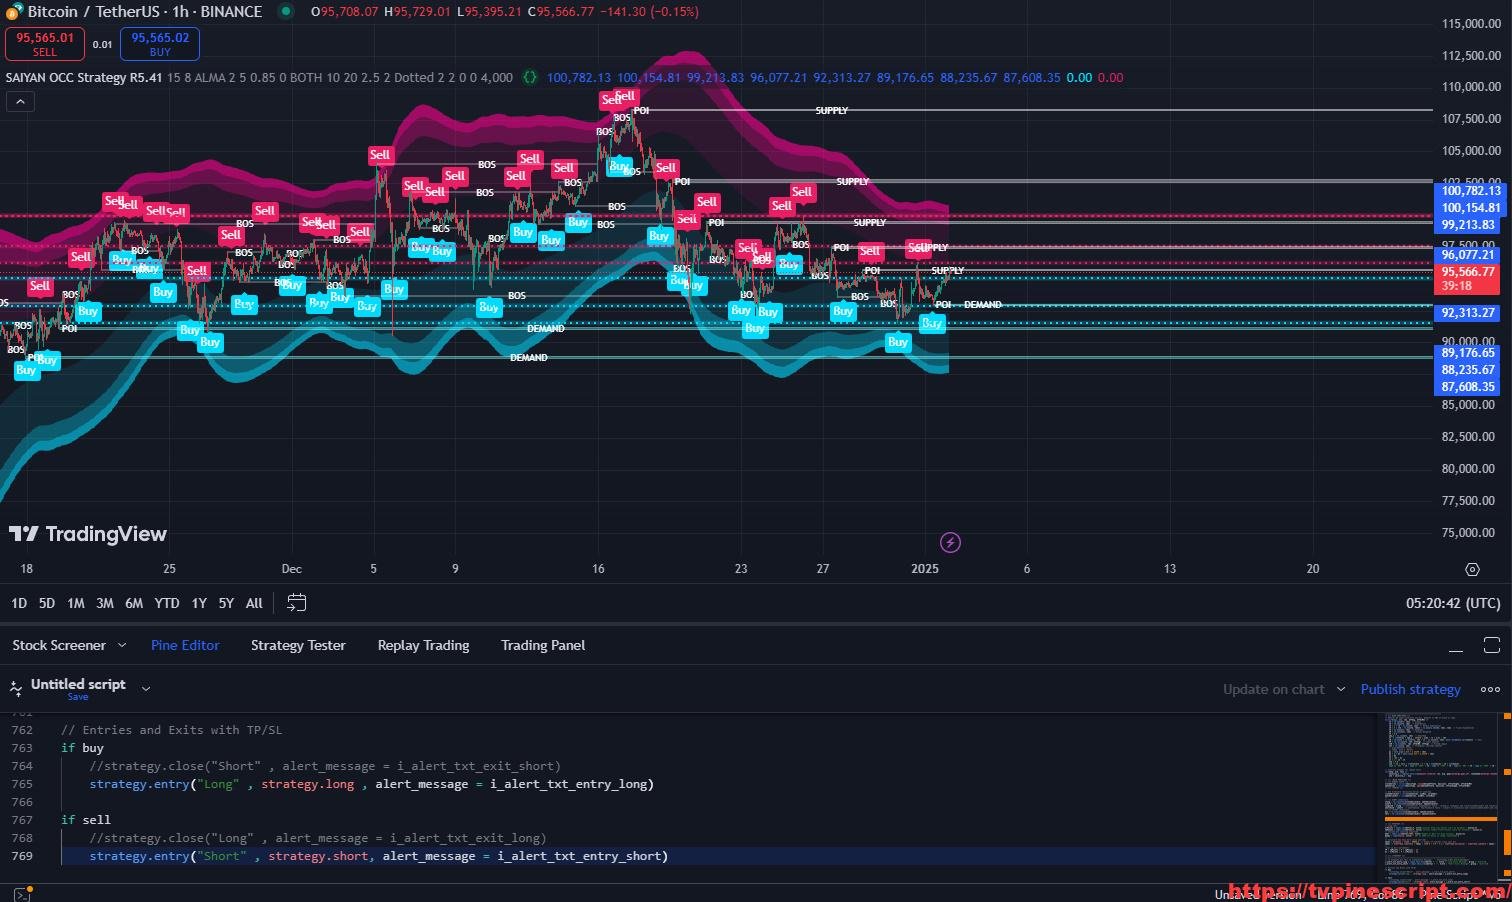
SAIYAN OCC Strategy R5.41: Advanced Supply/Demand Analysis and Trend Detection for Traders
January 3, 2025 | by admin
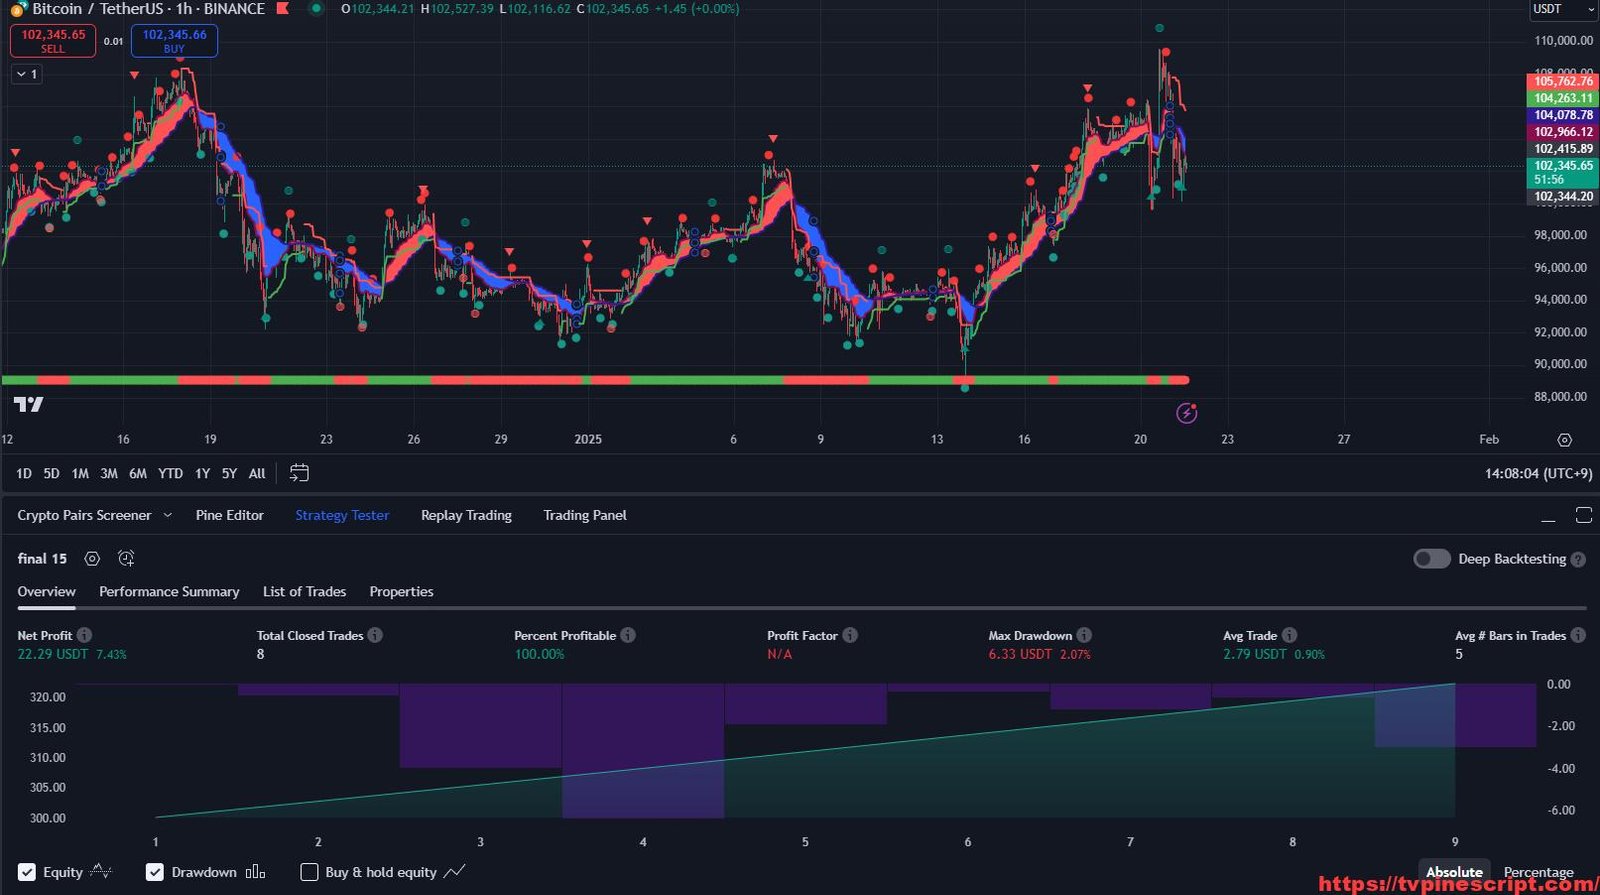
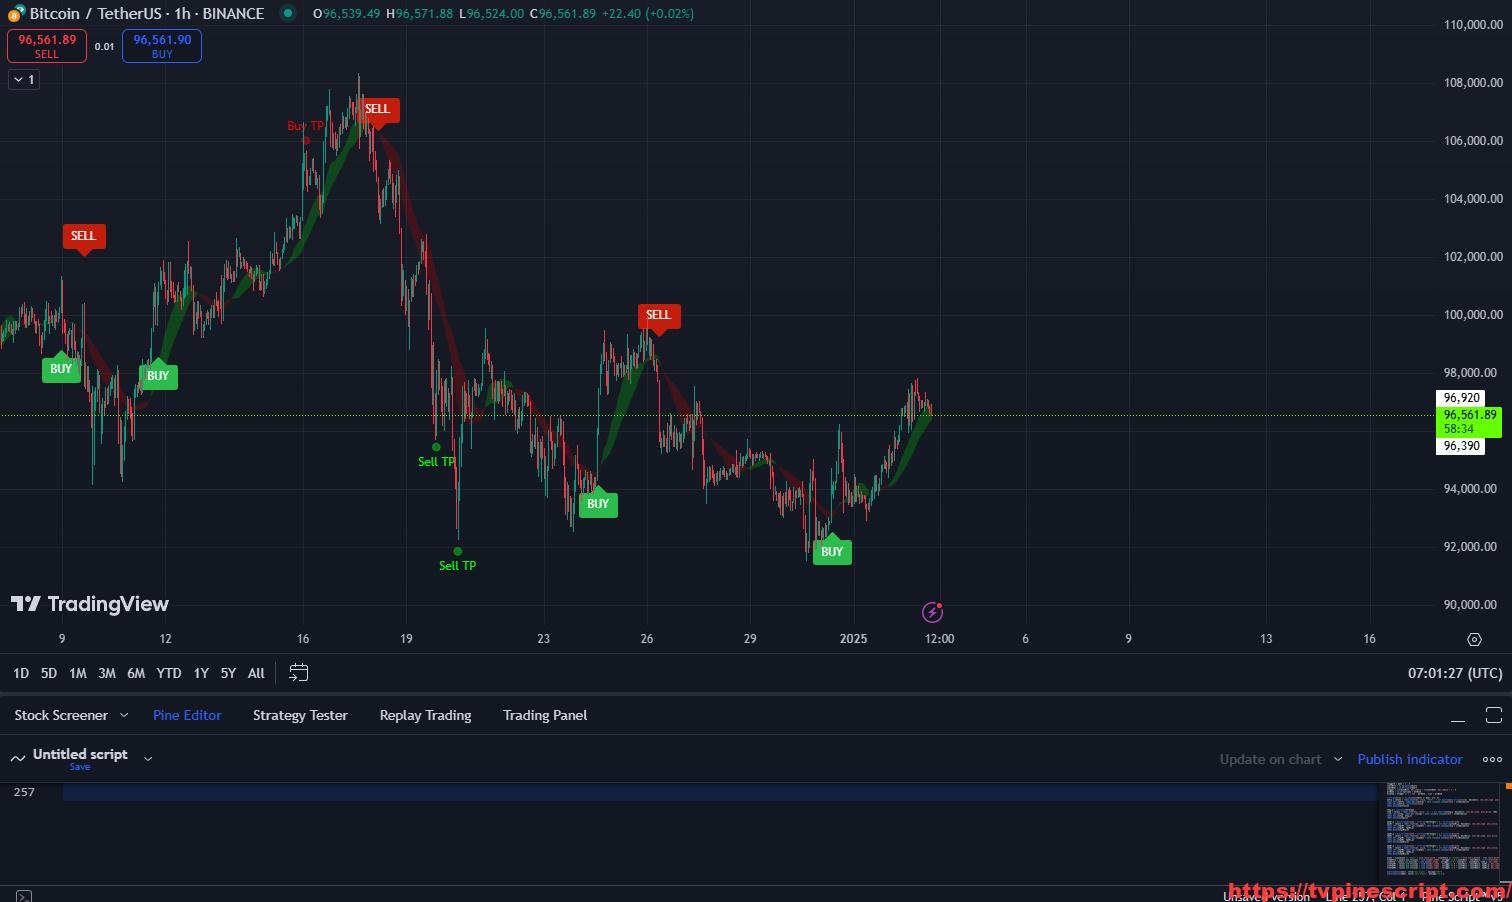
Final 15 Strategy: A Comprehensive Trading System Combining Adaptive Indicators
January 21, 2025 | by admin