All blog posts
Explore the world of design and learn how to create visually stunning artwork.
Master Market Liquidity with LiqD Liquidation Heatmap SB[ɅI]: A Game-Changer for Smart Trading Decisions
January 21, 2025 | by admin
RoyalPrince Indicator Pt.2: Comprehensive Market Trend and Support/Resistance Tool
January 21, 2025 | by admin
SimpleAlgo v3: Advanced SuperTrend and Risk Management Trading Indicator
January 20, 2025 | by admin
Frost Algo v3.0 : Advanced Multi-Indicator Trading System with Dynamic Risk Management
January 14, 2025 | by admin
The REAL-GAINS Algo: Advanced ATR-Driven Trend and Range Filter Trading Strategy
January 14, 2025 | by admin
Deep CPR Strategy v6: Comprehensive Pivot Points and Dynamic Channel Trading System
January 14, 2025 | by admin
Kamaljeet Rai – Advanced Strategy: EMA Cloud and ATR-Driven Trading Insights
January 14, 2025 | by admin
KARALYTIX Options SuperNova v1.0: Comprehensive Market Levels and Volatility Analysis Tool
January 14, 2025 | by admin
Demand & Supply Zone Indicator: Precision Market Structure with Real-Time Alerts
January 3, 2025 | by admin
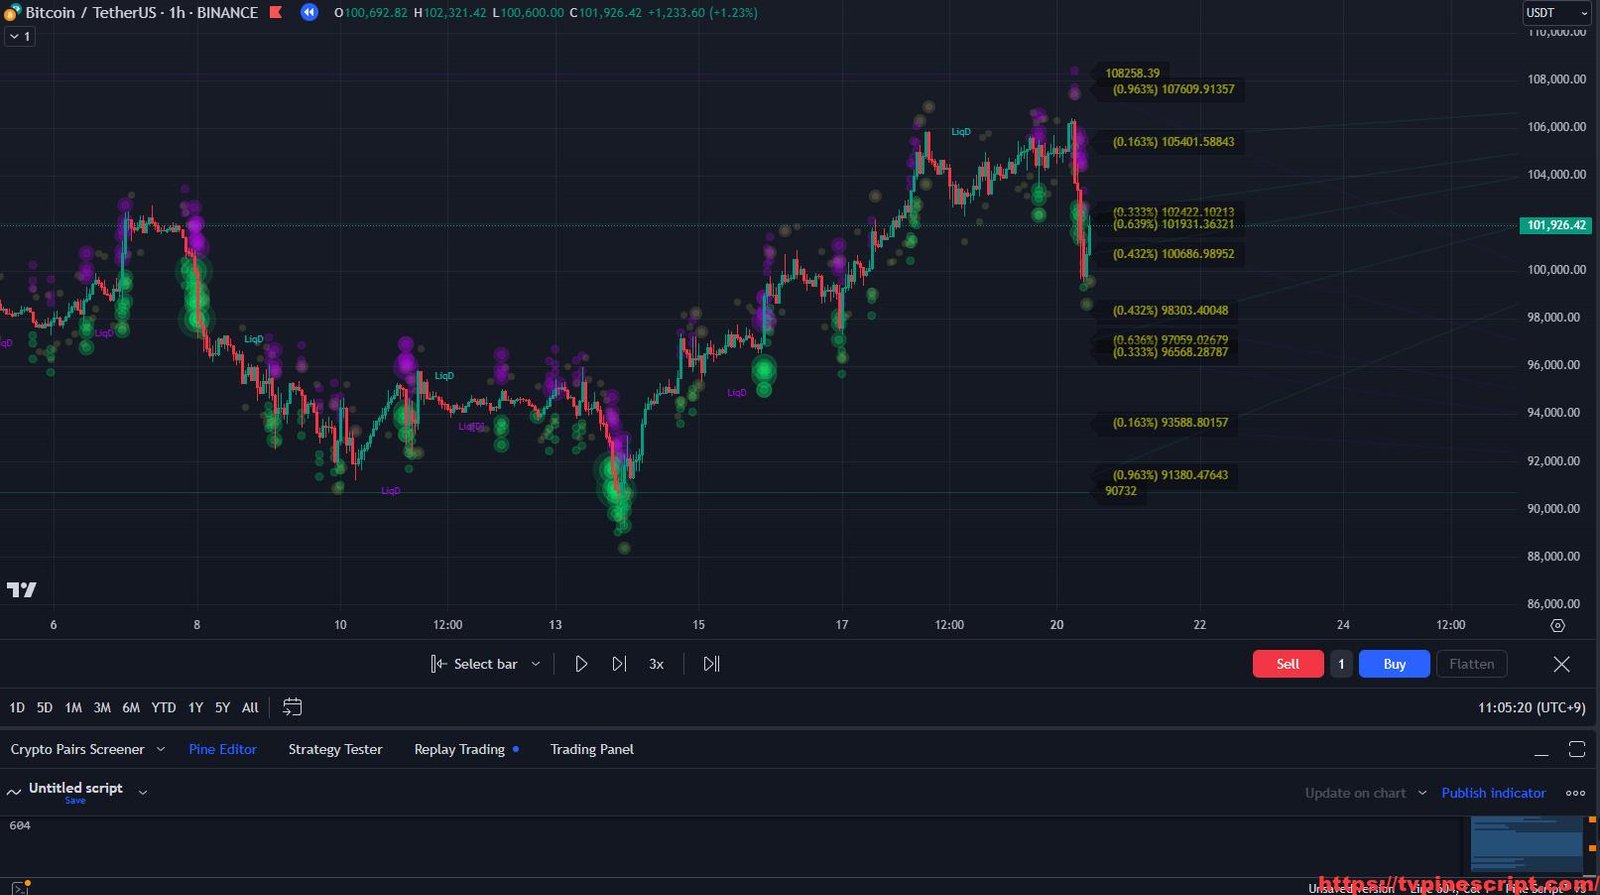
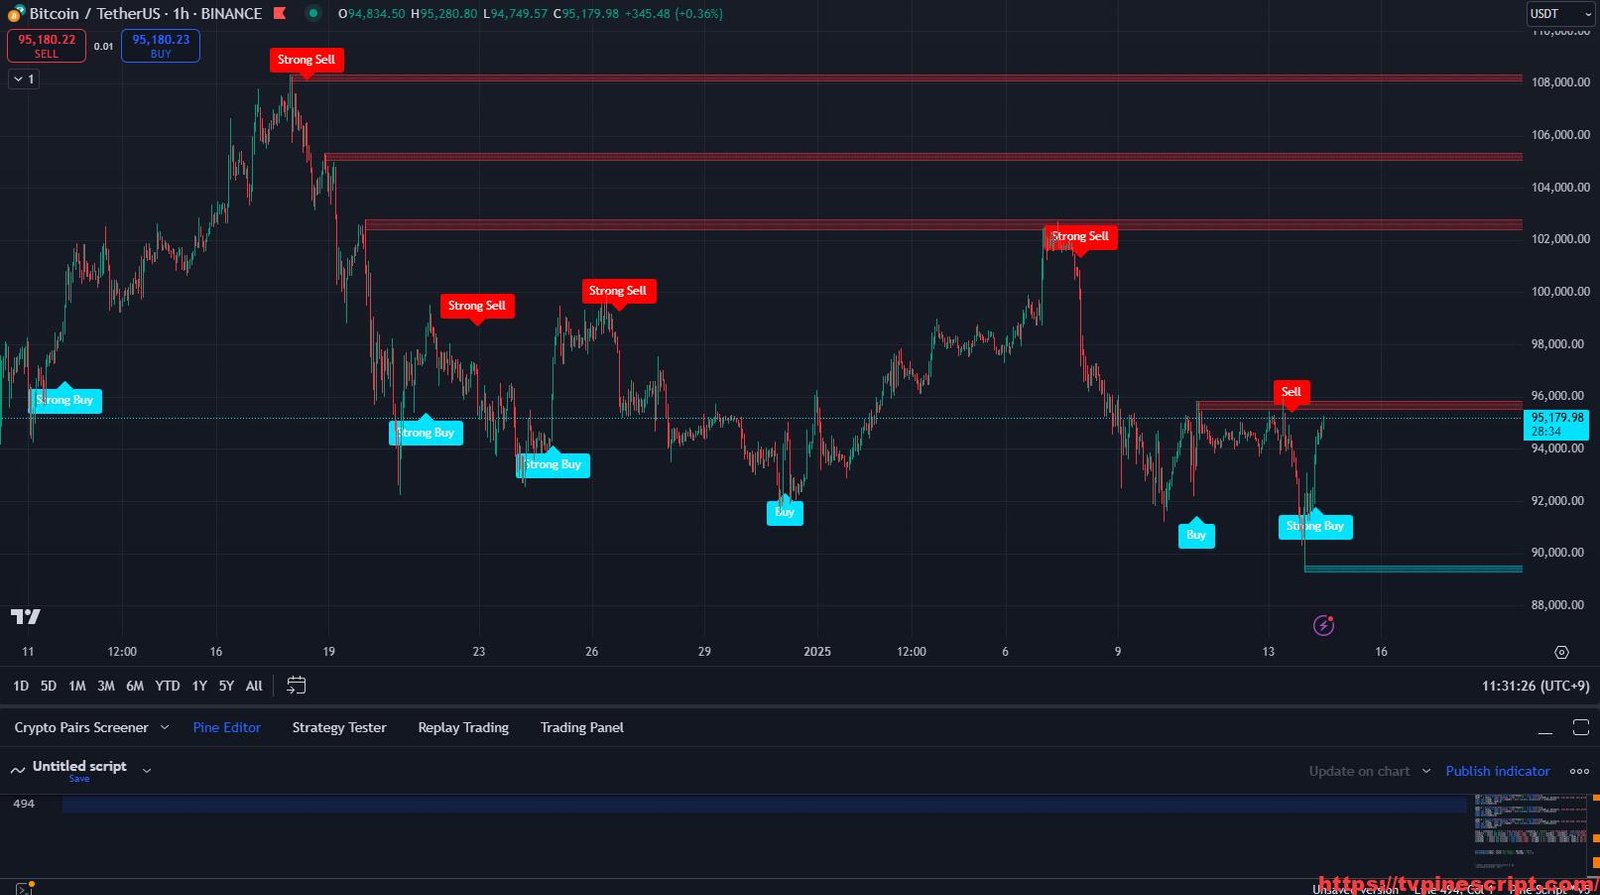
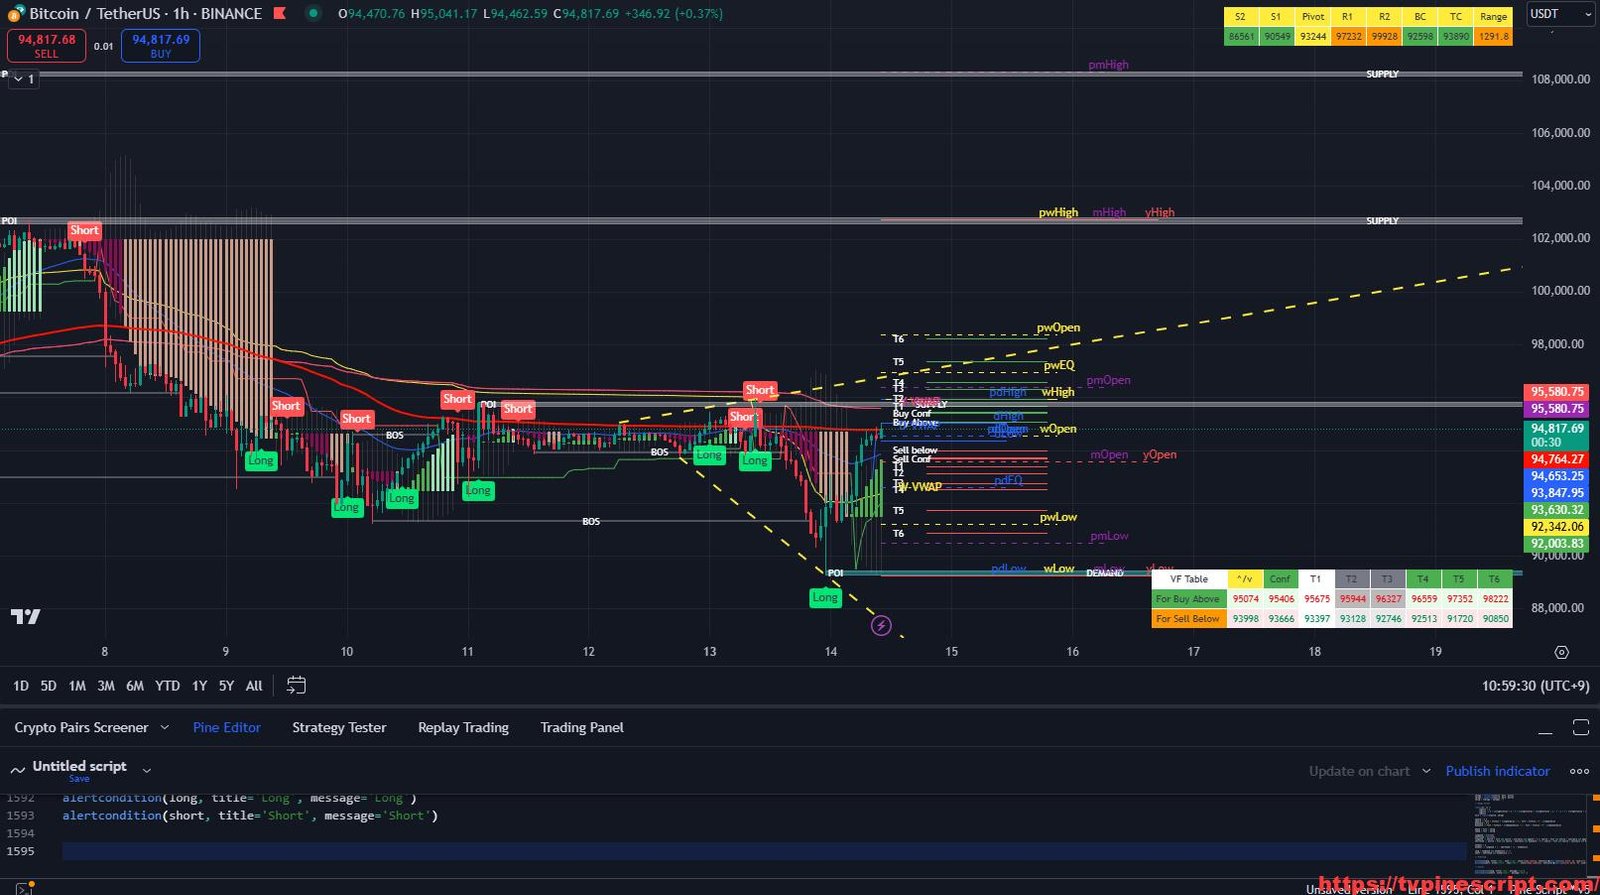
Navigating the financial markets can be daunting, especially when liquidity levels and market inefficiencies cloud your trading vision. Identifying where large liquidations may occur allows traders to anticipate sharp price movements and position themselves ahead of the crowd. Whether you are a scalper, day trader, or swing trader, understanding liquidity levels is essential for staying ahead of the game. The LiqD Liquidation Heatmap SB[ɅI] script offers a powerful toolset to visualize liquidation zones, detect high-impact price levels, and improve trading precision.
Key Features of the Script:
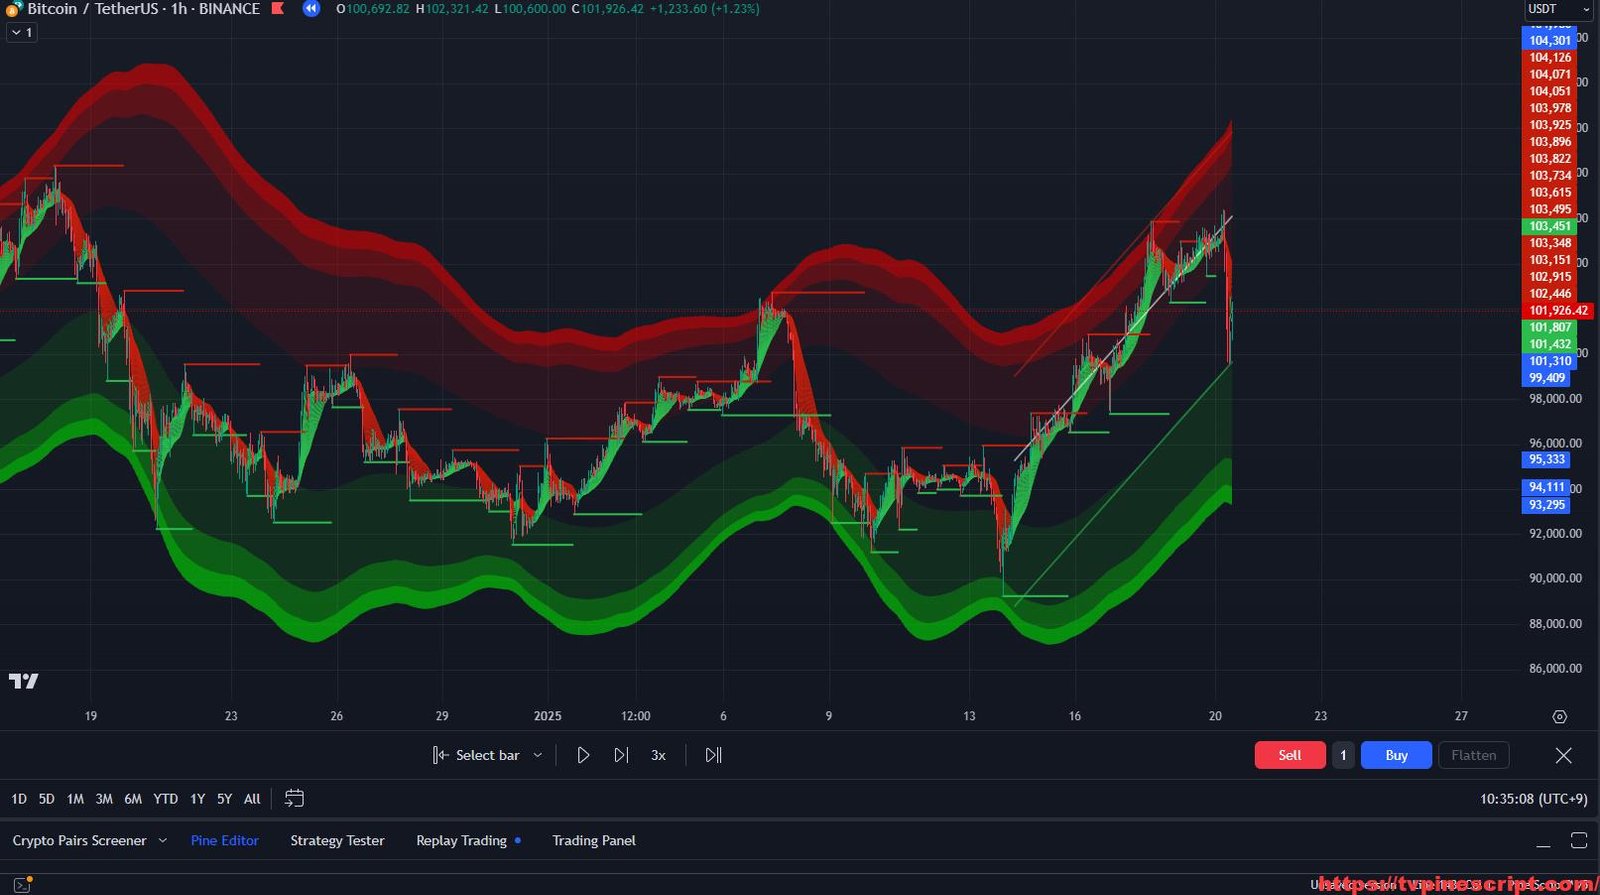
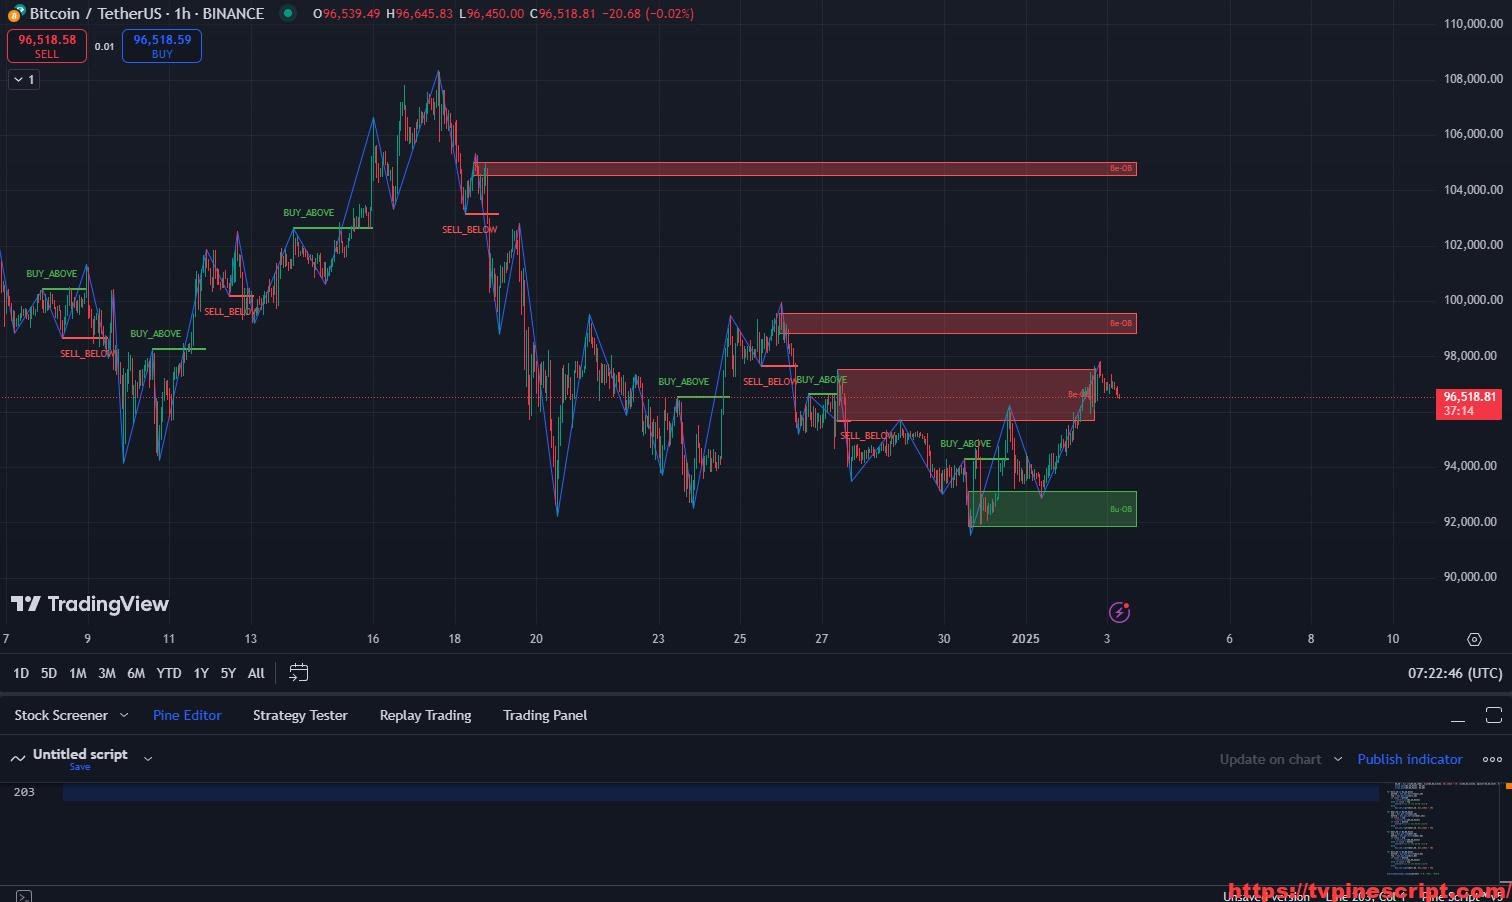
- Liquidation Heatmap Visualization:
- Detects high liquidity zones where potential liquidations may trigger rapid price movements.
- Color-coded liquidity zones for easy interpretation of support/resistance levels.
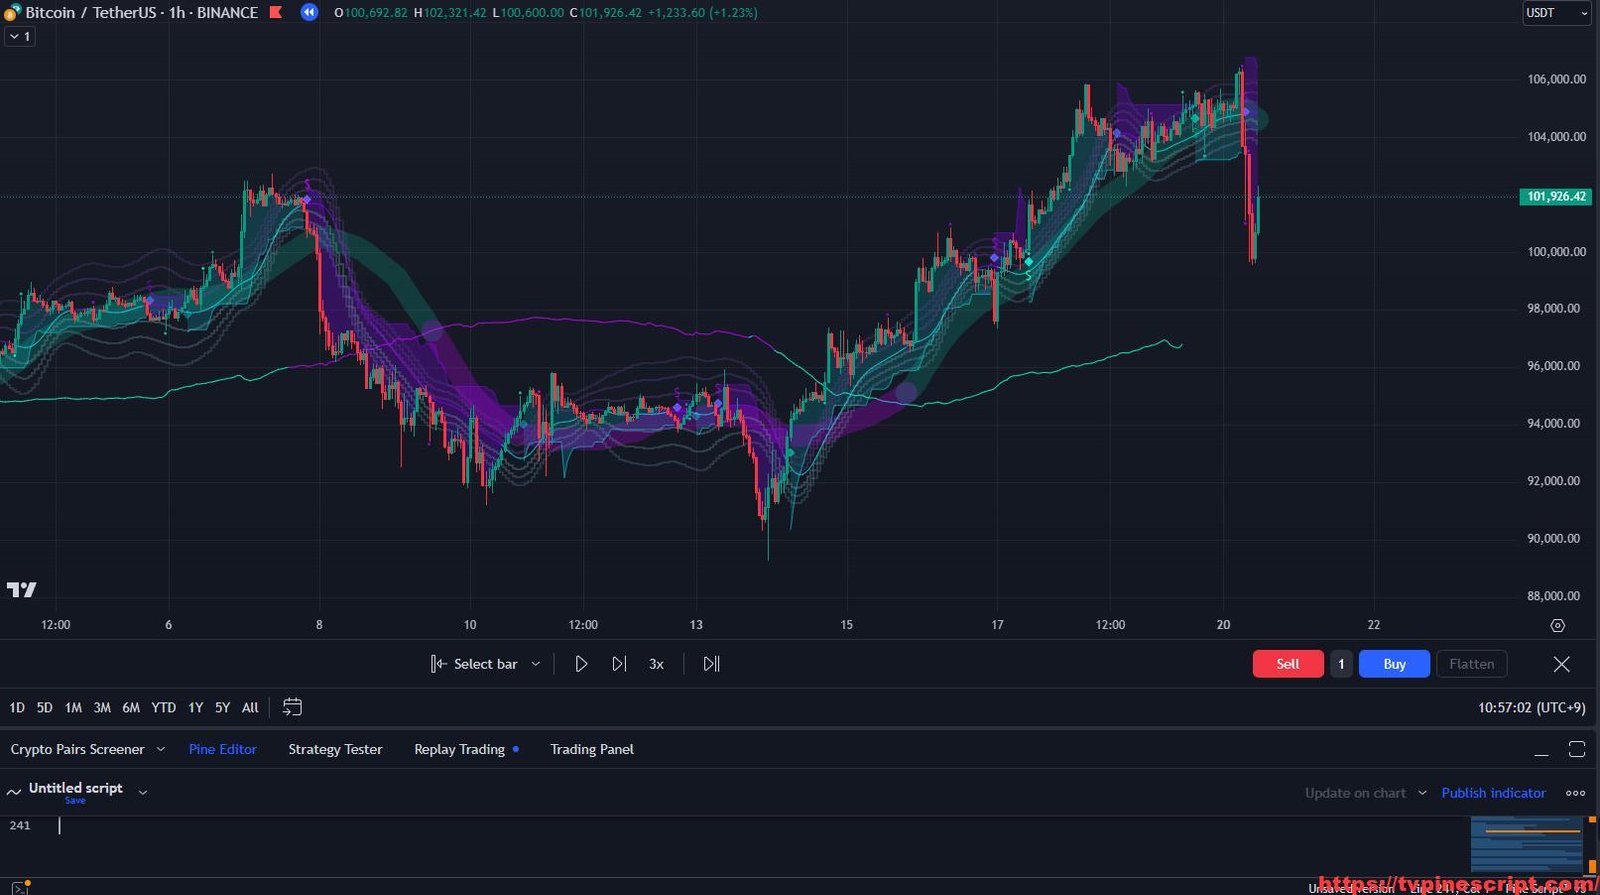
- Static and Dynamic Liquidity Lines:
- Tracks both static and dynamic liquidity levels using ATR-based pivot detection.
- Customizable sensitivity settings allow traders to adjust liquidity detection based on market conditions.
- AI-Powered Liquidation Bubbles:
- Implements AI-driven liquidation bubbles to highlight key levels where forced liquidations could occur.
- Supports volume-based thresholds to differentiate between high and low volatility environments.
- Multi-Timeframe Analysis Support:
- Analyzes liquidation levels across different timeframes to provide comprehensive market insights.
- Traders can compare short-term and long-term liquidity accumulation areas.
- Fibonacci-Based Liquidation Zones:
- Uses Fibonacci retracement levels to refine potential liquidation price targets.
- Automatic plotting of Fibonacci lines helps in identifying trend continuation or reversal points.
- Customizable Visualization Options:
- Displays liquidation levels, bubbles, and key price markers with a range of styling options.
- Adjustable color schemes to match trader preferences for better chart clarity.
- Real-Time Alerts and Notifications:
- Alerts when price reaches high-impact liquidity zones, helping traders take timely action.
- Notifications for breakout/breakdown events in highly liquid areas.
- Risk Management Enhancement:
- Helps traders avoid areas with high liquidation risk by providing clear visual cues.
- Can be used to place strategic stop-loss and take-profit levels outside of liquidation zones.
Recommended Usage:
- Scalping:
- Best suited for 1-minute to 15-minute charts.
- Utilize dynamic liquidation levels to anticipate short-term price spikes and avoid sudden reversals.
- Day Trading:
- Recommended for 5-minute to 1-hour charts.
- Monitor liquidity heatmaps and Fibonacci levels to enter trades at low-risk points.
- Swing Trading:
- Effective on 4-hour to daily charts.
- Identify key support/resistance zones where major liquidations may drive significant trend shifts.
- Risk Management Strategy:
- Leverage liquidation levels to fine-tune entry/exit points and minimize risk.
- Use the AI-based bubbles to detect potential stop-hunting areas.
Script Evaluation:
- Functionality: 4.8/5
A comprehensive script that integrates liquidity detection, Fibonacci levels, and AI-driven liquidation analysis. - Ease of Use: 4.2/5
The script offers powerful insights but requires a basic understanding of liquidation dynamics for optimal use. - Accuracy: 4.7/5
Provides reliable data-driven liquidation zones, but should be used alongside other technical indicators for confirmation. - Repainting Analysis:
This script does not repaint.
All calculations and indicators are based on confirmed bar data, making it suitable for both live trading and backtesting. - Optimal Timeframes:
- Scalping: 1-minute to 15-minute charts.
- Day Trading: 5-minute to 1-hour charts.
- Swing Trading: 4-hour to daily charts.
- Author and Development Quality:
The author of the script remains unnamed, but the code structure demonstrates a deep understanding of market liquidity and algorithmic trading. - Overall Score: 4.6/5
A must-have tool for traders seeking precision in liquidity-based trading strategies.
//@version=5
indicator("LiqD 🫧 Liquidation Heatmap SB[ɅI]", overlay = true, max_bars_back = 5000, max_boxes_count = 500, max_lines_count = 500, max_labels_count = 200)
string GROUP_PLS                     = 'Labels'
bool showLabelsPriceScaleInput          = input.bool(false, 'Show Labels on Price Scale.', tooltip="", group=GROUP_PLS)
// options
labelDisplay = showLabelsPriceScaleInput ? display.all : display.pane // , editable = false, display=labelDisplay)

// Liquidity Detection
SLLS = input.float(0.30 , 'Statics Liquidity Line Sensitivity', maxval = 0.4 ,minval = 0.0, step = 0.01) // Statics Liquidity Line Sensitivity
DLLS = input.float(1.00 , 'Dynamics Liquidity Line Sensitivity', maxval = 1.95 ,minval = 0.4, step = 0.01) // Dynamics Liquidity Line Sensitivity
SPP = input.int(8 , 'Statics Period Pivot') // Statics Period Pivot
DPP = input.int(3 , 'Dynamics Period Pivot') // Dynamics Period Pivot
ShowSHLL = input.bool(true , 'Show Statics High Liquidity Line')
ShowSLLL = input.bool(true , 'Show Statics Low Liquidity Line')
ShowDHLL = input.bool(true , 'Show Dynamics High Liquidity Line')
ShowDLLL = input.bool(true , 'Show Dynamics Low Liquidity Line')


LLF(sPP, dPP , SRs , SRd , ShowHLLs , ShowLLLs, ShowHLLd , ShowLLLd) => //StaticsLiquidityLineFunction  {p = Previous , c = Current , s = Statics , d = Dynamics, SR = Sensitivity Range}
    //get data
    //Average true Range
    ATR = ta.atr(44)
    STSHighPivot = ta.pivothigh(sPP,sPP) // Short term Statics High Pivot Price {True or False}
    STSLowPivot = ta.pivotlow(sPP,sPP) // Short term Statics Low Pivot Price {True or False}
    STSHVc = ta.valuewhen(STSHighPivot ,high[sPP], 0) // Short term Statics High
    STSLVc = ta.valuewhen(STSLowPivot ,low[sPP], 0) // Short term Statics Low
    STSHIc = ta.valuewhen(STSHighPivot ,bar_index[sPP], 0) // Short term Statics High
    STSLIc = ta.valuewhen(STSLowPivot ,bar_index[sPP], 0) // Short term Statics Low
    STSHVp = ta.valuewhen(STSHighPivot ,high[sPP], 1) // Short term Statics High
    STSLVp = ta.valuewhen(STSLowPivot ,low[sPP], 1) // Short term Statics Low
    STSHIp = ta.valuewhen(STSHighPivot ,bar_index[sPP], 1) // Short term Statics High
    STSLIp = ta.valuewhen(STSLowPivot ,bar_index[sPP], 1) // Short term Statics Low
    DTSHighPivot = ta.pivothigh(dPP,dPP) // Short term Dynamics High Pivot Price {True or False}
    DTSLowPivot = ta.pivotlow(dPP,dPP) // Short term Dynamics Low Pivot Price {True or False}
    DTSHVc = ta.valuewhen(DTSHighPivot ,high[dPP], 0) // Short term Dynamics High
    DTSLVc = ta.valuewhen(DTSLowPivot ,low[dPP], 0) // Short term Dynamics Low
    DTSHIc = ta.valuewhen(DTSHighPivot ,bar_index[dPP], 0) // Short term Dynamics High
    DTSLIc = ta.valuewhen(DTSLowPivot ,bar_index[dPP], 0) // Short term Dynamics Low
    DTSHVp = ta.valuewhen(DTSHighPivot ,high[dPP], 1) // Short term Dynamics High
    DTSLVp = ta.valuewhen(DTSLowPivot ,low[dPP], 1) // Short term Dynamics Low
    DTSHIp = ta.valuewhen(DTSHighPivot ,bar_index[dPP], 1) // Short term Dynamicss High
    DTSLIp = ta.valuewhen(DTSLowPivot ,bar_index[dPP], 1) // Short term Dynamics Low
    var line sHLL = na
    var line sLLL = na
    var label sHLLl = na
    var label sLLLl = na
    var line dHLL = na
    var line dLLL = na
    var label dHLLl = na
    var label dLLLl= na
    //STATICS/////////////////////////////////////////////////////////////////////////
    if STSHIc != STSHIc[1] and STSHVc <= STSHVp and (STSHIc - STSHIp) >= 8 and ShowHLLs
        if math.abs((STSHVp - STSHVc) / ATR[sPP]) <= SRs
            sHLL := line.new(x1 = STSHIp , y1 = STSHVp  , x2 =  STSHIc , y2 = STSHVp , color = color.rgb(0, 255, 13, 45) , style = line.style_solid)
            sHLLl := label.new(x = math.round((STSHIp+STSHIc)/2) , y = STSHVp - (ATR/2), text = 'Liq(D)' , color = color.rgb(255, 255, 255, 100) ,
                 textcolor = color.rgb(18, 184, 179) , style = label.style_label_down , size = size.small)
    if STSLIc != STSLIc[1] and STSLVc >= STSLVp and (STSLIc - STSLIp) >= 8 and ShowLLLs
        if math.abs((STSLVp - STSLVc) / ATR[sPP]) <= SRs
            sLLL := line.new(x1 = STSLIp , y1 =STSLVp  , x2 =  STSLIc , y2 = STSLVp , color = color.rgb(255, 0, 0, 45), style = line.style_solid)
            sLLLl := label.new(x = math.round((STSLIp+STSLIc)/2) , y = STSLVp+ (ATR/2), text = 'Liq[D]' , color = color.rgb(255, 255, 255, 100) ,
             textcolor = color.rgb(162, 10, 233) , style = label.style_label_up , size = size.small)
    //DYNAMICS/////////////////////////////////////////////////////////////////////////
    if DTSHIc != DTSHIc[1] and DTSHVc <= DTSHVp and (DTSHIc - DTSHIp) >= 4 and ShowHLLd
        if math.abs((DTSHVp - DTSHVc) / ATR[dPP]) >= SRd and math.abs((DTSHVp - DTSHVc) / ATR[dPP]) <= 1.95
            dHLL := line.new(x1 = DTSHIp , y1 = DTSHVp  , x2 =  DTSHIc , y2 = DTSHVc , color = color.rgb(18, 123, 184, 45) , style = line.style_solid)
            dHLLl := label.new(x = math.round((DTSHIp+DTSHIc)/2)+2 , y = (DTSHVp + DTSHVc) / 2  - (ATR/4), text = 'LiqD' , color = color.rgb(255, 255, 255, 100) ,
                 textcolor = color.rgb(18, 184, 179) , style = label.style_label_down , size = size.small)

    if DTSLIc != DTSLIc[1] and DTSLVc >= DTSLVp and (DTSLIc - DTSLIp) >= 4 and ShowLLLd
        if math.abs((DTSLVp - DTSLVc) / ATR[dPP]) >= SRd and math.abs((DTSLVp - DTSLVc) / ATR[dPP]) <= 1.95
            dLLL := line.new(x1 = DTSLIp , y1 =DTSLVp  , x2 =  DTSLIc , y2 = DTSLVc , color = color.rgb(162, 10, 233, 45), style = line.style_solid)
            dLLLl := label.new(x = math.round((DTSLIp+DTSLIc)/2)+2 , y = (DTSLVp + DTSLVp) / 2 + (ATR/4) , text = 'LiqD' , color = color.rgb(255, 255, 255, 100) ,
             textcolor = color.rgb(162, 10, 233) , style = label.style_label_up , size = size.small)

    if math.abs(line.get_x2(sHLL[1]) - line.get_x1(sHLL)) <= 2
        line.delete(sHLL)
        label.delete(sHLLl[1])
        line.set_x2(sHLL[1] ,STSHIc)
        label.set_text(sHLLl,'3 Top Liq')
        label.set_x(sHLLl, math.abs( (line.get_x1(sHLL[1]) + line.get_x2(sHLL[1])) / 2 ) )

    if math.abs(line.get_x2(sLLL[1]) - line.get_x1(sLLL)) <= 2
        line.delete(sLLL)
        label.delete(sLLLl[1])
        line.set_x2(sLLL[1] ,STSLIc)
        label.set_text(sLLLl,'3 Top Liq')
        label.set_x(sLLLl, math.abs( (line.get_x1(sLLL[1]) + line.get_x2(sLLL[1])) / 2 ) )

    if math.abs(line.get_x2(dHLL[1]) - line.get_x1(dHLL)) <= dPP*2 + 1
        line.delete(dHLL)
        label.delete(dHLLl[1])
        line.set_xy2(dHLL[1] ,DTSHIc , DTSHVc)
        label.set_xy(dHLLl, math.abs( ((line.get_x1(dHLL[1]) + line.get_x2(dHLL[1])) / 2)+2 ) , (line.get_y1(dHLL[1]) + line.get_y2(dHLL[1])) / 2 )

    if math.abs(line.get_x2(dLLL[1]) - line.get_x1(dLLL))  <= dPP*2 + 1
        line.delete(dLLL)
        label.delete(dLLLl[1])
        line.set_xy2(dLLL[1] ,DTSLIc , DTSLVc)
        label.set_xy(dLLLl, math.abs( ((line.get_x1(dLLL[1]) + line.get_x2(dLLL[1])) / 2)+2) , (line.get_y1(dLLL[1]) + line.get_y2(dLLL[1])) / 2 )


//Call function

LLF(SPP,DPP,SLLS,DLLS,ShowSHLL,ShowSLLL,ShowDHLL,ShowDLLL)
//

// A.I. Liquidation Heatmap Alpha
dMi = "[HD] A.I. Liquidation Heatmap Alpha\n" +
         "[Normal] Alpha liquidation levels not HD"

string dM = input.string("HD"    , "Mode     ", options = ["Normal", "HD"]         , group = "Display", inline = "z", tooltip = dMi)
string dS   = input.string("Both", ""         , options = ["Both", "Long", "Short"], group = "Display", inline = "z")

int   LV = input.int  (100       , "Leverage", group = "Display", inline = "1", minval = 25, maxval = 1000)
color lC = input.color(color.rgb(0, 255, 110, 65) , ""        , group = "Display", inline = "1")
color sC = input.color(color.rgb(195, 0, 255, 65) , ""        , group = "Display", inline = "1")
color pC = input.color(color.rgb(246, 255, 0, 65) , ""        , group = "Display", inline = "1")

bool lB = input.bool(true, "Display Liquidation Bubbles", group = "Display")
bool lL = input.bool(true, "Display Liquidation Levels ", group = "Display")

// A.I. Liquidation Heatmap Omega
rpTT  = 'Omega Liquidation Levels are estimates of potential price levels where liquidation events may occur\n' +
         ' - The reference price option defines the base price in calculating liquidation price levels'
refPL = input.string("open", "Reference Price", options = ["open", "close", "oc2", "hl2", "hlc3", "ohlc4", "hlcc4"], tooltip = rpTT)
vlTT  = 'Omega Liquidation data is closely tied in with trading volumes in the market and the movement in the underlying asset’s price\n' +
         ' -  The volume threshold option is the primary factor in detecting the significant trading activities that could potentially lead to liquidating leveraged positions\n' +
         ' -  The volatility threshold option (below) is the secondary factor that aims at detecting significant movement in the underlying asset’s price with relatively lower trading activities that could potentially also lead to liquidating high-leveraged positions'
vbHT  = input.float(1.8, 'Volume Threshold', minval = 1., step = .1, tooltip = vlTT)
lqTH  = input.int(9, 'Volatility Threshold', minval = 0, step = 5)

lqL1  = input.bool(true, 'Leverage', inline = 'L1')
lgL1V = input.int(50, '', minval = 1, inline = 'L1')
lqL1L = input.color(color.rgb(195, 0, 255, 80), '', inline = 'L1')
lqL1S = input.color(color.rgb(0, 255, 110, 80), '', inline = 'L1')

lqL2  = input.bool(true, 'Leverage', inline = 'L2')
lgL2V = input.int(75, '', minval = 1, inline = 'L2')
lqL2L = input.color(color.rgb(195, 0, 255, 80), '', inline = 'L2')
lqL2S = input.color(color.rgb(0, 255, 110, 80), '', inline = 'L2')

lqL3  = input.bool(true, 'Leverage', inline = 'L3')
lgL3V = input.int(100, '', minval = 1, inline = 'L3')
lqL3L = input.color(color.rgb(195, 0, 255, 80), '', inline = 'L3')
lqL3S = input.color(color.rgb(0, 255, 110, 80), '', inline = 'L3')

lqBB  = input.bool(false, 'Hide Liquidation Bubbles')
lqLN  = input.bool(false, 'Hide Liquidation Levels')

// A.I. Liquidation Heatmap Sigma Heatmap
len = input.int   (6            , "Threshold             ", group = "SETTINGS", tooltip = "Adjust Buying / Selling Activity",  minval = 2)

shBl = input.int  (1            , "Buyers Activity       ", group = "SETTINGS", inline = "a")
shBr = input.int  (1            , "Sellers Activity      ", group = "SETTINGS", inline = "b")

bull = input.color(color.rgb(0, 255, 110, 65), "                      ", group = "SETTINGS", inline = "a")
bear = input.color(color.rgb(195, 0, 255, 65) , "                      ", group = "SETTINGS", inline = "b")

dpBL = input.bool (true         , "                      ", group = "SETTINGS", inline = "a")
dpBR = input.bool (true         , "                      ", group = "SETTINGS", inline = "b")

dpL  = input.bool (false        , "Display Lines         ", group = "DISPLAY")
dpB  = input.bool (true         , "Display Bubbles       ", group = "DISPLAY")

dpH  = input.bool (true         , "Display Huge Bubbles  ", group = "GROUP  ")
dpG  = input.bool (true         , "Display Large Bubbles ", group = "GROUP  ")
dpN  = input.bool (true         , "Display Normal Bubbles", group = "GROUP  ")
dpS  = input.bool (true         , "Display Small Bubbles ", group = "GROUP  ")
dpT  = input.bool (true         , "Display Tiny Bubbles  ", group = "GROUP  ")

type bar
    float o = open
    float h = high
    float l = low
    float c = close
    float v = volume
    int   n = bar_index
    int   t = time


type bin
    line [] l
    float[] v


bar j = bar.new(), b = bar.new()

    //j =
var bin bb = bin.new(
       array.new<line >(     )
     , array.new<float>(1, na)
     )

float sma = ta.sma(j.v, 14)

method gC(color css) =>
    color.from_gradient(
           bb.v.first()
         , bb.v.min  ()
         , bb.v.max  ()
         , color.rgb(180, 180, 80, 80)
         , css
         )


sV(bool fT) =>
    if bb.v.size() > 499
        bb.v.pop()

    if fT
        bb.v.unshift(
             dM == "HD"
                 ? j.v
                 : j.v - nz(j.v[1])
             )


method dL(line[] l, float pos, color css, int width) =>

    if l.size() > 499
        l.pop().delete()

    l.unshift(
         line.new(
               x1    = j.n
             , x2    = j.n
             , y1    = pos
             , y2    = pos
             , xloc  = xloc.bar_index
             , color = css.gC()
             , style = line.style_solid
             , width = width
              )
             )


method uL(line[] l) =>
    for ln in l
        x = ln.get_x2()
        y = ln.get_y1()
        if j.n - 1 == x - 1 and not (j.h > y and j.l < y)
            ln.set_x2(j.n + 1)


draw(int L, bool fT) =>
    sV(fT)
    switch
        lL and fT and j.c > j.o and (dS == "Both" or dS == "Long" ) =>
            bb.l.dL(
                   j.l * (1 - 1. / L)
                 , bb.v.first() ==    bb.v.max()
                     ? pC
                     : lC
                 , bb.v.first() ==    bb.v.max()
                     ? 3
                     : bb.v.first() > bb.v.avg()
                         ? 2
                         : 1
                 )
        lL and fT and j.c < j.o and (dS == "Both" or dS == "Short") =>
             bb.l.dL(
                   j.h * (1 + 1. / L)
                 , bb.v.first() ==    bb.v.max()
                     ? pC
                     : sC
                 , bb.v.first() ==    bb.v.max()
                     ? 3
                     : bb.v.first() > bb.v.avg()
                         ? 2
                         : 1
                 )
    bb.l.uL()


bool fT = j.v > sma

draw(LV, fT)

bool pV = bb.v.first() == bb.v.max()
     ? true
     : false
bool dL = (dS == "Both" or dS == "Long" ) and lB
bool dD = (dS == "Both" or dS == "Short") and lB


//
var aLQ = array.new_line()

nzV = nz(b.v)

// Lux Functions/methods @function   This function converts string to source @param _s   [string] source custom sting @returns    [float] source
f_gSRC(_s) =>
    switch _s
        "open"  => open
        "close" => close
        "hl2"   => hl2
        "oc2"   => math.avg(open, close)
        "hlc3"  => hlc3
        "ohlc4" => ohlc4
        "hlcc4" => hlcc4

//-----------------------------------------------------------------------------}
// Lux Calculations
//-----------------------------------------------------------------------------{
refP  = f_gSRC(refPL)
vbMA  = ta.sma(nzV, 13)
nzVd2 = nzV > vbMA * (2 + vbHT)
nzVd1 = nzV > vbMA * (1 + vbHT)
nzVd0 = nzV > vbMA * (0 + vbHT)

lT = (b.l != refP and refP / (refP - b.l) <= lqTH) or (b.h != refP and refP / (b.h - refP) <= lqTH)
eC = refP * (1 + 1. / 333) < b.h or refP * (1 - 1. / 333) > b.l

l1PL = refP * (1 + 1. / lgL1V)

// PLOT EVERYTHING HERE
plot(fT and dL and j.c > j.o                              ? j.l * (1 - 1. / LV) : na, color = pV ?                pC.gC() : color.new(lC, 80).gC(), linewidth = 3, style = plot.style_circles, title = "Bubbles", editable = false, display=labelDisplay)
plot(fT and dL and j.c > j.o and bb.v.first() > bb.v.avg()  ? j.l * (1 - 1. / LV) : na, color = pV ? color.new(pC, 80).gC() : color.new(lC, 80).gC(), linewidth = 6, style = plot.style_circles, title = "Bubbles", editable = false, display=labelDisplay)
plot(fT and dL and j.c > j.o and bb.v.first() == bb.v.max() ? j.l * (1 - 1. / LV) : na, color = pV ? color.new(pC, 80).gC() : color.new(lC, 80).gC(), linewidth = 9, style = plot.style_circles, title = "Bubbles", editable = false, display=labelDisplay)

plot(fT and dD and j.c < j.o                              ? j.h * (1 + 1. / LV) : na, color = pV ?                pC.gC() : color.new(sC, 80).gC(), linewidth = 3, style = plot.style_circles, title = "Bubbles", editable = false, display=labelDisplay)
plot(fT and dD and j.c < j.o and bb.v.first() > bb.v.avg()  ? j.h * (1 + 1. / LV) : na, color = pV ? color.new(pC, 80).gC() : color.new(sC, 80).gC(), linewidth = 6, style = plot.style_circles, title = "Bubbles", editable = false, display=labelDisplay)
plot(fT and dD and j.c < j.o and bb.v.first() == bb.v.max() ? j.h * (1 + 1. / LV) : na, color = pV ? color.new(pC, 80).gC() : color.new(sC, 80).gC(), linewidth = 9, style = plot.style_circles, title = "Bubbles", editable = false, display=labelDisplay)

plotshape(not lqBB and lqL1 and nzVd2 and eC ? l1PL : na, 'Bubbles', shape.circle, location.absolute, lqL1L, editable = false, size = size.small, editable = false, display=labelDisplay)
plotshape(not lqBB and lqL1 and nzVd1 and eC ? l1PL : na, 'Bubbles', shape.circle, location.absolute, lqL1L, editable = false, size = size.small, editable = false, display=labelDisplay)
plotshape(not lqBB and lqL1 and nzVd0 and eC ? l1PL : not lqBB and lqL1 and lT ? l1PL : na, 'Bubbles', shape.circle, location.absolute, lqL1L, size = size.tiny, editable = false, display=labelDisplay)

if not lqLN and lqL1 and (lT or nzVd0) and l1PL > b.h and eC
    aLQ.push(line.new(b.n, l1PL, b.n + 1, l1PL, color = lqL1L, width = nzVd2 ? 3 : nzVd1 ? 2 : 1))

l1PS = refP * (1 - 1. / lgL1V)
plotshape(not lqBB and lqL1 and nzVd0 and eC ? l1PS : not lqBB and lqL1 and lT ? l1PS : na, 'Bubbles', shape.circle, location.absolute, lqL1S, size = size.tiny, editable = false, display=labelDisplay)
plotshape(not lqBB and lqL1 and nzVd1 and eC ? l1PS : na, 'Bubbles', shape.circle, location.absolute, lqL1S, size = size.small, editable = false, display=labelDisplay)
plotshape(not lqBB and lqL1 and nzVd2 and eC ? l1PS : na, 'Bubbles', shape.circle, location.absolute, lqL1S, size = size.small, editable = false, display=labelDisplay)

if not lqLN and lqL1 and (lT or nzVd0) and l1PS < b.l and eC
    aLQ.push(line.new(b.n, l1PS, b.n + 1, l1PS, color = lqL1S, width = nzVd2 ? 3 : nzVd1 ? 2 : 1))

l2PL = refP * (1 + 1. / lgL2V)
plotshape(not lqBB and lqL2 and nzVd2 and eC ? l2PL : na, 'Bubbles', shape.circle, location.absolute, lqL2L, size = size.small, editable = false, display=labelDisplay)
plotshape(not lqBB and lqL2 and nzVd1 and eC ? l2PL : na, 'Bubbles', shape.circle, location.absolute, lqL2L, size = size.small, editable = false, display=labelDisplay)
plotshape(not lqBB and lqL2 and nzVd0 and eC ? l2PL : not lqBB and lqL2 and lT ? l2PL : na, 'Bubbles', shape.circle, location.absolute, lqL2L, size = size.tiny, editable = false, display=labelDisplay)

if not lqLN and lqL2 and (lT or nzVd0) and l2PL > b.h and eC
    aLQ.push(line.new(b.n, l2PL, b.n + 1, l2PL, color = lqL2L, width = nzVd2 ? 3 : nzVd1 ? 2 : 1))

l2PS = refP * (1 - 1. / lgL2V)
plotshape(not lqBB and lqL2 and nzVd0 and eC ? l2PS : not lqBB and lqL2 and lT ? l2PS : na, 'Bubbles', shape.circle, location.absolute, lqL2S, size = size.tiny, editable = false, display=labelDisplay)
plotshape(not lqBB and lqL2 and nzVd1 and eC ? l2PS : na, 'Bubbles', shape.circle, location.absolute, lqL2S, size = size.small, editable = false, display=labelDisplay)
plotshape(not lqBB and lqL2 and nzVd2 and eC ? l2PS : na, 'Bubbles', shape.circle, location.absolute, lqL2S, size = size.normal, editable = false, display=labelDisplay)

if not lqLN and lqL2 and (lT or nzVd0) and l2PS < b.l and eC
    aLQ.push(line.new(b.n, l2PS, b.n + 1, l2PS, color = lqL2S, width = nzVd2 ? 3 : nzVd1 ? 2 : 1))

l3PL = refP * (1 + 1. / lgL3V)
plotshape(not lqBB and lqL3 and nzVd2 and eC ? l3PL : na, 'Bubbles', shape.circle, location.absolute, lqL3L, size = size.normal, editable = false, display=labelDisplay)
plotshape(not lqBB and lqL3 and nzVd1 and eC ? l3PL : na, 'Bubbles', shape.circle, location.absolute, lqL3L, size = size.small, editable = false, display=labelDisplay)
plotshape(not lqBB and lqL3 and nzVd0 and eC ? l3PL : not lqBB and lqL3 and lT ? l3PL : na, 'Bubbles', shape.circle, location.absolute, lqL3L, size = size.tiny, editable = false, display=labelDisplay)

if not lqLN and lqL3 and (lT or nzVd0) and l3PL > b.h and eC
    aLQ.push(line.new(b.n, l3PL, b.n + 1, l3PL, color = lqL3L, width = nzVd2 ? 3 : nzVd1 ? 2 : 1))

l3PS = refP * (1 - 1. / lgL3V)
plotshape(not lqBB and lqL3 and nzVd0 and eC ? l3PS : not lqBB and lqL3 and lT ? l3PS : na, 'Bubbles', shape.circle, location.absolute, lqL3S, size = size.tiny, editable = false, display=labelDisplay)
plotshape(not lqBB and lqL3 and nzVd1 and eC ? l3PS : na, 'Bubbles', shape.circle, location.absolute, lqL3S, size = size.small, editable = false, display=labelDisplay)
plotshape(not lqBB and lqL3 and nzVd2 and eC ? l3PS : na, 'Bubbles', shape.circle, location.absolute, lqL3S, size = size.normal, editable = false, display=labelDisplay)

if not lqLN and lqL3 and (lT or nzVd0) and l3PS < b.l and eC
    aLQ.push(line.new(b.n, l3PS, b.n + 1, l3PS, color = lqL3S, width = nzVd2 ? 3 : nzVd1 ? 2 : 1))

if aLQ.size() > 0
    qt = aLQ.size()

    for ln = qt - 1 to 0
        if ln < aLQ.size()
            cL = aLQ.get(ln)
            yL = cL.get_y1()
            if b.h > yL and b.l < yL
                aLQ.remove(ln)
            else
                cL.set_x2(b.n + 1)

    if aLQ.size() > 500
        aLQ.shift().delete()

//

type maps
    float vol
    float pos
    int   loc
    int   spc

var maps[] blM = array.new<maps>(1, maps.new(0, na, na))
var maps[] brM = array.new<maps>(1, maps.new(0, na, na))

bar zb = bar.new()

zlema = ta.ema(volume, len)
f1  = volume > sma * 2.12
f2  = volume > sma * 1.88
f3  = volume > sma * 1.66
f4  = volume > sma * 1.33
f5  = volume > sma * 0.99

blV = blM.get(0)
brV = brM.get(0)

blV.vol := dpBL ? 0 : 1
brV.vol := dpBR ? 0 : 1

if barstate.isconfirmed


    for i = 0 to len - 1
        blV.vol += (zb.c[i] > zb.c[i + 1] ? zb.v[i] : 0)
        brV.vol += (zb.c[i] < zb.c[i + 1] ? zb.v[i] : 0)

    switch
        blV.vol == 0 and f1 and dpH => blM.unshift(maps.new(0, zb.c, zb.t, 5))
        blV.vol == 0 and f2 and dpG => blM.unshift(maps.new(0, zb.c, zb.t, 4))
        blV.vol == 0 and f3 and dpN => blM.unshift(maps.new(0, zb.c, zb.t, 3))
        blV.vol == 0 and f4 and dpS => blM.unshift(maps.new(0, zb.c, zb.t, 2))
        blV.vol == 0 and f5 and dpT => blM.unshift(maps.new(0, zb.c, zb.t, 1))

    switch
        brV.vol == 0 and f1 and dpH => brM.unshift(maps.new(0, zb.c, zb.t, 5))
        brV.vol == 0 and f2 and dpG => brM.unshift(maps.new(0, zb.c, zb.t, 4))
        brV.vol == 0 and f3 and dpN => brM.unshift(maps.new(0, zb.c, zb.t, 3))
        brV.vol == 0 and f4 and dpS => brM.unshift(maps.new(0, zb.c, zb.t, 2))
        brV.vol == 0 and f5 and dpT => brM.unshift(maps.new(0, zb.c, zb.t, 1))


if barstate.islast

    for ln in line.all
        ln.delete()

    if shBl > 0 and blM.size() > 0 and dpL
        for i = 0 to math.min(shBl - 1, blM.size() - 1)
            ln = blM.get(i)

            line.new(
                   x1     = ln.loc
                 , x2     = zb.t + 1
                 , y1     = ln.pos
                 , y2     = ln.pos
                 , xloc   = xloc.bar_time
                 , extend = extend.right
                 , color  = bull
                 , width  = ln.spc
                 )

    if shBr > 0 and brM.size() > 0 and dpL
        for i = 0 to math.min(shBr - 1, brM.size() - 1)
            ln = brM.get(i)

            line.new(
                   x1     = ln.loc
                 , x2     = zb.t + 1
                 , y1     = ln.pos
                 , y2     = ln.pos
                 , xloc   = xloc.bar_time
                 , extend = extend.right
                 , color  = bear
                 , width  = ln.spc
                 )


plotshape(blV.vol == 0 and f1 and dpB and dpH ? close : na, style = shape.circle, location = location.absolute, size = size.large, editable = false, color = color.new(bull, 90))
plotshape(blV.vol == 0 and f2 and dpB and dpG ? close : na, style = shape.circle, location = location.absolute, size = size.normal, editable = false, color = color.new(bull, 80))
plotshape(blV.vol == 0 and f3 and dpB and dpN ? close : na, style = shape.circle, location = location.absolute, size = size.small, editable = false, color = color.new(bull, 80))
plotshape(blV.vol == 0 and f4 and dpB and dpS ? close : na, style = shape.circle, location = location.absolute, size = size.tiny , editable = false, color = color.new(bull, 80))

plotshape(brV.vol == 0 and f1 and dpB and dpH ? close : na, style = shape.circle, location = location.absolute, size = size.large, editable = false, color = color.new(bear, 90))
plotshape(brV.vol == 0 and f2 and dpB and dpG ? close : na, style = shape.circle, location = location.absolute, size = size.normal, editable = false, color = color.new(bear, 80))
plotshape(brV.vol == 0 and f3 and dpB and dpN ? close : na, style = shape.circle, location = location.absolute, size = size.small, editable = false, color = color.new(bear, 80))
plotshape(brV.vol == 0 and f4 and dpB and dpS ? close : na, style = shape.circle, location = location.absolute, size = size.tiny , editable = false, color = color.new(bear, 80))
//

// Fibonacci Price Index {
Tip = input.bool(title="Tesla Length", defval=true, group = "Prediction Channel", tooltip='It represents the number of bars back from the current timeframe on the chart.')

// Input parameters
FibL = input.int(900, title="Tesla Lookback")
len1 = 44
len2 = false

// Function to calculate the Fibonacci retracement levels
fib_retracement(source, length) =>
    highValue = ta.highest(source, length)
    lowValue = ta.lowest(source, length)
    avgFib = highValue - lowValue

    r1 = highValue
    r2 = highValue - 0.163 * avgFib
    r3 = highValue - 0.333 * avgFib
    r4 = highValue - 0.432 * avgFib
    r5 = highValue - 0.639 * avgFib
    r6 = highValue - 0.963 * avgFib
    s1 = lowValue
    s2 = lowValue + 0.163 * avgFib
    s3 = lowValue + 0.333 * avgFib
    s4 = lowValue + 0.432 * avgFib
    s5 = lowValue + 0.639 * avgFib
    s6 = lowValue + 0.963 * avgFib

    [r1, r2, r3, r4, r5, r6, s1, s2, s3, s4, s5, s6]

// Function to create or update labels
f_create_or_update_label(fib_labels, last_label_bar_index, bar_index, idx, level, text_label, label_spacing) =>
    if (bar_index - array.get(last_label_bar_index, idx) >= label_spacing or na(array.get(last_label_bar_index, idx)))
        if na(array.get(fib_labels, idx))
            array.set(fib_labels, idx, label.new(bar_index, level, text=text_label, style=label.style_label_left, color=color.rgb(0, 0, 0, 73), textcolor=color.rgb(255, 255, 0, 44)))
        else
            label.set_xy(array.get(fib_labels, idx), bar_index, level)
            label.set_text(array.get(fib_labels, idx), text_label)
        array.set(last_label_bar_index, idx, bar_index)

// Function to plot the Fibonacci retracement levels
plot_fib_retracement_local(source, length, offset, show_last) =>
    [r1, r2, r3, r4, r5, r6, s1, s2, s3, s4, s5, s6] = fib_retracement(source, length)
    var label[] fib_labels = array.new_label(12, na)
    var int[] last_label_bar_index = array.new_int(12, na)
    int label_spacing = 1 // The number of bars between labels

    // Call the label creation/updating function for each Fibonacci level
    // Call the label creation/updating function for each Fibonacci level
    f_create_or_update_label(fib_labels, last_label_bar_index, bar_index, 0, r1, "" + str.tostring(r1), label_spacing)
    f_create_or_update_label(fib_labels, last_label_bar_index, bar_index, 1, r2, "  (0.163%) " + str.tostring(r2), label_spacing)
    f_create_or_update_label(fib_labels, last_label_bar_index, bar_index, 2, r3, "  (0.333%) " + str.tostring(r3), label_spacing)
    f_create_or_update_label(fib_labels, last_label_bar_index, bar_index, 3, r4, "  (0.432%) " + str.tostring(r4), label_spacing)
    f_create_or_update_label(fib_labels, last_label_bar_index, bar_index, 4, r5, "  (0.636%) " + str.tostring(r5), label_spacing)
    f_create_or_update_label(fib_labels, last_label_bar_index, bar_index, 5, r6, "  (0.963%) " + str.tostring(r6), label_spacing)
    f_create_or_update_label(fib_labels, last_label_bar_index, bar_index, 6, s1, "" + str.tostring(s1), label_spacing)
    f_create_or_update_label(fib_labels, last_label_bar_index, bar_index, 7, s2, "  (0.163%) " + str.tostring(s2), label_spacing)
    f_create_or_update_label(fib_labels, last_label_bar_index, bar_index, 8, s3, "  (0.333%) " + str.tostring(s3), label_spacing)
    f_create_or_update_label(fib_labels, last_label_bar_index, bar_index, 9, s4, "  (0.432%) " + str.tostring(s4), label_spacing)
    f_create_or_update_label(fib_labels, last_label_bar_index, bar_index, 10, s5,"  (0.639%) " + str.tostring(s5), label_spacing)
    f_create_or_update_label(fib_labels, last_label_bar_index, bar_index, 11, s6,"  (0.963%) " + str.tostring(s6), label_spacing)

//////////////////////////////

    // Draw Fibonacci lines
    line.new(bar_index - length, r1, bar_index, r1, width=1, color=color.rgb(140, 0, 255, 80),style = line.style_solid)
    line.new(bar_index - length, r1, bar_index, r2, width=1, color=color.rgb(140, 0, 255, 80),style = line.style_solid)
    line.new(bar_index - length, r1, bar_index, r3, width=1, color=color.rgb(140, 0, 255, 80),style = line.style_solid)
    line.new(bar_index - length, r1, bar_index, r4, width=1, color=color.rgb(140, 0, 255, 80),style = line.style_solid)
    line.new(bar_index - length, r1, bar_index, r5, width=1, color=color.rgb(140, 0, 255, 80),style = line.style_solid)
    line.new(bar_index - length, r1, bar_index, r6, width=1, color=color.rgb(140, 0, 255, 80),style = line.style_solid)

    // ... Repeat for other levels ...
     // Draw Fibonacci lines
    line.new(bar_index - length, s1, bar_index, s1, width=1, color=color.rgb(0, 255, 170, 80),style = line.style_solid)
    line.new(bar_index - length, s1, bar_index, s2, width=1, color=color.rgb(0, 255, 170, 80),style = line.style_solid)
    line.new(bar_index - length, s1, bar_index, s3, width=1, color=color.rgb(0, 255, 170, 80),style = line.style_solid)
    line.new(bar_index - length, s1, bar_index, s4, width=1, color=color.rgb(0, 255, 170, 80),style = line.style_solid)
    line.new(bar_index - length, s1, bar_index, s5, width=1, color=color.rgb(0, 255, 170, 80),style = line.style_solid)
    line.new(bar_index - length, s1, bar_index, s6, width=1, color=color.rgb(0, 255, 170, 80),style = line.style_solid)

plot_fib_retracement_local(close, FibL, len1, false)


// Function to plot the Fibonacci retracement levels towards the left
plot_fib_retracement_left(source, length, offset) =>
    [r1, r2, r3, r4, r5, r6, s1, s2, s3, s4, s5, s6] = fib_retracement(source, length)

    // Limit the length to 333 bars
    max_length = math.min(333, length)


// Function to plot the Fibonacci retracement levels towards the right
plot_fib_retracement_right(source, length, offset) =>
    [r1, r2, r3, r4, r5, r6, s1, s2, s3, s4, s5, s6] = fib_retracement(source, length)

    // Limit the length to 333 bars
    max_length = math.min(333, length)

    // Draw Fibonacci lines towards the right
    line.new(bar_index, r1, bar_index + max_length, r1, width=1, color=color.rgb(140, 0, 255, 90),style = line.style_solid)
    line.new(bar_index, r2, bar_index + max_length, r1, width=1, color=color.rgb(0, 255, 170, 90),style = line.style_solid)
    line.new(bar_index, r3, bar_index + max_length, r1, width=1, color=color.rgb(0, 255, 170, 90),style = line.style_solid)
    line.new(bar_index, r4, bar_index + max_length, r1, width=1, color=color.rgb(0, 255, 170, 90),style = line.style_solid)
    line.new(bar_index, r5, bar_index + max_length, r1, width=1, color=color.rgb(0, 255, 170, 90),style = line.style_solid)
    line.new(bar_index, r6, bar_index + max_length, r1, width=1, color=color.rgb(0, 255, 170, 90),style = line.style_solid)
    line.new(bar_index, s1, bar_index + max_length, s1, width=1, color=color.rgb(0, 255, 170, 90),style = line.style_solid)
    line.new(bar_index, s2, bar_index + max_length, s1, width=1, color=color.rgb(140, 0, 255, 90),style = line.style_solid)
    line.new(bar_index, s3, bar_index + max_length, s1, width=1, color=color.rgb(140, 0, 255, 90),style = line.style_solid)
    line.new(bar_index, s4, bar_index + max_length, s1, width=1, color=color.rgb(140, 0, 255, 90),style = line.style_solid)
    line.new(bar_index, s5, bar_index + max_length, s1, width=1, color=color.rgb(140, 0, 255, 90),style = line.style_solid)
    line.new(bar_index, s6, bar_index + max_length, s1, width=1, color=color.rgb(140, 0, 255, 90),style = line.style_solid)

// Plot Fibonacci retracement levels towards the left
plot_fib_retracement_left(close, FibL, len1)

// Plot Fibonacci retracement levels towards the right
plot_fib_retracement_right(close, FibL, len1)
//
How to Apply Pine Script in TradingView:
- Open TradingView and log in.
- Navigate to the Pine Script Editor at the bottom of the screen.
- Copy the provided Pine Script code.
- Click Save, then name the script (e.g., “LiqD 🫧 Liquidation Heatmap”).
- Click Add to Chart to apply it.
- Adjust settings according to your trading preferences.
Additional Trading Tips:
- Pair with Volume Indicators:
Combine the script with volume-based indicators like OBV or VWAP to confirm liquidity-driven movements. - Focus on Key Levels During High Volatility Sessions:
Liquidation events are most frequent during market openings and economic news releases—trade with caution. - Optimize Your Stop-Loss Placement:
Use the dynamic liquidity levels to place stops outside of high-liquidation areas to avoid unnecessary losses.
Final Thoughts:
The LiqD 🫧 Liquidation Heatmap SB[ɅI] is an indispensable tool for traders aiming to gain deeper insights into market liquidity and smart money activity. Whether you’re a short-term scalper or a long-term swing trader, this script equips you with the intelligence needed to make well-informed trading decisions.