All blog posts
Explore the world of design and learn how to create visually stunning artwork.
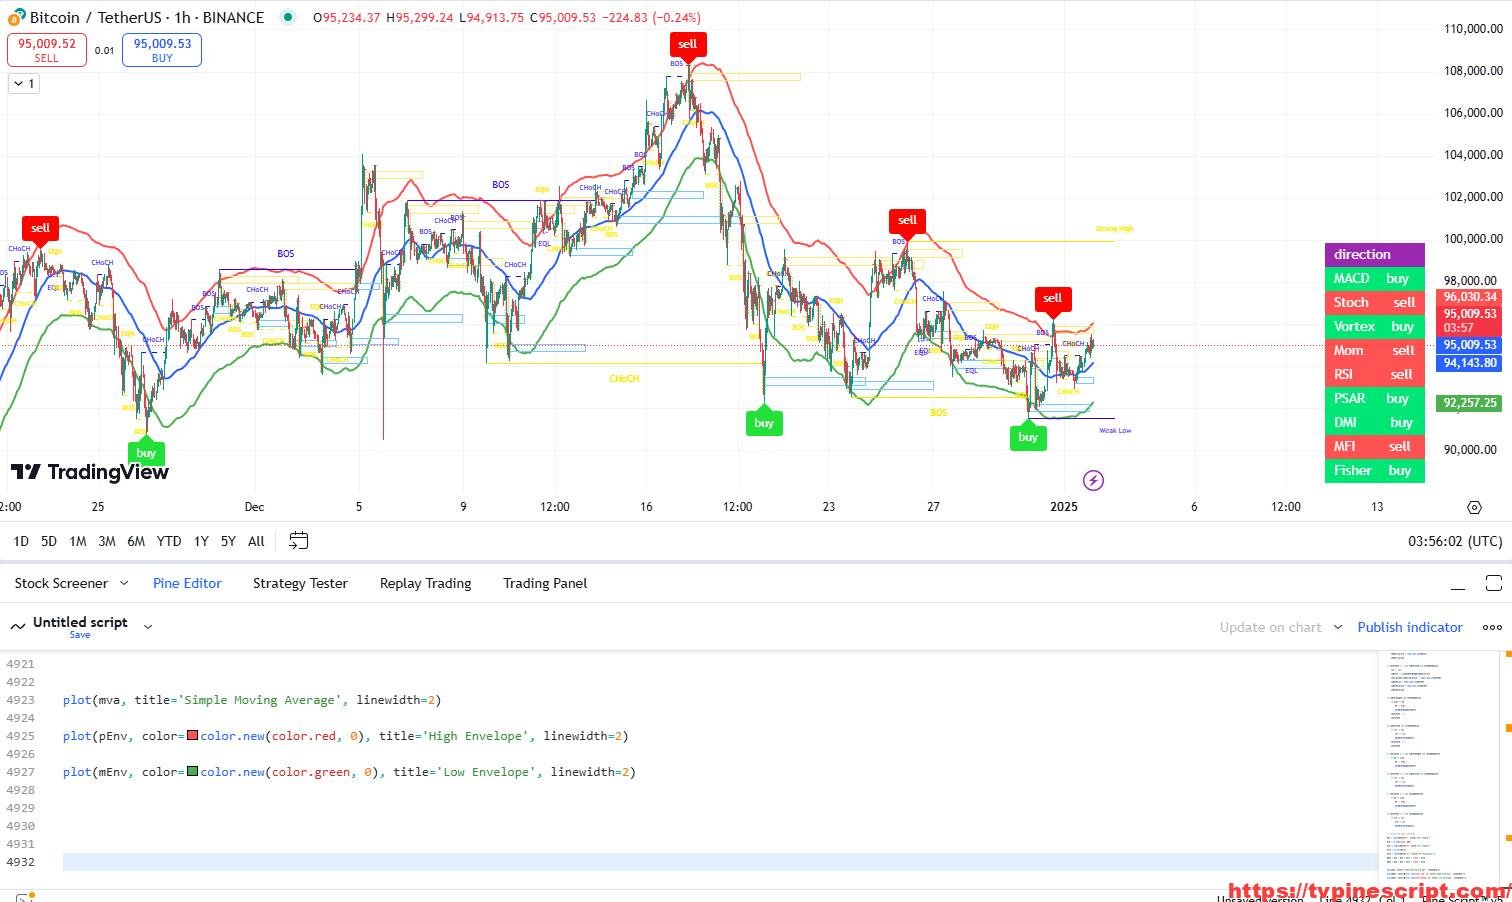
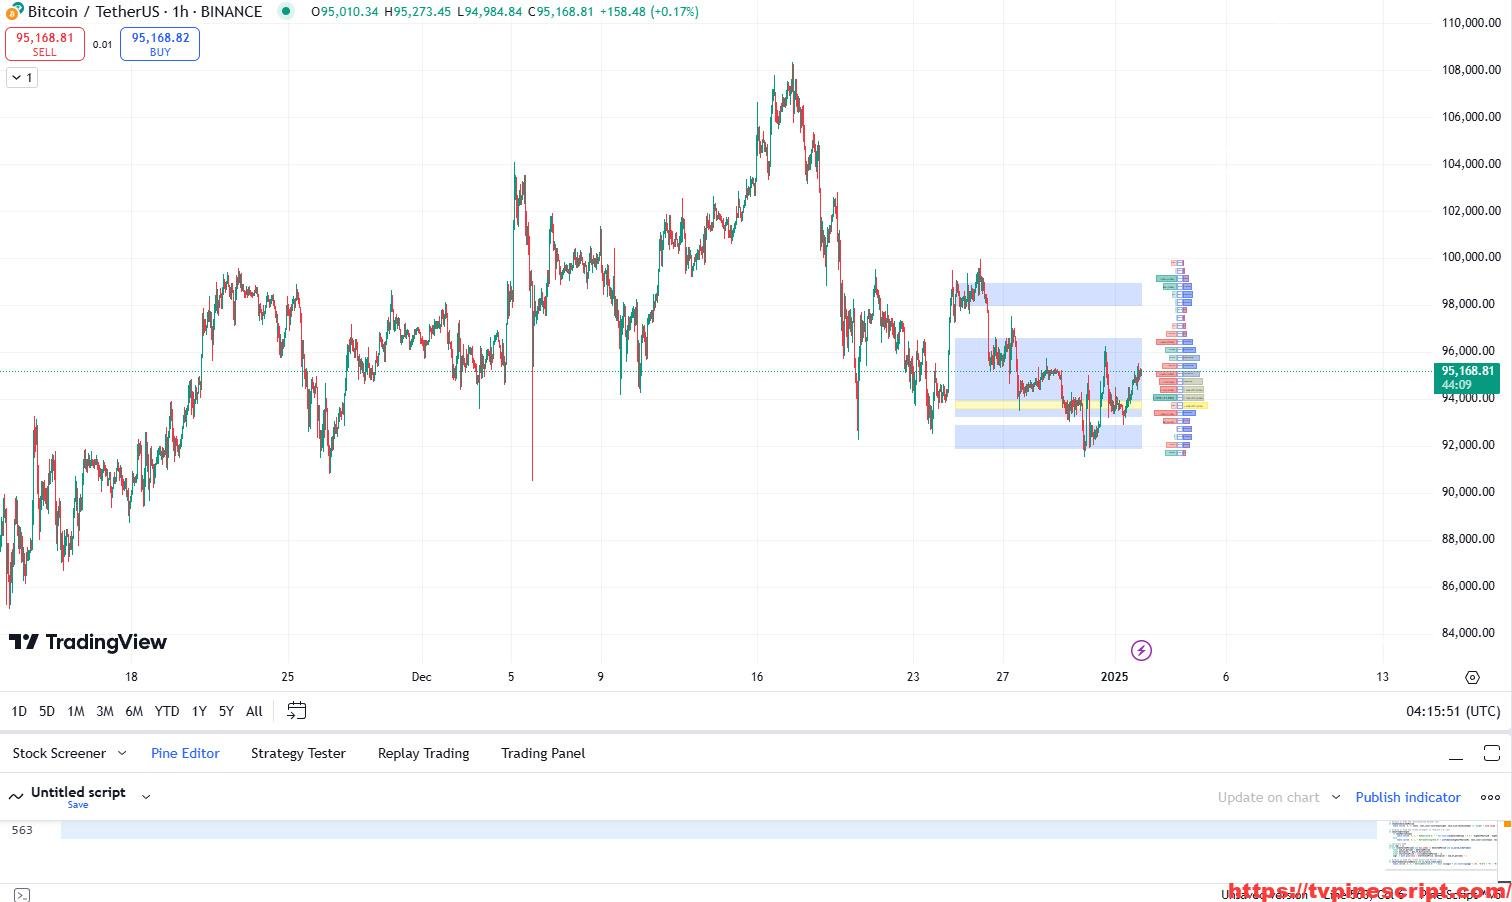
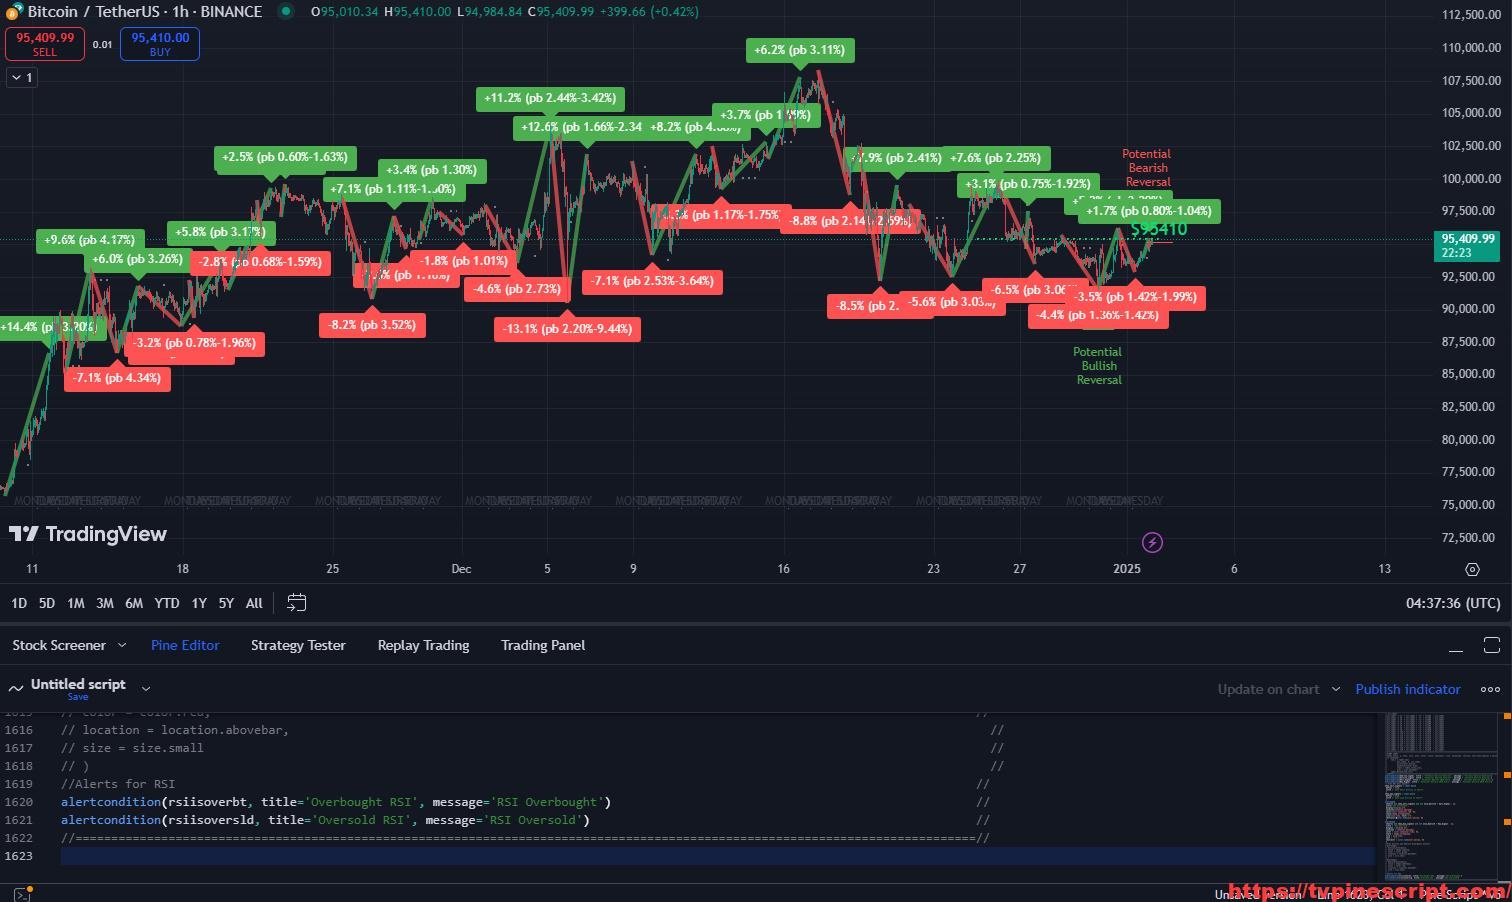
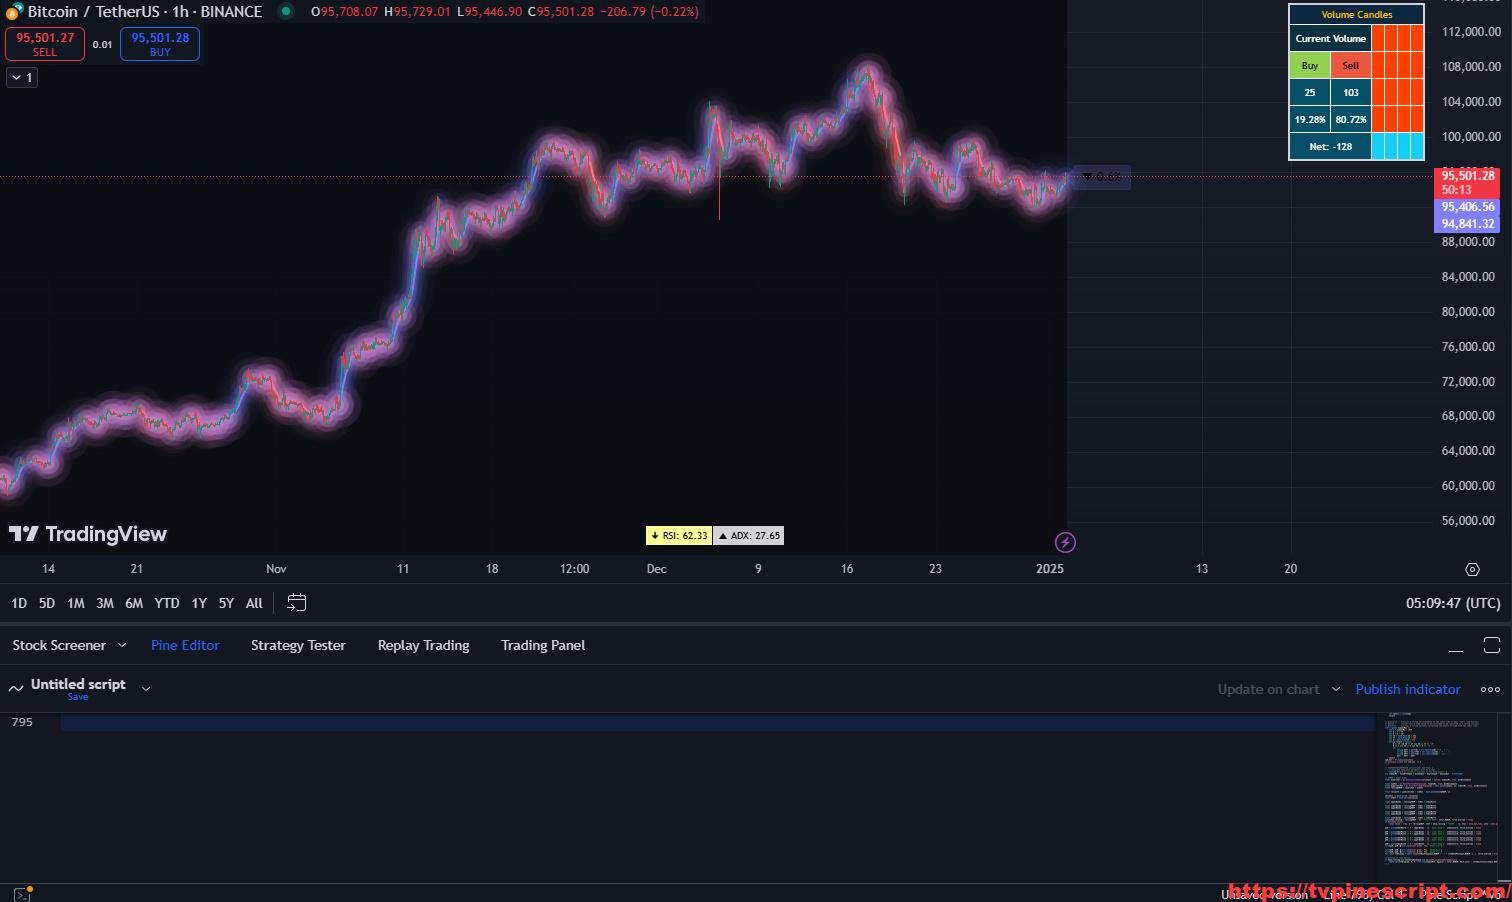
Scalping and Market Structure Analysis with Advanced Pine Script Indicators
January 3, 2025 | by admin
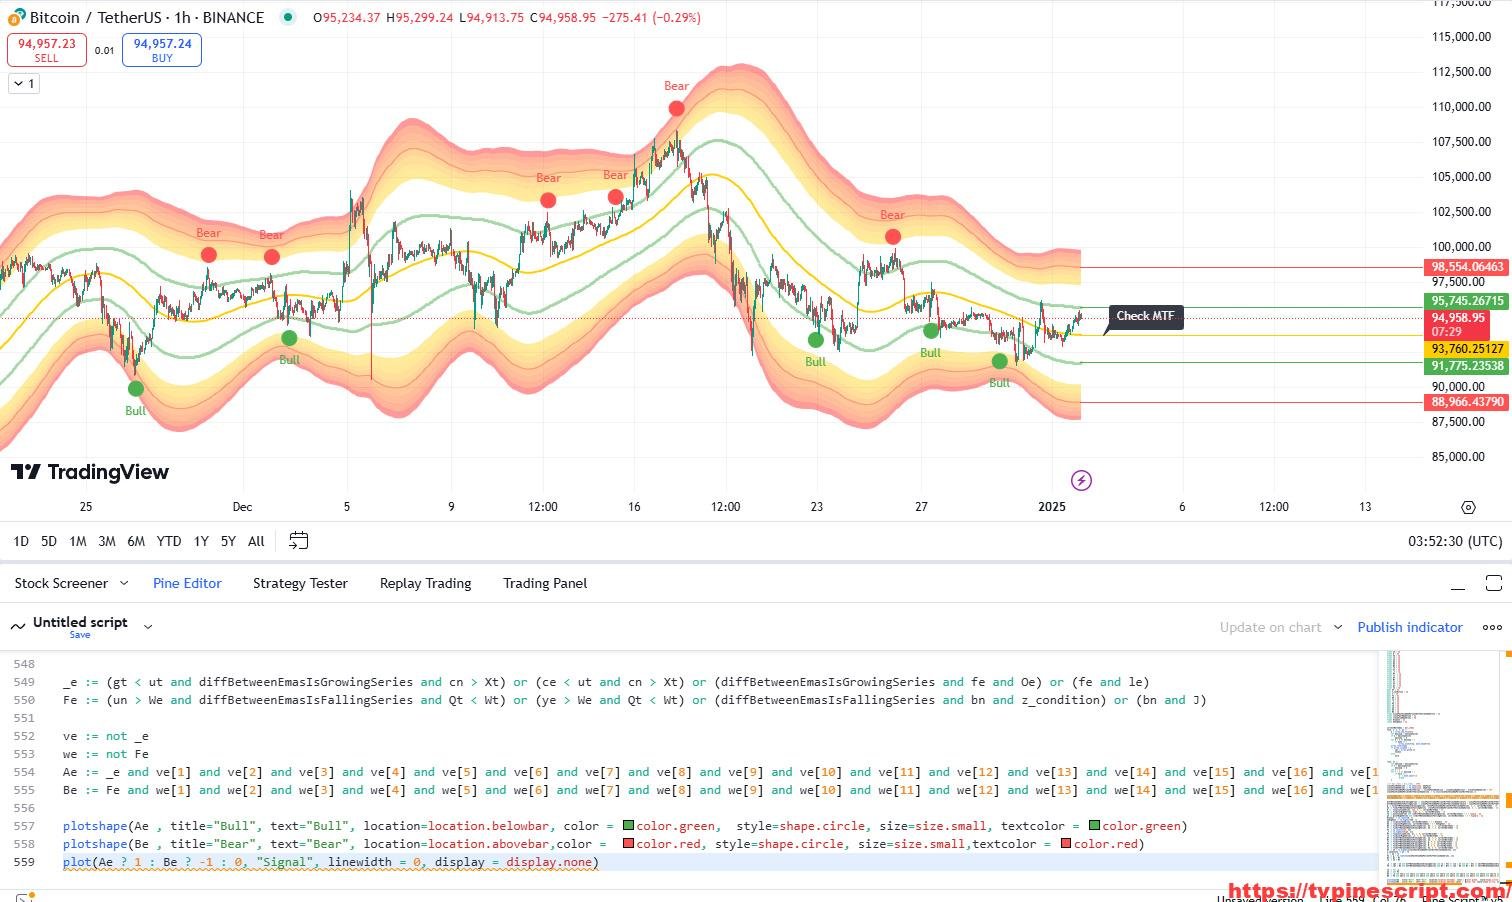
Revolutionize Trading with Mean Reversion Channel and Multi-Timeframe Analysis in Pine Script
January 3, 2025 | by admin
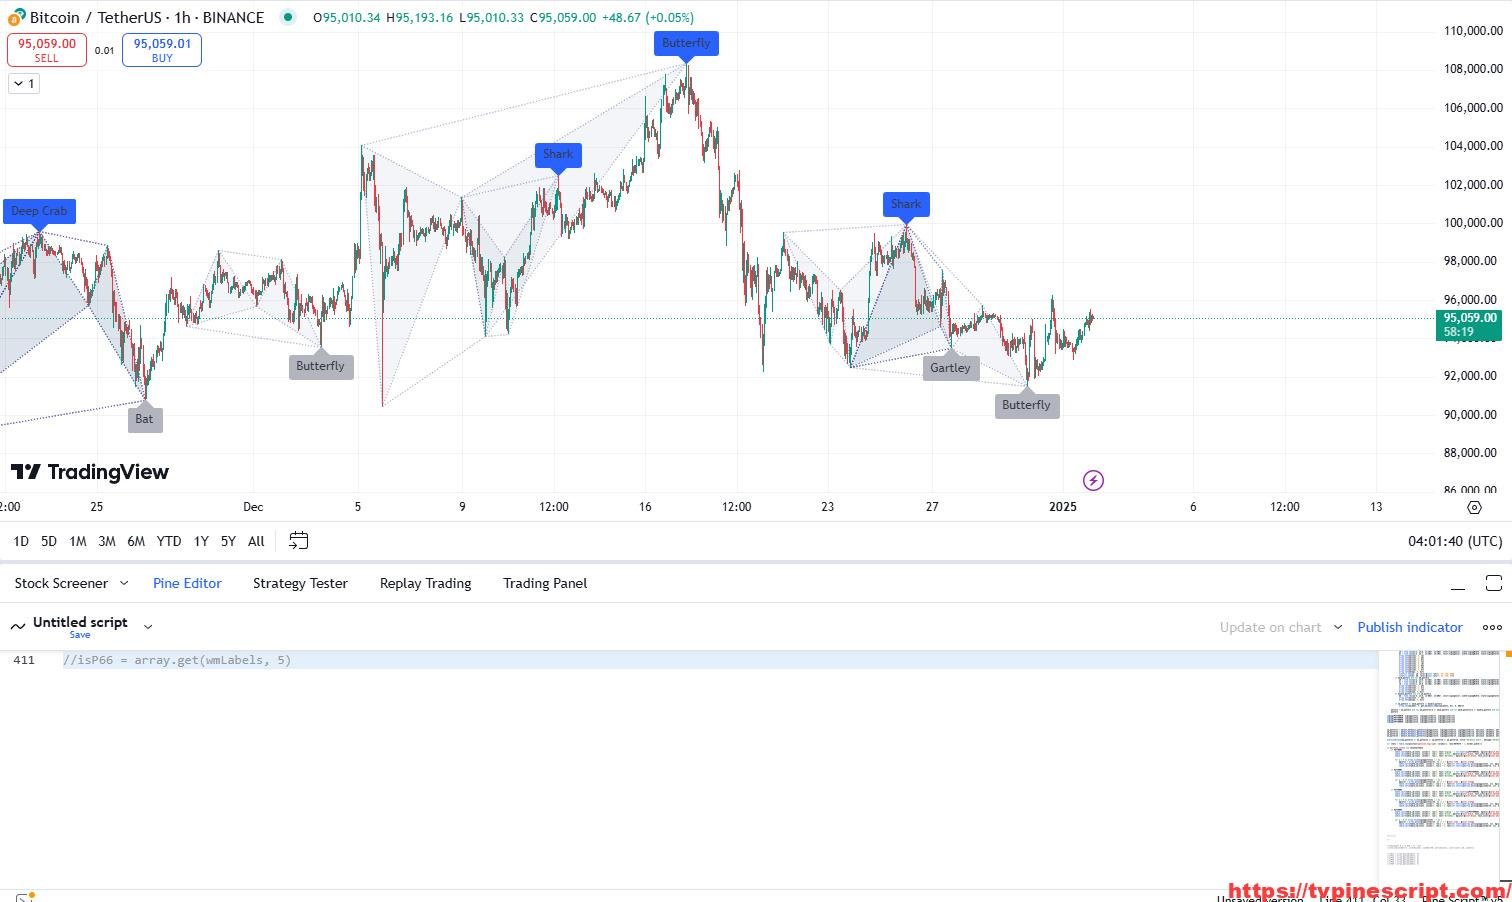
Unlock Precision in Trading with Harmonic Patterns Detection in Pine Script
January 3, 2025 | by admin
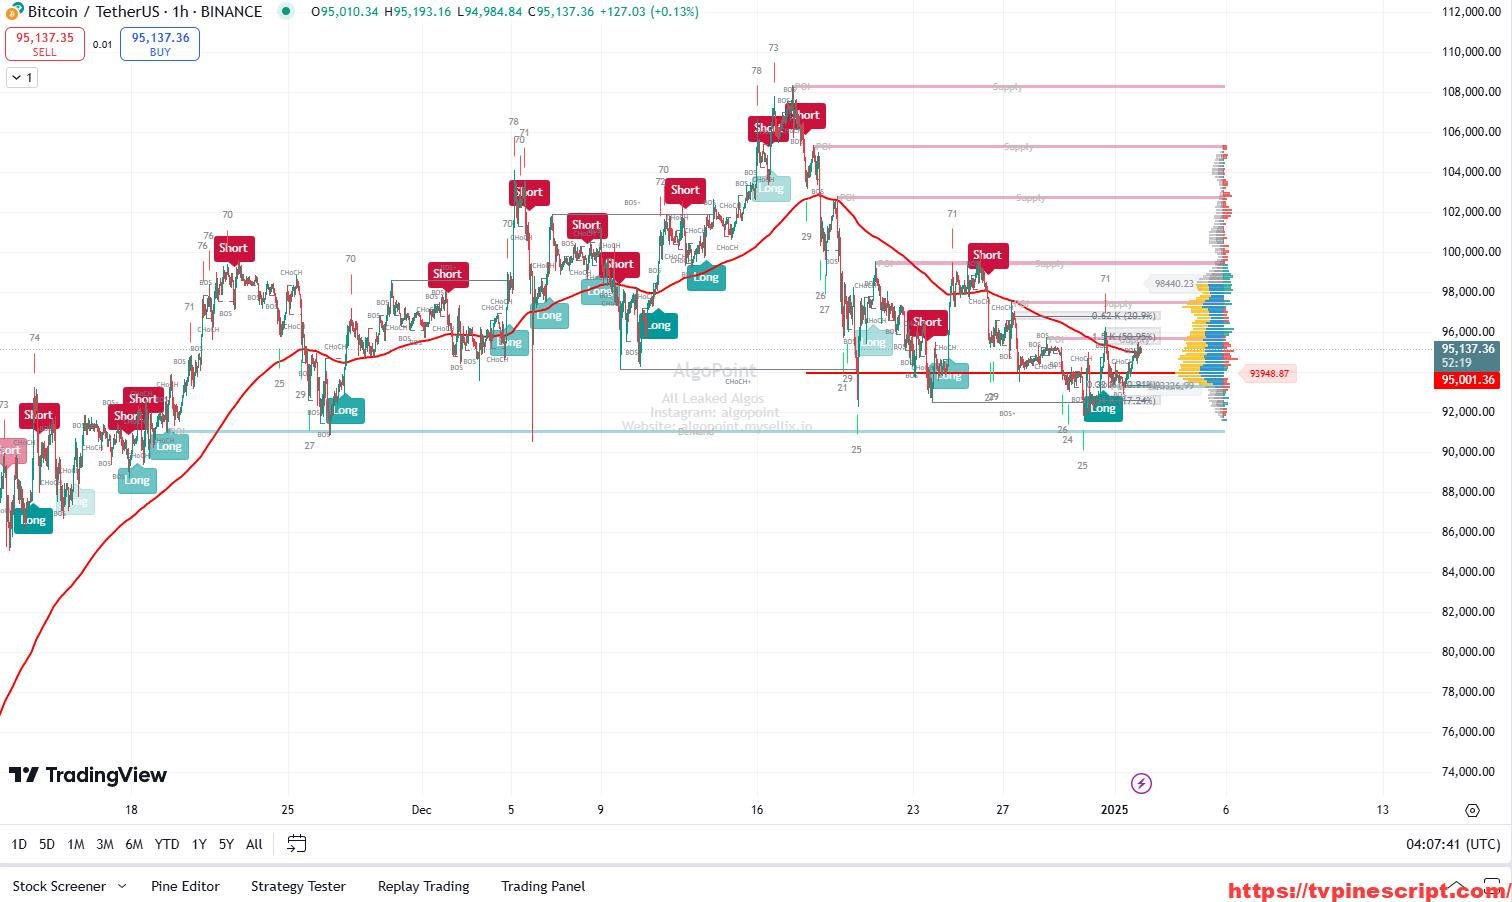
Consolidate Your Trading Analysis with the Ultimate All-in-One AlgoPoint Script
January 3, 2025 | by admin
Enhance Market Insights with the Comprehensive Trendline and Volume Profile Script
January 3, 2025 | by admin
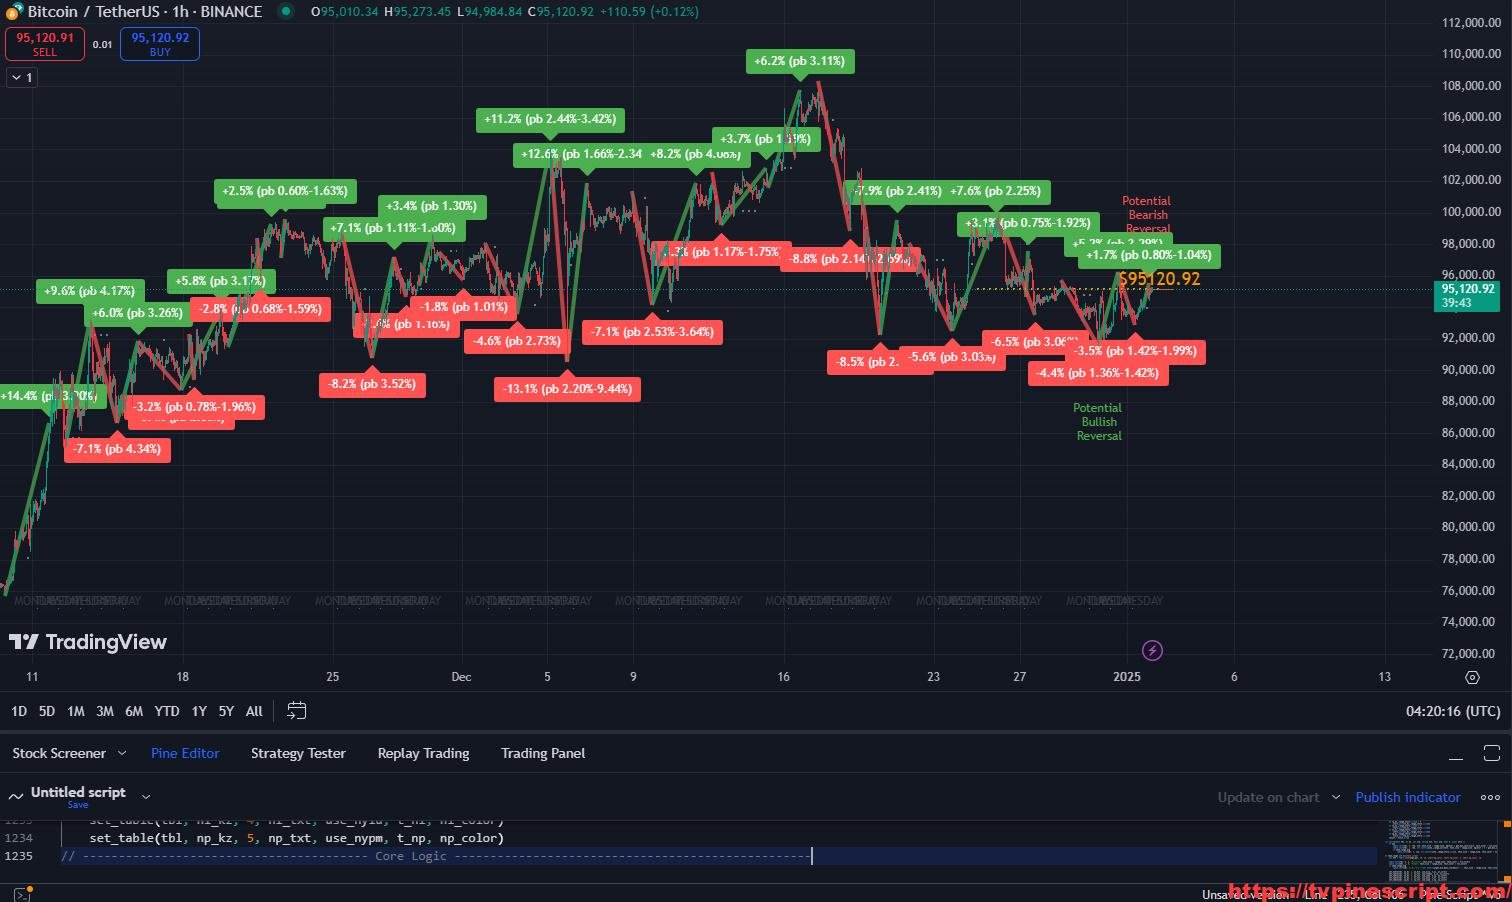
Pullback Analysis with ICT GridBot and Advanced Pine Script Features
January 3, 2025 | by admin
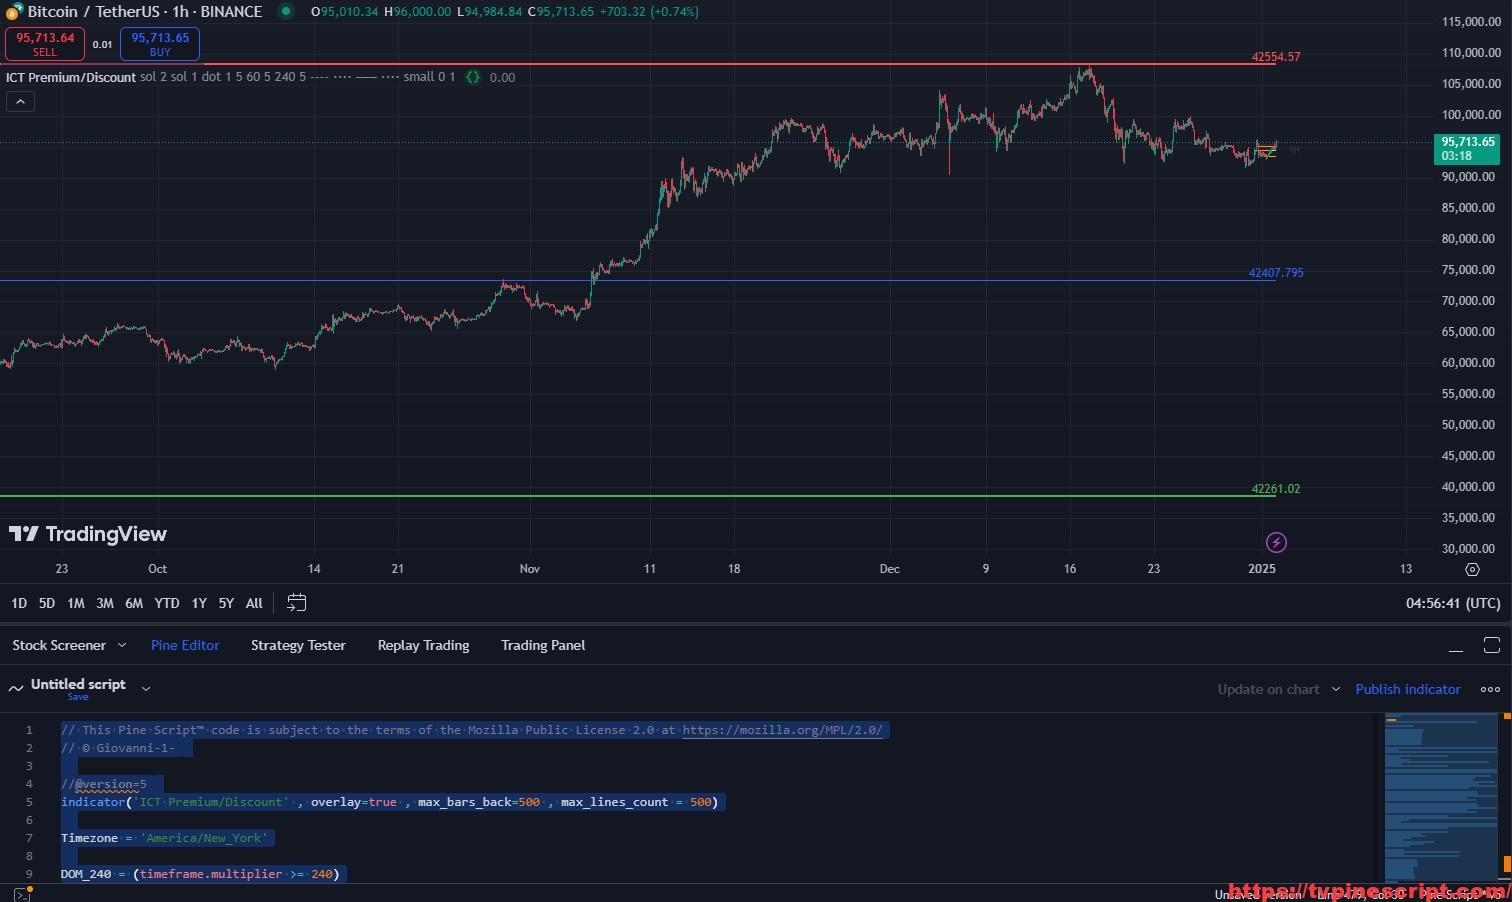
ICT Premium/Discount Zones with Advanced Fair Value Gaps in TradingView
January 3, 2025 | by admin
Comprehensive Market Analysis with Indian SnR + ICT HTF Candles + FVG + VWAP by Kuldeep Singh Negi
January 3, 2025 | by admin
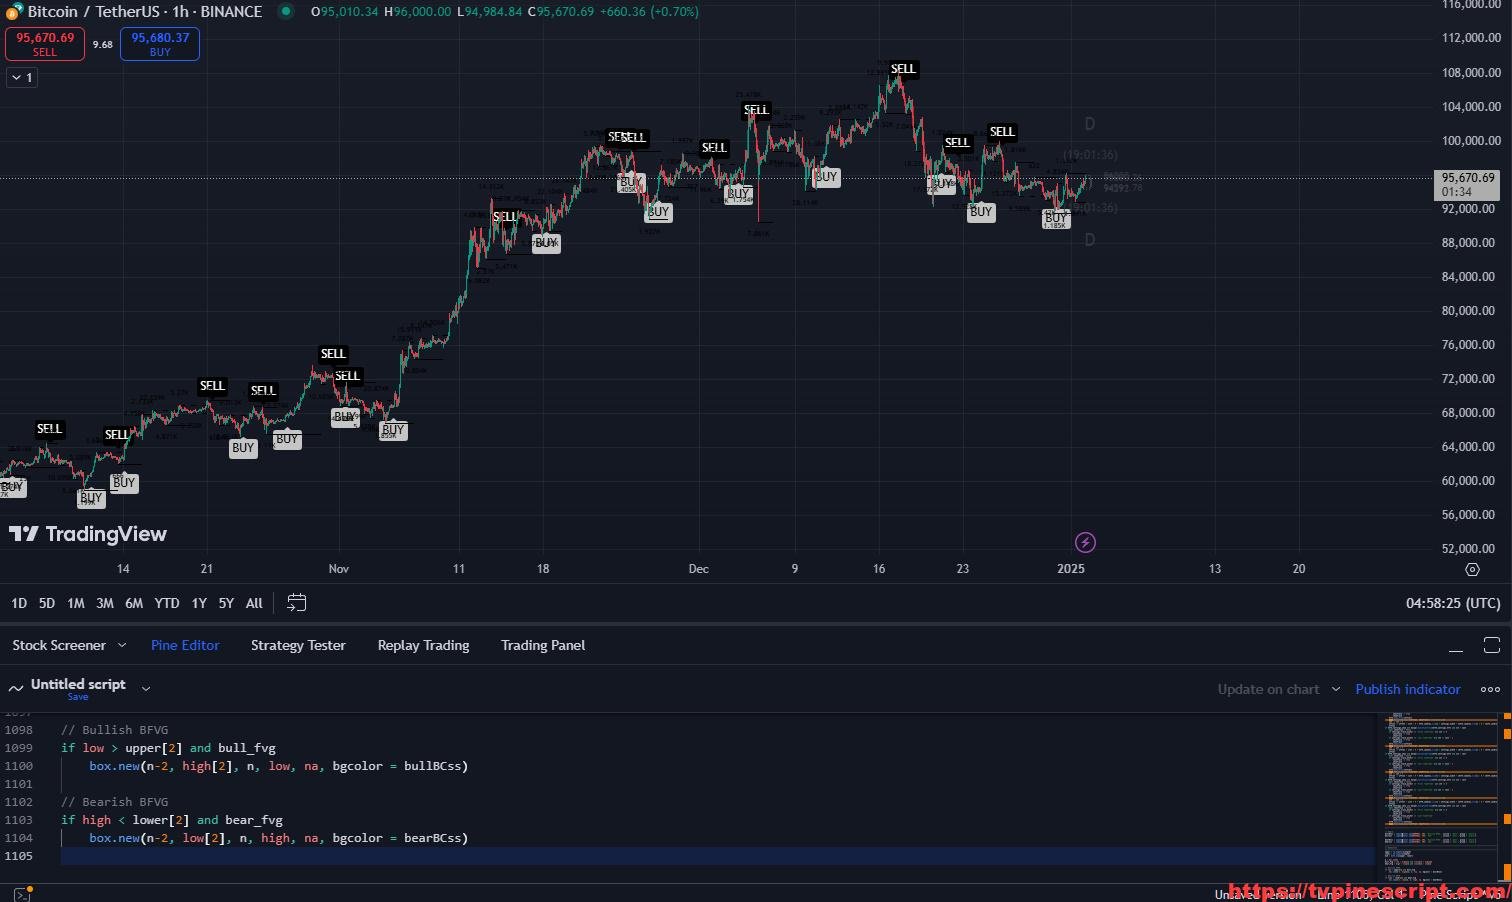
Maximize Profits with ICT + Pullback + GridBot: Advanced Trading Automation
January 3, 2025 | by admin
COCO+ Indicator: Advanced Moving Averages and Volume Analysis for Precision Trading
January 3, 2025 | by admin
// This Pine Script? code is subject to the terms of the Mozilla Public License 2.0 at https://mozilla.org/MPL/2.0/
// ? Hunter_Algo
//@version=5
indicator(title = "SMC & ICT & Indicators + Scalping Master"
, overlay = true
, max_labels_count = 500
, max_lines_count = 500
, max_boxes_count = 500
, max_bars_back = 500)
//-----------------------------------------------------------------------------{
//Constants
//-----------------------------------------------------------------------------{
color TRANSP_CSS = #ffffff00
//Tooltips
string MODE_TOOLTIP = 'Allows to display historical Structure or only the recent ones'
string STYLE_TOOLTIP = 'Indicator color theme'
string COLOR_CANDLES_TOOLTIP = 'Display additional candles with a color reflecting the current trend detected by structure'
string SHOW_INTERNAL = 'Display internal market structure'
string CONFLUENCE_FILTER = 'Filter non significant internal structure breakouts'
string SHOW_SWING = 'Display swing market Structure'
string SHOW_SWING_POINTS = 'Display swing point as labels on the chart'
string SHOW_SWHL_POINTS = 'Highlight most recent strong and weak high/low points on the chart'
string INTERNAL_OB = 'Display internal order blocks on the chart\n\nNumber of internal order blocks to display on the chart'
string SWING_OB = 'Display swing order blocks on the chart\n\nNumber of internal swing blocks to display on the chart'
string FILTER_OB = 'Method used to filter out volatile order blocks \n\nIt is recommended to use the cumulative mean range method when a low amount of data is available'
string SHOW_EQHL = 'Display equal highs and equal lows on the chart'
string EQHL_BARS = 'Number of bars used to confirm equal highs and equal lows'
string EQHL_THRESHOLD = 'Sensitivity threshold in a range (0, 1) used for the detection of equal highs & lows\n\nLower values will return fewer but more pertinent results'
string SHOW_FVG = 'Display fair values gaps on the chart'
string AUTO_FVG = 'Filter out non significant fair value gaps'
string FVG_TF = 'Fair value gaps timeframe'
string EXTEND_FVG = 'Determine how many bars to extend the Fair Value Gap boxes on chart'
string PED_ZONES = 'Display premium, discount, and equilibrium zones on chart'
//-----------------------------------------------------------------------------{
//Settings
//-----------------------------------------------------------------------------{
//General
//----------------------------------------{
mode = input.string('Historical'
, options = ['Historical', 'Present']
, group = 'Smart Money Concepts'
, tooltip = MODE_TOOLTIP)
style = input.string('Colored'
, options = ['Colored', 'Monochrome']
, group = 'Smart Money Concepts'
, tooltip = STYLE_TOOLTIP)
show_trend = input(false, 'Color Candles'
, group = 'Smart Money Concepts'
, tooltip = COLOR_CANDLES_TOOLTIP)
//----------------------------------------}
//Internal Structure
//----------------------------------------{
show_internals = input(true, 'Show Internal Structure'
, group = 'Real Time Internal Structure'
, tooltip = SHOW_INTERNAL)
show_ibull = input.string('All', 'Bullish Structure'
, options = ['All', 'BOS', 'CHoCH']
, inline = 'ibull'
, group = 'Real Time Internal Structure')
swing_ibull_css = input(#1900ff, ''
, inline = 'ibull'
, group = 'Real Time Internal Structure')
//Bear Structure
show_ibear = input.string('All', 'Bearish Structure'
, options = ['All', 'BOS', 'CHoCH']
, inline = 'ibear'
, group = 'Real Time Internal Structure')
swing_ibear_css = input(#ffee00, ''
, inline = 'ibear'
, group = 'Real Time Internal Structure')
ifilter_confluence = input(false, 'Confluence Filter'
, group = 'Real Time Internal Structure'
, tooltip = CONFLUENCE_FILTER)
//----------------------------------------}
//Swing Structure
//----------------------------------------{
show_Structure = input(true, 'Show Swing Structure'
, group = 'Real Time Swing Structure'
, tooltip = SHOW_SWING)
//Bull Structure
show_bull = input.string('All', 'Bullish Structure'
, options = ['All', 'BOS', 'CHoCH']
, inline = 'bull'
, group = 'Real Time Swing Structure')
swing_bull_css = input(#2f00ff, ''
, inline = 'bull'
, group = 'Real Time Swing Structure')
//Bear Structure
show_bear = input.string('All', 'Bearish Structure'
, options = ['All', 'BOS', 'CHoCH']
, inline = 'bear'
, group = 'Real Time Swing Structure')
swing_bear_css = input(#f8e800, ''
, inline = 'bear'
, group = 'Real Time Swing Structure')
//Swings
show_swings = input(false, 'Show Swings Points'
, inline = 'swings'
, group = 'Real Time Swing Structure'
, tooltip = SHOW_SWING_POINTS)
length = input.int(50, ''
, minval = 10
, inline = 'swings'
, group = 'Real Time Swing Structure')
show_hl_swings = input(true, 'Show Strong/Weak High/Low'
, group = 'Real Time Swing Structure'
, tooltip = SHOW_SWHL_POINTS)
//----------------------------------------}
//Order Blocks
//----------------------------------------{
show_iob = input(true, 'Internal Order Blocks'
, inline = 'iob'
, group = 'Order Blocks'
, tooltip = INTERNAL_OB)
iob_showlast = input.int(5, ''
, minval = 1
, inline = 'iob'
, group = 'Order Blocks')
show_ob = input(false, 'Swing Order Blocks'
, inline = 'ob'
, group = 'Order Blocks'
, tooltip = SWING_OB)
ob_showlast = input.int(5, ''
, minval = 1
, inline = 'ob'
, group = 'Order Blocks')
ob_filter = input.string('Atr', 'Order Block Filter'
, options = ['Atr', 'Cumulative Mean Range']
, group = 'Order Blocks'
, tooltip = FILTER_OB)
ibull_ob_css = input.color(color.new(#3179f5, 80), 'Internal Bullish OB'
, group = 'Order Blocks')
ibear_ob_css = input.color(color.new(#f77c80, 80), 'Internal Bearish OB'
, group = 'Order Blocks')
bull_ob_css = input.color(color.new(#1848cc, 80), 'Bullish OB'
, group = 'Order Blocks')
bear_ob_css = input.color(color.new(#b22833, 80), 'Bearish OB'
, group = 'Order Blocks')
//----------------------------------------}
//EQH/EQL
//----------------------------------------{
show_eq = input(true, 'Equal High/Low'
, group = 'EQH/EQL'
, tooltip = SHOW_EQHL)
eq_len = input.int(3, 'Bars Confirmation'
, minval = 1
, group = 'EQH/EQL'
, tooltip = EQHL_BARS)
eq_threshold = input.float(0.1, 'Threshold'
, minval = 0
, maxval = 0.5
, step = 0.1
, group = 'EQH/EQL'
, tooltip = EQHL_THRESHOLD)
//----------------------------------------}
//Fair Value Gaps
//----------------------------------------{
show_fvg = input(false, 'Fair Value Gaps'
, group = 'Fair Value Gaps'
, tooltip = SHOW_FVG)
fvg_auto = input(true, "Auto Threshold"
, group = 'Fair Value Gaps'
, tooltip = AUTO_FVG)
fvg_tf = input.timeframe('', "Timeframe"
, group = 'Fair Value Gaps'
, tooltip = FVG_TF)
bull_fvg_css = input.color(color.new(#00ff68, 70), 'Bullish FVG'
, group = 'Fair Value Gaps')
bear_fvg_css = input.color(color.new(#ff0008, 70), 'Bearish FVG'
, group = 'Fair Value Gaps')
fvg_extend = input.int(1, "Extend FVG"
, minval = 0
, group = 'Fair Value Gaps'
, tooltip = EXTEND_FVG)
//----------------------------------------}
//Previous day/week high/low
//----------------------------------------{
//Daily
show_pdhl = input(false, 'Daily'
, inline = 'daily'
, group = 'Highs & Lows MTF')
pdhl_style = input.string('???', ''
, options = ['???', '----', '····']
, inline = 'daily'
, group = 'Highs & Lows MTF')
pdhl_css = input(#2157f3, ''
, inline = 'daily'
, group = 'Highs & Lows MTF')
//Weekly
show_pwhl = input(false, 'Weekly'
, inline = 'weekly'
, group = 'Highs & Lows MTF')
pwhl_style = input.string('???', ''
, options = ['???', '----', '····']
, inline = 'weekly'
, group = 'Highs & Lows MTF')
pwhl_css = input(#2157f3, ''
, inline = 'weekly'
, group = 'Highs & Lows MTF')
//Monthly
show_pmhl = input(false, 'Monthly'
, inline = 'monthly'
, group = 'Highs & Lows MTF')
pmhl_style = input.string('???', ''
, options = ['???', '----', '····']
, inline = 'monthly'
, group = 'Highs & Lows MTF')
pmhl_css = input(#2157f3, ''
, inline = 'monthly'
, group = 'Highs & Lows MTF')
//----------------------------------------}
//Premium/Discount zones
//----------------------------------------{
show_sd = input(false, 'Premium/Discount Zones'
, group = 'Premium & Discount Zones'
, tooltip = PED_ZONES)
premium_css = input.color(#f9fd00, 'Premium Zone'
, group = 'Premium & Discount Zones')
eq_css = input.color(#b2b5be, 'Equilibrium Zone'
, group = 'Premium & Discount Zones')
discount_css = input.color(#0004f3, 'Discount Zone'
, group = 'Premium & Discount Zones')
//-----------------------------------------------------------------------------}
//Functions
//-----------------------------------------------------------------------------{
n = bar_index
atr = ta.atr(200)
cmean_range = ta.cum(high - low) / n
//HL Output function
hl() => [high, low]
//Get ohlc values function
get_ohlc()=> [close[1], open[1], high, low, high[2], low[2]]
//Display Structure function
display_Structure(x, y, txt, css, dashed, down, lbl_size)=>
structure_line = line.new(x, y, n, y
, color = css
, style = dashed ? line.style_dashed : line.style_solid)
structure_lbl = label.new(int(math.avg(x, n)), y, txt
, color = TRANSP_CSS
, textcolor = css
, style = down ? label.style_label_down : label.style_label_up
, size = lbl_size)
if mode == 'Present'
line.delete(structure_line[1])
label.delete(structure_lbl[1])
//Swings detection/measurements
swings(len)=>
var os = 0
upper = ta.highest(len)
lower = ta.lowest(len)
os := high[len] > upper ? 0 : low[len] < lower ? 1 : os[1]
top = os == 0 and os[1] != 0 ? high[len] : 0
btm = os == 1 and os[1] != 1 ? low[len] : 0
[top, btm]
//Order block coordinates function
ob_coord(use_max, loc, target_top, target_btm, target_left, target_type)=>
min = 99999999.
max = 0.
idx = 1
ob_threshold = ob_filter == 'Atr' ? atr : cmean_range
//Search for highest/lowest high within the structure interval and get range
if use_max
for i = 1 to (n - loc)-1
if (high[i] - low[i]) < ob_threshold[i] * 2
max := math.max(high[i], max)
min := max == high[i] ? low[i] : min
idx := max == high[i] ? i : idx
else
for i = 1 to (n - loc)-1
if (high[i] - low[i]) < ob_threshold[i] * 2
min := math.min(low[i], min)
max := min == low[i] ? high[i] : max
idx := min == low[i] ? i : idx
array.unshift(target_top, max)
array.unshift(target_btm, min)
array.unshift(target_left, time[idx])
array.unshift(target_type, use_max ? -1 : 1)
//Set order blocks
display_ob(boxes, target_top, target_btm, target_left, target_type, show_last, swing, size)=>
for i = 0 to math.min(show_last-1, size-1)
get_box = array.get(boxes, i)
box.set_lefttop(get_box, array.get(target_left, i), array.get(target_top, i))
box.set_rightbottom(get_box, array.get(target_left, i), array.get(target_btm, i))
box.set_extend(get_box, extend.right)
color css = na
if swing
if style == 'Monochrome'
css := array.get(target_type, i) == 1 ? color.new(#b2b5be, 80) : color.new(#5d606b, 80)
border_css = array.get(target_type, i) == 1 ? #b2b5be : #5d606b
box.set_border_color(get_box, border_css)
else
css := array.get(target_type, i) == 1 ? bull_ob_css : bear_ob_css
box.set_border_color(get_box, css)
box.set_bgcolor(get_box, css)
else
if style == 'Monochrome'
css := array.get(target_type, i) == 1 ? color.new(#b2b5be, 80) : color.new(#5d606b, 80)
else
css := array.get(target_type, i) == 1 ? ibull_ob_css : ibear_ob_css
box.set_border_color(get_box, css)
box.set_bgcolor(get_box, css)
//Line Style function
get_line_style(style) =>
out = switch style
'???' => line.style_solid
'----' => line.style_dashed
'····' => line.style_dotted
//Set line/labels function for previous high/lows
phl(h, l, tf, css)=>
var line high_line = line.new(na,na,na,na
, xloc = xloc.bar_time
, color = css
, style = get_line_style(pdhl_style))
var label high_lbl = label.new(na,na
, xloc = xloc.bar_time
, text = str.format('P{0}H', tf)
, color = TRANSP_CSS
, textcolor = css
, size = size.small
, style = label.style_label_left)
var line low_line = line.new(na,na,na,na
, xloc = xloc.bar_time
, color = css
, style = get_line_style(pdhl_style))
var label low_lbl = label.new(na,na
, xloc = xloc.bar_time
, text = str.format('P{0}L', tf)
, color = TRANSP_CSS
, textcolor = css
, size = size.small
, style = label.style_label_left)
hy = ta.valuewhen(h != h[1], h, 1)
hx = ta.valuewhen(h == high, time, 1)
ly = ta.valuewhen(l != l[1], l, 1)
lx = ta.valuewhen(l == low, time, 1)
if barstate.islast
ext = time + (time - time[1])*20
//High
line.set_xy1(high_line, hx, hy)
line.set_xy2(high_line, ext, hy)
label.set_xy(high_lbl, ext, hy)
//Low
line.set_xy1(low_line, lx, ly)
line.set_xy2(low_line, ext, ly)
label.set_xy(low_lbl, ext, ly)
//-----------------------------------------------------------------------------}
//Global variables
//-----------------------------------------------------------------------------{
var trend = 0, var itrend = 0
var top_y = 0., var top_x = 0
var btm_y = 0., var btm_x = 0
var itop_y = 0., var itop_x = 0
var ibtm_y = 0., var ibtm_x = 0
var trail_up = high, var trail_dn = low
var trail_up_x = 0, var trail_dn_x = 0
var top_cross = true, var btm_cross = true
var itop_cross = true, var ibtm_cross = true
var txt_top = '', var txt_btm = ''
//Alerts
bull_choch_alert = false
bull_bos_alert = false
bear_choch_alert = false
bear_bos_alert = false
bull_ichoch_alert = false
bull_ibos_alert = false
bear_ichoch_alert = false
bear_ibos_alert = false
bull_iob_break = false
bear_iob_break = false
bull_ob_break = false
bear_ob_break = false
eqh_alert = false
eql_alert = false
//Structure colors
var bull_css = style == 'Monochrome' ? #b2b5be
: swing_bull_css
var bear_css = style == 'Monochrome' ? #b2b5be
: swing_bear_css
var ibull_css = style == 'Monochrome' ? #b2b5be
: swing_ibull_css
var ibear_css = style == 'Monochrome' ? #b2b5be
: swing_ibear_css
//Swings
[top, btm] = swings(length)
[itop, ibtm] = swings(5)
//-----------------------------------------------------------------------------}
//Pivot High
//-----------------------------------------------------------------------------{
var line extend_top = na
var label extend_top_lbl = label.new(na, na
, color = TRANSP_CSS
, textcolor = bear_css
, style = label.style_label_down
, size = size.tiny)
if top
top_cross := true
txt_top := top > top_y ? 'HH' : 'LH'
if show_swings
top_lbl = label.new(n-length, top, txt_top
, color = TRANSP_CSS
, textcolor = bear_css
, style = label.style_label_down
, size = size.small)
if mode == 'Present'
label.delete(top_lbl[1])
//Extend recent top to last bar
line.delete(extend_top[1])
extend_top := line.new(n-length, top, n, top
, color = bear_css)
top_y := top
top_x := n - length
trail_up := top
trail_up_x := n - length
if itop
itop_cross := true
itop_y := itop
itop_x := n - 5
//Trailing maximum
trail_up := math.max(high, trail_up)
trail_up_x := trail_up == high ? n : trail_up_x
//Set top extension label/line
if barstate.islast and show_hl_swings
line.set_xy1(extend_top, trail_up_x, trail_up)
line.set_xy2(extend_top, n + 20, trail_up)
label.set_x(extend_top_lbl, n + 20)
label.set_y(extend_top_lbl, trail_up)
label.set_text(extend_top_lbl, trend < 0 ? 'Strong High' : 'Weak High')
//-----------------------------------------------------------------------------}
//Pivot Low
//-----------------------------------------------------------------------------{
var line extend_btm = na
var label extend_btm_lbl = label.new(na, na
, color = TRANSP_CSS
, textcolor = bull_css
, style = label.style_label_up
, size = size.tiny)
if btm
btm_cross := true
txt_btm := btm < btm_y ? 'LL' : 'HL'
if show_swings
btm_lbl = label.new(n - length, btm, txt_btm
, color = TRANSP_CSS
, textcolor = bull_css
, style = label.style_label_up
, size = size.small)
if mode == 'Present'
label.delete(btm_lbl[1])
//Extend recent btm to last bar
line.delete(extend_btm[1])
extend_btm := line.new(n - length, btm, n, btm
, color = bull_css)
btm_y := btm
btm_x := n-length
trail_dn := btm
trail_dn_x := n-length
if ibtm
ibtm_cross := true
ibtm_y := ibtm
ibtm_x := n - 5
//Trailing minimum
trail_dn := math.min(low, trail_dn)
trail_dn_x := trail_dn == low ? n : trail_dn_x
//Set btm extension label/line
if barstate.islast and show_hl_swings
line.set_xy1(extend_btm, trail_dn_x, trail_dn)
line.set_xy2(extend_btm, n + 20, trail_dn)
label.set_x(extend_btm_lbl, n + 20)
label.set_y(extend_btm_lbl, trail_dn)
label.set_text(extend_btm_lbl, trend > 0 ? 'Strong Low' : 'Weak Low')
//-----------------------------------------------------------------------------}
//Order Blocks Arrays
//-----------------------------------------------------------------------------{
var iob_top = array.new_float(0)
var iob_btm = array.new_float(0)
var iob_left = array.new_int(0)
var iob_type = array.new_int(0)
var ob_top = array.new_float(0)
var ob_btm = array.new_float(0)
var ob_left = array.new_int(0)
var ob_type = array.new_int(0)
//-----------------------------------------------------------------------------}
//Pivot High BOS/CHoCH
//-----------------------------------------------------------------------------{
//Filtering
var bull_concordant = true
if ifilter_confluence
bull_concordant := high - math.max(close, open) > math.min(close, open - low)
//Detect internal bullish Structure
if ta.crossover(close, itop_y) and itop_cross and top_y != itop_y and bull_concordant
bool choch = na
if itrend < 0
choch := true
bull_ichoch_alert := true
else
bull_ibos_alert := true
txt = choch ? 'CHoCH' : 'BOS'
if show_internals
if show_ibull == 'All' or (show_ibull == 'BOS' and not choch) or (show_ibull == 'CHoCH' and choch)
display_Structure(itop_x, itop_y, txt, ibull_css, true, true, size.tiny)
itop_cross := false
itrend := 1
//Internal Order Block
if show_iob
ob_coord(false, itop_x, iob_top, iob_btm, iob_left, iob_type)
//Detect bullish Structure
if ta.crossover(close, top_y) and top_cross
bool choch = na
if trend < 0
choch := true
bull_choch_alert := true
else
bull_bos_alert := true
txt = choch ? 'CHoCH' : 'BOS'
if show_Structure
if show_bull == 'All' or (show_bull == 'BOS' and not choch) or (show_bull == 'CHoCH' and choch)
display_Structure(top_x, top_y, txt, bull_css, false, true, size.small)
//Order Block
if show_ob
ob_coord(false, top_x, ob_top, ob_btm, ob_left, ob_type)
top_cross := false
trend := 1
//-----------------------------------------------------------------------------}
//Pivot Low BOS/CHoCH
//-----------------------------------------------------------------------------{
var bear_concordant = true
if ifilter_confluence
bear_concordant := high - math.max(close, open) < math.min(close, open - low)
//Detect internal bearish Structure
if ta.crossunder(close, ibtm_y) and ibtm_cross and btm_y != ibtm_y and bear_concordant
bool choch = false
if itrend > 0
choch := true
bear_ichoch_alert := true
else
bear_ibos_alert := true
txt = choch ? 'CHoCH' : 'BOS'
if show_internals
if show_ibear == 'All' or (show_ibear == 'BOS' and not choch) or (show_ibear == 'CHoCH' and choch)
display_Structure(ibtm_x, ibtm_y, txt, ibear_css, true, false, size.tiny)
ibtm_cross := false
itrend := -1
//Internal Order Block
if show_iob
ob_coord(true, ibtm_x, iob_top, iob_btm, iob_left, iob_type)
//Detect bearish Structure
if ta.crossunder(close, btm_y) and btm_cross
bool choch = na
if trend > 0
choch := true
bear_choch_alert := true
else
bear_bos_alert := true
txt = choch ? 'CHoCH' : 'BOS'
if show_Structure
if show_bear == 'All' or (show_bear == 'BOS' and not choch) or (show_bear == 'CHoCH' and choch)
display_Structure(btm_x, btm_y, txt, bear_css, false, false, size.small)
//Order Block
if show_ob
ob_coord(true, btm_x, ob_top, ob_btm, ob_left, ob_type)
btm_cross := false
trend := -1
//-----------------------------------------------------------------------------}
//Order Blocks
//-----------------------------------------------------------------------------{
//Set order blocks
var iob_boxes = array.new_box(0)
var ob_boxes = array.new_box(0)
//Delete internal order blocks box coordinates if top/bottom is broken
for element in iob_type
index = array.indexof(iob_type, element)
if close < array.get(iob_btm, index) and element == 1
array.remove(iob_top, index)
array.remove(iob_btm, index)
array.remove(iob_left, index)
array.remove(iob_type, index)
bull_iob_break := true
else if close > array.get(iob_top, index) and element == -1
array.remove(iob_top, index)
array.remove(iob_btm, index)
array.remove(iob_left, index)
array.remove(iob_type, index)
bear_iob_break := true
//Delete internal order blocks box coordinates if top/bottom is broken
for element in ob_type
index = array.indexof(ob_type, element)
if close < array.get(ob_btm, index) and element == 1
array.remove(ob_top, index)
array.remove(ob_btm, index)
array.remove(ob_left, index)
array.remove(ob_type, index)
bull_ob_break := true
else if close > array.get(ob_top, index) and element == -1
array.remove(ob_top, index)
array.remove(ob_btm, index)
array.remove(ob_left, index)
array.remove(ob_type, index)
bear_ob_break := true
iob_size = array.size(iob_type)
ob_size = array.size(ob_type)
if barstate.isfirst
if show_iob
for i = 0 to iob_showlast-1
array.push(iob_boxes, box.new(na,na,na,na, xloc = xloc.bar_time))
if show_ob
for i = 0 to ob_showlast-1
array.push(ob_boxes, box.new(na,na,na,na, xloc = xloc.bar_time))
if iob_size > 0
if barstate.islast
display_ob(iob_boxes, iob_top, iob_btm, iob_left, iob_type, iob_showlast, false, iob_size)
if ob_size > 0
if barstate.islast
display_ob(ob_boxes, ob_top, ob_btm, ob_left, ob_type, ob_showlast, true, ob_size)
//-----------------------------------------------------------------------------}
//EQH/EQL
//-----------------------------------------------------------------------------{
var eq_prev_top = 0.
var eq_top_x = 0
var eq_prev_btm = 0.
var eq_btm_x = 0
if show_eq
eq_top = ta.pivothigh(eq_len, eq_len)
eq_btm = ta.pivotlow(eq_len, eq_len)
if eq_top
max = math.max(eq_top, eq_prev_top)
min = math.min(eq_top, eq_prev_top)
if max < min + atr * eq_threshold
eqh_line = line.new(eq_top_x, eq_prev_top, n-eq_len, eq_top
, color = bear_css
, style = line.style_dotted)
eqh_lbl = label.new(int(math.avg(n-eq_len, eq_top_x)), eq_top, 'EQH'
, color = #00000000
, textcolor = bear_css
, style = label.style_label_down
, size = size.tiny)
if mode == 'Present'
line.delete(eqh_line[1])
label.delete(eqh_lbl[1])
eqh_alert := true
eq_prev_top := eq_top
eq_top_x := n-eq_len
if eq_btm
max = math.max(eq_btm, eq_prev_btm)
min = math.min(eq_btm, eq_prev_btm)
if min > max - atr * eq_threshold
eql_line = line.new(eq_btm_x, eq_prev_btm, n-eq_len, eq_btm
, color = bull_css
, style = line.style_dotted)
eql_lbl = label.new(int(math.avg(n-eq_len, eq_btm_x)), eq_btm, 'EQL'
, color = #00000000
, textcolor = bull_css
, style = label.style_label_up
, size = size.tiny)
eql_alert := true
if mode == 'Present'
line.delete(eql_line[1])
label.delete(eql_lbl[1])
eq_prev_btm := eq_btm
eq_btm_x := n-eq_len
//-----------------------------------------------------------------------------}
//Fair Value Gaps
//-----------------------------------------------------------------------------{
var bullish_fvg_max = array.new_box(0)
var bullish_fvg_min = array.new_box(0)
var bearish_fvg_max = array.new_box(0)
var bearish_fvg_min = array.new_box(0)
float bullish_fvg_avg = na
float bearish_fvg_avg = na
bullish_fvg_cnd = false
bearish_fvg_cnd = false
[src_c1, src_o1, src_h, src_l, src_h2, src_l2] =
request.security(syminfo.tickerid, fvg_tf, get_ohlc())
if show_fvg
delta_per = (src_c1 - src_o1) / src_o1 * 100
change_tf = timeframe.change(fvg_tf)
threshold = fvg_auto ? ta.cum(math.abs(change_tf ? delta_per : 0)) / n * 2
: 0
//FVG conditions
bullish_fvg_cnd := src_l > src_h2
and src_c1 > src_h2
and delta_per > threshold
and change_tf
bearish_fvg_cnd := src_h < src_l2
and src_c1 < src_l2
and -delta_per > threshold
and change_tf
//FVG Areas
if bullish_fvg_cnd
array.unshift(bullish_fvg_max, box.new(n-1, src_l, n + fvg_extend, math.avg(src_l, src_h2)
, border_color = bull_fvg_css
, bgcolor = bull_fvg_css))
array.unshift(bullish_fvg_min, box.new(n-1, math.avg(src_l, src_h2), n + fvg_extend, src_h2
, border_color = bull_fvg_css
, bgcolor = bull_fvg_css))
if bearish_fvg_cnd
array.unshift(bearish_fvg_max, box.new(n-1, src_h, n + fvg_extend, math.avg(src_h, src_l2)
, border_color = bear_fvg_css
, bgcolor = bear_fvg_css))
array.unshift(bearish_fvg_min, box.new(n-1, math.avg(src_h, src_l2), n + fvg_extend, src_l2
, border_color = bear_fvg_css
, bgcolor = bear_fvg_css))
for bx in bullish_fvg_min
if low < box.get_bottom(bx)
box.delete(bx)
box.delete(array.get(bullish_fvg_max, array.indexof(bullish_fvg_min, bx)))
for bx in bearish_fvg_max
if high > box.get_top(bx)
box.delete(bx)
box.delete(array.get(bearish_fvg_min, array.indexof(bearish_fvg_max, bx)))
//-----------------------------------------------------------------------------}
//Previous day/week high/lows
//-----------------------------------------------------------------------------{
//Daily high/low
[pdh, pdl] = request.security(syminfo.tickerid, 'D', hl()
, lookahead = barmerge.lookahead_on)
//Weekly high/low
[pwh, pwl] = request.security(syminfo.tickerid, 'W', hl()
, lookahead = barmerge.lookahead_on)
//Monthly high/low
[pmh, pml] = request.security(syminfo.tickerid, 'M', hl()
, lookahead = barmerge.lookahead_on)
//Display Daily
if show_pdhl
phl(pdh, pdl, 'D', pdhl_css)
//Display Weekly
if show_pwhl
phl(pwh, pwl, 'W', pwhl_css)
//Display Monthly
if show_pmhl
phl(pmh, pml, 'M', pmhl_css)
//-----------------------------------------------------------------------------}
//Premium/Discount/Equilibrium zones
//-----------------------------------------------------------------------------{
var premium = box.new(na, na, na, na
, bgcolor = color.new(premium_css, 80)
, border_color = na)
var premium_lbl = label.new(na, na
, text = 'Premium'
, color = TRANSP_CSS
, textcolor = premium_css
, style = label.style_label_down
, size = size.small)
var eq = box.new(na, na, na, na
, bgcolor = color.rgb(120, 123, 134, 80)
, border_color = na)
var eq_lbl = label.new(na, na
, text = 'Equilibrium'
, color = TRANSP_CSS
, textcolor = eq_css
, style = label.style_label_left
, size = size.small)
var discount = box.new(na, na, na, na
, bgcolor = color.new(discount_css, 80)
, border_color = na)
var discount_lbl = label.new(na, na
, text = 'Discount'
, color = TRANSP_CSS
, textcolor = discount_css
, style = label.style_label_up
, size = size.small)
//Show Premium/Discount Areas
if barstate.islast and show_sd
avg = math.avg(trail_up, trail_dn)
box.set_lefttop(premium, math.max(top_x, btm_x), trail_up)
box.set_rightbottom(premium, n, .95 * trail_up + .05 * trail_dn)
label.set_xy(premium_lbl, int(math.avg(math.max(top_x, btm_x), n)), trail_up)
box.set_lefttop(eq, math.max(top_x, btm_x), .525 * trail_up + .475*trail_dn)
box.set_rightbottom(eq, n, .525 * trail_dn + .475 * trail_up)
label.set_xy(eq_lbl, n, avg)
box.set_lefttop(discount, math.max(top_x, btm_x), .95 * trail_dn + .05 * trail_up)
box.set_rightbottom(discount, n, trail_dn)
label.set_xy(discount_lbl, int(math.avg(math.max(top_x, btm_x), n)), trail_dn)
//-----------------------------------------------------------------------------}
//Trend
//-----------------------------------------------------------------------------{
var color trend_css = na
if show_trend
if style == 'Colored'
trend_css := itrend == 1 ? bull_css : bear_css
else if style == 'Monochrome'
trend_css := itrend == 1 ? #b2b5be : #5d606b
plotcandle(open, high, low, close
, color = trend_css
, wickcolor = trend_css
, bordercolor = trend_css
, editable = false)
//-----------------------------------------------------------------------------}
//Alerts
//-----------------------------------------------------------------------------{
//Internal Structure
alertcondition(bull_ibos_alert, 'Internal Bullish BOS', 'Internal Bullish BOS formed')
alertcondition(bull_ichoch_alert, 'Internal Bullish CHoCH', 'Internal Bullish CHoCH formed')
alertcondition(bear_ibos_alert, 'Internal Bearish BOS', 'Internal Bearish BOS formed')
alertcondition(bear_ichoch_alert, 'Internal Bearish CHoCH', 'Internal Bearish CHoCH formed')
//Swing Structure
alertcondition(bull_bos_alert, 'Bullish BOS', 'Internal Bullish BOS formed')
alertcondition(bull_choch_alert, 'Bullish CHoCH', 'Internal Bullish CHoCH formed')
alertcondition(bear_bos_alert, 'Bearish BOS', 'Bearish BOS formed')
alertcondition(bear_choch_alert, 'Bearish CHoCH', 'Bearish CHoCH formed')
//order Blocks
alertcondition(bull_iob_break, 'Bullish Internal OB Breakout', 'Price broke bullish iternal OB')
alertcondition(bear_iob_break, 'Bearish Internal OB Breakout', 'Price broke bearish iternal OB')
alertcondition(bull_ob_break, 'Bullish OB Breakout', 'Price broke bullish iternal OB')
alertcondition(bear_ob_break, 'bearish OB Breakout', 'Price broke bearish iternal OB')
//EQH/EQL
alertcondition(eqh_alert, 'Equal Highs', 'Equal highs detected')
alertcondition(eql_alert, 'Equal Lows', 'Equal lows detected')
//FVG
alertcondition(bullish_fvg_cnd, 'Bullish FVG', 'Bullish FVG formed')
alertcondition(bearish_fvg_cnd, 'Bearish FVG', 'Bearish FVG formed')
//-----------------------------------------------------------------------------}
ds_min_pc_change = input.float(title='Min % change', defval=0.05, minval=0, step=0.2, group='Demand & Supply',
tooltip=' --- Min % change ---' + '\n\n' + 'A zone is added if one candle or a run of bullish/bearish candles meets this minimum % change.' + '\n\n' +
'The change is from the open to the close when the time period is complete. Adjust the % for the pair and the timeframe.' + '\n' +
'e.g. Crypto 15m 0.8% 1m 0.5%, Forex 15m 0.4%')
ds_max_pc_zone = input.float(title='Max % zone height', defval=0.05, minval=0, step=0.2, group='Demand & Supply',
tooltip=' --- Max % zone height ---' + '\n\n' + 'The zone height is decided by the size of the candle before a significant drop or rally.' + '\n\n' +
'Setting a higher max % will keep the height closer to candle height.' + '\n' +
'Setting a lower max % makes the boxes look a bit tidier.')
ds_line_pc_display = input.float(title='% line', defval=3.0, step=0.5, minval=0, maxval=5, inline='line', group='Demand & Supply')
ds_line_max = input.int(title='Max line', defval=3, minval=0, maxval=5, inline='line', group='Demand & Supply',
tooltip=' --- % Line --- ' + '\n' + 'Display lines of active zones when the close is within this % of the line. Max is 5%.' + '\n\n' +
' --- Max Line --- ' + '\n' + 'The maximum number of lines to display for each zone type.')
ds_max_zones = input.int(title='Max number of zones', defval=100, step=50, maxval=200, group='Demand & Supply',
tooltip=' --- Max number of zones ---' + '\n\n' + 'The maximum number of zones for each zone type.\nUp to 200 boxes can be displayed for each zone type.')
ds_hours_offset = input.float(0.0, "Timezone offset (H)", minval=-12, maxval=14, group='Demand & Supply',
tooltip=' --- Timezone offset (H) --- ' + '\n' + 'If your chart timezone is not set set to UTC, set the offset in hours.' + '\n' +
'Range: -12 to +14.'+ '\n\n' +
'Time information is displayed when hovering over zone labels.')
showDemandZone = input.bool(title='Demand', defval=true, inline='demand_1', group='Demand & Supply')
demand_bord_col = input.color(title='Border', defval=color.rgb(11, 255, 2), inline='demand_1', group='Demand & Supply')
demand_bg_col = input.color(title='Background', defval=color.rgb(2, 2, 2), inline='demand_1', group='Demand & Supply',
tooltip='This background colour applies when the zone is active. Once the zone has been hit, it becomes transparent.')
showSupplyZone = input.bool(title='Supply', defval=true, inline='supply_1', group='Demand & Supply')
supply_bord_col = input.color(title='Border', defval=color.rgb(255, 0, 0), inline='supply_1', group='Demand & Supply')
supply_bg_col = input.color(title='Background', defval=color.rgb(255, 254, 254), inline='supply_1', group='Demand & Supply',
tooltip='This background colour applies when the zone is active. Once the zone has been hit, it becomes transparent.')
dsAlertDemand = input.bool(true, title='Demand', inline='ds_alert_1', group='Demand & Supply Alerts')
dsAlertSupply = input.bool(true, title='Supply', inline='ds_alert_1', group='Demand & Supply Alerts',
tooltip=' --- Demand & Supply Alerts ---' + '\n\n' + 'Two types of alerts are sent:' + '\n' +
'1. Hit: The price hits an active zone.' + '\n' + '2. Near: The price approaches the active zone.' + '\n\n' +
' --- Supply Example ---' + '\n' +
'1. When the price is below the supply zone and the high hits the zone, an alert is sent.' + '\n' +
'2. When the price is below the supply zone and the high is within the Near %, an alert is sent.')
ds_alert_mins_no_repeat = input.int(60, minval=0, maxval=120, title='Mins no repeat', group='Demand & Supply Alerts',
tooltip=' --- Mins No Repeat ---' + '\n\n' + 'Wait x mins before sending a similar alert type for the same zone.' + '\n\n' +
'Setting this to 0 will turn this feature off.' + '\n' +
'Max = 120mins.')
ds_alerts_pc_near = input.float(1.5, title='Near %', step=0.1, maxval=5, group='Demand & Supply Alerts',
tooltip=' --- Near % ---' +
'\n' + 'The alert is sent when the high or low is within this % of the zone. Max is 5%.')
// ================================== //
// ----------> Top Func <---------- //
// ================================== //
get_pc_diff_abs(x_start, y_end) =>
math.abs((y_end - x_start) / x_start * 100)
get_amount_by_pc(amount, pc, add_minus) =>
pc_amount = amount * (pc / 100)
add_minus == 'add' ? amount + pc_amount : amount - pc_amount
// ================================== //
// ----> Demand & Supply Vars <---- //
// ================================== //
var milli_secs_per_bar =
timeframe.isseconds ? timeframe.multiplier * 1000 :
timeframe.isminutes ? timeframe.multiplier * 60 * 1000 :
timeframe.isdaily ? timeframe.multiplier * 24 * 60 * 60 * 1000 :
timeframe.isweekly ? timeframe.multiplier * 7 * 24 * 60 * 60 * 1000 : na
// Main labels with limited data
var demand_zones_alert = array.new_float(0)
var demand_zones_time = array.new_int(0)
var demand_zones_s1_active = array.new_bool(0)
var demand_zones_s1 = array.new_float(0)
var demand_zones_box = array.new_box(0)
var supply_zones_alert = array.new_float(0)
var supply_zones_time = array.new_int(0)
var supply_zones_s1 = array.new_float(0)
var supply_zones_s1_active = array.new_bool(0)
var supply_zones_box = array.new_box(0)
var demand_zones_s1_line = array.new_line(ds_line_max)
var demand_zones_s1_line_price = array.new_label(ds_line_max)
var supply_zones_s1_line = array.new_line(ds_line_max)
var supply_zones_s1_line_price = array.new_label(ds_line_max)
// All data with active zones
var demand_zones_time_all = array.new_int(0)
var demand_zones_s1_all = array.new_float(0)
var supply_zones_time_all = array.new_int(0)
var supply_zones_s1_all = array.new_float(0)
var demand_zones_label_all = array.new_label(ds_line_max)
var demand_zones_line_all = array.new_line(ds_line_max)
var supply_zones_label_all = array.new_label(ds_line_max)
var supply_zones_line_all = array.new_line(ds_line_max)
if barstate.isfirst
for i = 0 to ds_line_max - 1
array.set(demand_zones_s1_line, i, line.new(na, na, na, na, xloc=xloc.bar_time, color=demand_bord_col, style=line.style_solid))
array.set(supply_zones_s1_line, i, line.new(na, na, na, na, xloc=xloc.bar_time, color=supply_bord_col, style=line.style_solid))
array.set(demand_zones_s1_line_price, i, label.new(na, na, textcolor=color.new(color.white, 0), style=label.style_label_left))
array.set(supply_zones_s1_line_price, i, label.new(na, na, textcolor=color.new(color.white, 0), style=label.style_label_left))
array.set(demand_zones_label_all, i, label.new(na, na, textcolor=color.new(color.white, 0), style=label.style_label_left))
array.set(supply_zones_label_all, i, label.new(na, na, textcolor=color.new(color.white, 0), style=label.style_label_left))
array.set(demand_zones_line_all, i, line.new(na, na, na, na, color=color.new(color.white, 100), style=line.style_solid))
array.set(supply_zones_line_all, i, line.new(na, na, na, na, color=color.new(color.white, 100), style=line.style_solid))
bear_run = ta.barssince(open < close)
bull_run = ta.barssince(open > close)
var float s1_level = na
var int s1_time = na
s1_level :=
get_pc_diff_abs(open[1], close[1]) < 0.02 and
((bull_run == 1 and open[2] > close[2]) or (bear_run == 1 and open[2] < close[2])) ? open[2] :
bull_run == 1 or bear_run == 1 ? open[1] :
bull_run > 1 or bear_run > 1 ? s1_level : na
s1_time :=
bull_run == 1 or bear_run == 1 ? time[1] :
bull_run > 1 or bear_run > 1 ? s1_time : na
// ================================== //
// ----> Demand & Supply Func <---- //
// ================================== //
get_month_bar_time(_bar_start, _add_minus, _num_bars) =>
_add_minus_sign = _add_minus == 'add' ? 1 : -1
_year_start = year(_bar_start)
_month_start = month(_bar_start)
_months_div_year = _num_bars / 12
_year_change = _months_div_year >= 1 ? math.floor(_months_div_year) : 0
_year = _year_start + (_year_change * _add_minus_sign)
_month_change = _num_bars % 12
_month = _month_start + (_month_change * _add_minus_sign)
_year += _month > 12 ? 1 : _month < 1 ? -1 : 0
_month += _month > 12 ? -12 : _month < 1 ? 12 : 0
timestamp(_year, _month, 1, 0, 0, 0)
get_bar_time(_bar_start, _add_minus, _num_bars) =>
_add_minus_sign = _add_minus == 'add' ? 1 : -1
_bar_time =
not na(milli_secs_per_bar) ? _bar_start + ((milli_secs_per_bar * _num_bars) * _add_minus_sign) :
timeframe.ismonthly ? get_month_bar_time(_bar_start, _add_minus, _num_bars) : na
add_ds_zone(_zone_type) =>
_showZone = (_zone_type == 'S' and showSupplyZone) or (_zone_type == 'D' and showDemandZone)
_zones_time = _zone_type == 'S' ? supply_zones_time : demand_zones_time
_bars_to_s1 = _zone_type == 'S' ? bear_run : bull_run
_pc_change = _bars_to_s1 >= 1 ? get_pc_diff_abs(close, open[_bars_to_s1 - 1]) : 0
if not array.includes(_zones_time, s1_time) and _pc_change >= ds_min_pc_change and barstate.isconfirmed
_box_left_time = get_bar_time(s1_time, 'minus', 1)
_box_right_time = get_bar_time(s1_time, 'add', 2)
_zones_s1_active = _zone_type == 'S' ? supply_zones_s1_active : demand_zones_s1_active
_zones_s1 = _zone_type == 'S' ? supply_zones_s1 : demand_zones_s1
_zones_box = _zone_type == 'S' ? supply_zones_box : demand_zones_box
_zones_time_all = _zone_type == 'S' ? supply_zones_time_all : demand_zones_time_all
_zones_s1_all = _zone_type == 'S' ? supply_zones_s1_all : demand_zones_s1_all
array.unshift(_zones_time, s1_time)
array.unshift(_zones_time_all, s1_time)
_top = _zone_type == 'S' ? math.max(high[_bars_to_s1], high[_bars_to_s1-1]) : s1_level
_bot = _zone_type == 'S' ? s1_level : math.min(low[_bars_to_s1], low[_bars_to_s1-1])
// Adjust the zone if it's too big
_top_bot_pc_diff = get_pc_diff_abs(_top, _bot)
_candle_before_run_pc = get_pc_diff_abs(open[_bars_to_s1], close[_bars_to_s1])
_bot :=
_zone_type == 'S' and _top_bot_pc_diff > ds_max_pc_zone and _candle_before_run_pc <= ds_max_pc_zone ? s1_level :
_zone_type == 'S' and _top_bot_pc_diff > ds_max_pc_zone ? get_amount_by_pc(close[_bars_to_s1], ds_max_pc_zone/5, 'minus') :
_zone_type == 'D' and _top_bot_pc_diff > ds_max_pc_zone ? get_amount_by_pc(_top, ds_max_pc_zone, 'minus') : _bot
_top :=
_zone_type == 'S' and _top_bot_pc_diff > ds_max_pc_zone ? get_amount_by_pc(_bot, ds_max_pc_zone, 'add') :
_zone_type == 'D' and _top_bot_pc_diff > ds_max_pc_zone and _candle_before_run_pc <= ds_max_pc_zone ? s1_level :
_zone_type == 'D' and _top_bot_pc_diff > ds_max_pc_zone ? get_amount_by_pc(close[_bars_to_s1], ds_max_pc_zone/5, 'add') : _top
_bot := math.round_to_mintick(_bot)
_top := math.round_to_mintick(_top)
_s1 = _zone_type == 'S' ? _bot : _top
array.unshift(_zones_s1, _s1)
array.unshift(_zones_s1_active, true)
array.unshift(_zones_s1_all, _s1)
_bord_col = _zone_type == 'S' ? supply_bord_col : demand_bord_col
_bg_col = _zone_type == 'S' ? supply_bg_col : demand_bg_col
if _showZone
array.unshift(_zones_box, box.new(_box_left_time, _top, _box_right_time, _bot, xloc=xloc.bar_time, border_color=_bord_col, border_width=1, bgcolor=_bg_col))
if array.size(_zones_time) > ds_max_zones
// Start from the end and remove inactive zones
for i = array.size(_zones_time) - 1 to (array.size(_zones_time) == 0 ? na : 0)
_s1Active = array.size(_zones_s1_active) > i ? array.get(_zones_s1_active, i) : na
if not na(_s1Active) and not _s1Active
array.remove(_zones_time, i)
array.remove(_zones_s1_active, i)
array.remove(_zones_s1, i)
if _showZone
array.remove(_zones_box, i)
if array.size(_zones_time) == ds_max_zones
break
// TV array max size = 100,000
if array.size(_zones_time_all) > 90000
array.pop(_zones_time_all)
array.pop(_zones_s1_all)
add_ds_alert(_type, _time_unix, _price) =>
_zones_alert = _type == 'S' ? supply_zones_alert : demand_zones_alert
// Pairs: Zone price, time
array.unshift(_zones_alert, _time_unix)
array.unshift(_zones_alert, _price)
remove_ds_alerts(_type, _time_unix) =>
int _slice_start = na
_zones_alert = _type == 'S' ? supply_zones_alert : demand_zones_alert
_noRepeatOff = ds_alert_mins_no_repeat == 0
for i = 0 to (array.size(_zones_alert) == 0 or _noRepeatOff ? na : array.size(_zones_alert) - 1) by 2
_price = array.size(_zones_alert) > i ? array.get(_zones_alert, i) : na
_time = array.size(_zones_alert) > i+1 ? array.get(_zones_alert, i+1) : na
_mins_diff = (_time_unix - _time) / (1000 * 60)
if _mins_diff >= ds_alert_mins_no_repeat
_slice_start := i
break
// Everything from _slice_start will be expired
if not na(_slice_start)
_sliceArr = array.slice(_zones_alert, _slice_start, array.size(_zones_alert))
array.clear(_sliceArr)
check_repeat_alert(_type, _price) =>
_zones_alert = _type == 'S' ? supply_zones_alert : demand_zones_alert
_repeatAlert = array.includes(_zones_alert, _price)
_repeatAlert
get_ds_zone_info(_zone_type, _s1, _s1_time) =>
_info = _zone_type == 'S' ? 'Supply Zone ' : 'Demand Zone '
_info += str.tostring(_s1) + '\n'
_info += 'from UTC'
_info += ds_hours_offset > 0 ? '+' + str.tostring(ds_hours_offset) : ds_hours_offset < 0 ? str.tostring(ds_hours_offset) : ''
_info += str.format(': {0,date,yyyy/MM/dd HH:mm}', _s1_time + (60 * 60 * 1000 * ds_hours_offset)) + '\n'
_info
alert_ds(_do, _zone_type, _s1, _s1_time, _alert_type) =>
_repeatAlert = false
// Hit only happens once because the zone is deactivated
// Near can happen many times, so do not repeat within time limit
if _do and _alert_type == 'N' and ds_alert_mins_no_repeat > 0
_time_unix = time
remove_ds_alerts(_zone_type, _time_unix)
_repeatAlert := check_repeat_alert(_zone_type, _s1)
if not _repeatAlert
add_ds_alert(_zone_type, _time_unix, _s1)
if _do and not _repeatAlert
_msg = _alert_type == 'H' ? 'Zone hit' : 'Near zone'
_msg += '\n' + get_ds_zone_info(_zone_type, _s1, _s1_time)
alert(_msg)
deactivate_ds_box(_box) =>
box.set_bgcolor(_box, color.rgb(0, 0, 0, 100))
box.set_border_style(_box, line.style_dotted)
deactivate_ds_limited(_do, _zone_type, _s1, _s1_time) =>
if _do
_zones_time = _zone_type == 'S' ? supply_zones_time : demand_zones_time
_zones_s1 = _zone_type == 'S' ? supply_zones_s1 : demand_zones_s1
_zones_s1_active = _zone_type == 'S' ? supply_zones_s1_active : demand_zones_s1_active
_zones_box = _zone_type == 'S' ? supply_zones_box : demand_zones_box
_index = array.indexof(_zones_time, _s1_time)
if _index >= 0
array.set(_zones_s1_active, _index, false)
if showDemandZone and _index >= 0
_box = array.size(_zones_box) > _index ? array.get(_zones_box, _index) : na
deactivate_ds_box(_box)
check_ds_zone_hit() =>
// max set at 5, so it does not take too long
loop_break_pc = 5
// Use data from all which only contains active zones.
// Deactivate the limited labels
for i = 0 to (array.size(demand_zones_s1_all) == 0 ? na : array.size(demand_zones_s1_all) - 1)
_s1 = array.size(demand_zones_s1_all) > i ? array.get(demand_zones_s1_all, i) : na
_s1_time = array.size(demand_zones_time_all) > i ? array.get(demand_zones_time_all, i) : na
_price_near = get_amount_by_pc(_s1, ds_alerts_pc_near, 'add')
// Hit or Near
_alert_type = low <= _s1 ? 'H' : low <= _price_near ? 'N' : ''
if _alert_type == 'H'
array.remove(demand_zones_s1_all, i)
array.remove(demand_zones_time_all, i)
alert_ds(_alert_type=='H' or _alert_type=='N', 'D', _s1, _s1_time, _alert_type)
deactivate_ds_limited(_alert_type=='H', 'D', _s1, _s1_time)
if low > _s1 and get_pc_diff_abs(low, _s1) > loop_break_pc
break
for i = 0 to (array.size(supply_zones_s1_all) == 0 ? na : array.size(supply_zones_s1_all) - 1)
_s1 = array.size(supply_zones_s1_all) > i ? array.get(supply_zones_s1_all, i) : na
_s1_time = array.size(supply_zones_time_all) > i ? array.get(supply_zones_time_all, i) : na
_price_near = get_amount_by_pc(_s1, ds_alerts_pc_near, 'minus')
_alert_type = high >= _s1 ? 'H' : high >= _price_near ? 'N' : ''
if _alert_type == 'H'
array.remove(supply_zones_s1_all, i)
array.remove(supply_zones_time_all, i)
alert_ds(_alert_type=='H' or _alert_type=='N', 'S', _s1, _s1_time, _alert_type)
deactivate_ds_limited(_alert_type=='H', 'S', _s1, _s1_time)
if high < _s1 and get_pc_diff_abs(high, _s1) > loop_break_pc
break
add_ds_lbl_tooltip(_lbl, _zone_type, _s1, _s1_time) =>
_info = get_ds_zone_info(_zone_type, _s1, _s1_time)
label.set_tooltip(_lbl, _info)
draw_nearby_ds_s1() =>
if barstate.isconfirmed and (showDemandZone or showSupplyZone)
// Reset
_color_transparent = color.new(color.white, 100)
for i = 0 to ds_line_max - 1
line.set_xy1(array.get(demand_zones_s1_line, i), na, na)
line.set_xy1(array.get(supply_zones_s1_line, i), na, na)
_lbl_demand = array.get(demand_zones_s1_line_price, i)
label.set_text(_lbl_demand, '')
label.set_color(_lbl_demand, _color_transparent)
_lbl_supply = array.get(supply_zones_s1_line_price, i)
label.set_text(_lbl_supply, '')
label.set_color(_lbl_supply, _color_transparent)
_lbl_demand_all = array.get(demand_zones_label_all, i)
label.set_text(_lbl_demand_all, '')
label.set_color(_lbl_demand_all, _color_transparent)
_lbl_supply_all = array.get(supply_zones_label_all, i)
label.set_text(_lbl_supply_all, '')
label.set_color(_lbl_supply_all, _color_transparent)
_line_demand_all = array.get(demand_zones_line_all, i)
line.set_color(_line_demand_all, _color_transparent)
_line_supply_all = array.get(supply_zones_line_all, i)
line.set_color(_line_supply_all, _color_transparent)
// Main labels with limited data - Demand
_demand_line_index = 0
_s1_displayed = array.new_float(0)
float _s1_prev = na
_extra_bars = 0
_bars_out = 25
for i = 0 to (array.size(demand_zones_s1) == 0 or not showDemandZone ? na : array.size(demand_zones_s1) - 1)
_s1 = array.get(demand_zones_s1, i)
if array.get(demand_zones_s1_active, i) and get_pc_diff_abs(close, _s1) <= ds_line_pc_display
line.set_xy1(array.get(demand_zones_s1_line, _demand_line_index), get_bar_time(array.get(demand_zones_time, i), 'add', 2), _s1)
line.set_xy2(array.get(demand_zones_s1_line, _demand_line_index), get_bar_time(time, 'add', 1), _s1)
_lbl_demand = array.get(demand_zones_s1_line_price, _demand_line_index)
label.set_color(_lbl_demand, demand_bord_col)
_diff_to_prev = not na(_s1_prev) ? get_pc_diff_abs(_s1_prev, _s1) : na
_extra_bars := _extra_bars > 0 ? 0 : _diff_to_prev < 0.7 ? _bars_out : 0
label.set_xy(_lbl_demand, bar_index + 4 + _extra_bars, _s1)
label.set_text(_lbl_demand, str.tostring(_s1))
_s1_time = array.size(demand_zones_time) > i ? array.get(demand_zones_time, i) : na
add_ds_lbl_tooltip(_lbl_demand, 'D', _s1, _s1_time)
_demand_line_index += 1
_s1_prev := _s1
array.unshift(_s1_displayed, _s1)
if _demand_line_index == ds_line_max
break
// All data with active zones - Demand
_demand_line_count = _demand_line_index
_demand_line_index := 0
for i = 0 to (array.size(demand_zones_s1_all) == 0 or _demand_line_count == ds_line_max ? na : array.size(demand_zones_s1_all) - 1)
_s1 = array.size(demand_zones_s1_all) > i ? array.get(demand_zones_s1_all, i) : na
_diff = get_pc_diff_abs(close, _s1)
// Show the ones which were not picked up in limited above
_s1Displayed = array.includes(_s1_displayed, _s1)
if not _s1Displayed and _diff <= ds_line_pc_display
_lbl_demand = array.get(demand_zones_label_all, _demand_line_index)
label.set_color(_lbl_demand, demand_bord_col)
label.set_xy(_lbl_demand, bar_index + _bars_out, _s1)
label.set_text(_lbl_demand, str.tostring(_s1))
_s1_time = array.size(demand_zones_time_all) > i ? array.get(demand_zones_time_all, i) : na
add_ds_lbl_tooltip(_lbl_demand, 'S', _s1, _s1_time)
_line_demand = array.get(demand_zones_line_all, _demand_line_index)
line.set_color(_line_demand, demand_bord_col)
line.set_xy1(_line_demand, bar_index - 10, _s1)
line.set_xy2(_line_demand, bar_index + _bars_out, _s1)
_demand_line_index += 1
_demand_line_count += 1
if _demand_line_index == ds_line_max or _demand_line_count == ds_line_max or _diff > ds_line_pc_display
break
// Main labels with limited data - Supply
_supply_line_index = 0
array.clear(_s1_displayed)
_s1_prev := na
_extra_bars := 0
for i = 0 to (array.size(supply_zones_s1) == 0 or not showSupplyZone ? na : array.size(supply_zones_s1) - 1)
_s1 = array.get(supply_zones_s1, i)
if array.get(supply_zones_s1_active, i) and get_pc_diff_abs(close, _s1) <= ds_line_pc_display
line.set_xy1(array.get(supply_zones_s1_line, _supply_line_index), get_bar_time(array.get(supply_zones_time, i), 'add', 2), _s1)
line.set_xy2(array.get(supply_zones_s1_line, _supply_line_index), get_bar_time(time, 'add', 1), _s1)
_lbl_supply = array.get(supply_zones_s1_line_price, _supply_line_index)
label.set_color(_lbl_supply, supply_bord_col)
_diff_to_prev = not na(_s1_prev) ? get_pc_diff_abs(_s1_prev, _s1) : na
_extra_bars := _extra_bars > 0 ? 0 : _diff_to_prev < 0.7 ? _bars_out : 0
label.set_xy(_lbl_supply, bar_index + 4 + _extra_bars, _s1)
label.set_text(_lbl_supply, str.tostring(_s1))
_s1_time = array.size(supply_zones_time) > i ? array.get(supply_zones_time, i) : na
add_ds_lbl_tooltip(_lbl_supply, 'S', _s1, _s1_time)
_supply_line_index += 1
_s1_prev := _s1
array.unshift(_s1_displayed, _s1)
if _supply_line_index == ds_line_max
break
// All data with active zones - Supply
_supply_line_count = _supply_line_index
_supply_line_index := 0
for i = 0 to (array.size(supply_zones_s1_all) == 0 or _supply_line_count == ds_line_max ? na : array.size(supply_zones_s1_all) - 1)
_s1 = array.size(supply_zones_s1_all) > i ? array.get(supply_zones_s1_all, i) : na
_diff = get_pc_diff_abs(close, _s1)
// Show the ones which were not picked up in limited above
_s1Displayed = array.includes(_s1_displayed, _s1)
if not _s1Displayed and _diff <= ds_line_pc_display
_lbl_supply = array.get(supply_zones_label_all, _supply_line_index)
label.set_color(_lbl_supply, supply_bord_col)
label.set_xy(_lbl_supply, bar_index + _bars_out, _s1)
label.set_text(_lbl_supply, str.tostring(_s1))
_s1_time = array.size(supply_zones_time_all) > i ? array.get(supply_zones_time_all, i) : na
add_ds_lbl_tooltip(_lbl_supply, 'S', _s1, _s1_time)
_line_supply = array.get(supply_zones_line_all, _supply_line_index)
line.set_color(_line_supply, supply_bord_col)
line.set_xy1(_line_supply, bar_index - 10, _s1)
line.set_xy2(_line_supply, bar_index + _bars_out, _s1)
_supply_line_index += 1
_supply_line_count += 1
if _supply_line_index == ds_line_max or _supply_line_count == ds_line_max or _diff > ds_line_pc_display
break
// ================================== //
// ----> Demand & Supply Calc <---- //
// ================================== //
check_ds_zone_hit()
add_ds_zone('D')
add_ds_zone('S')
draw_nearby_ds_s1()
/////
import Bjorgum/BjCandlePatterns/2 as bj
// ================================== //
// ------------> Tips <-------------- //
// ================================== //
leftTip = "Look left for swing high/low in x number of bars to form pivot. The higher the number, the higher the script looks to the left for the highest/lowest point before drawing pivot"
rightTip = "Look right for swing high/low in x number of bars to form pivot. The higher the number, the higher the script looks to the right for the highest/lowest point before drawing pivot"
nPivTip = "This sets the array size, or the number of pivots to track at a time (x highs, and x number of lows)"
atrLenTip = "Number of bars to average. ATR is used to standardize zone width between assets and timeframes"
multTip = "ATR multiplier to set zone width. Default is half of one ATR from box bottom to box top"
perTip = "Max zone size as a percent of price. Some assets can be too volatile at low prices creating an unreasonably sized zone"
maxTip = "Number of boxes for candlestick patterns to track historically. Note: the higher the number the less pivot zones will be tracked when looking back in time due to the limitation on the number of box elements allowed at once"
futTip = "Number of bars to offset labels for price levels"
srcTip = "Source input for pivots. Default tracks the highest and lowest bodies of HA candles to average price action, which can result in a level that sits in the overlap of support and resistance"
alignZonesTip = "Aligns recurring zones who's edges overlap an existing zone creating a zone that ages in time and intensifies visually"
extendTip = "Extends current zones right"
lLabTip = "Show labels for price levels extended off Key Levels"
dhighsTip = "Disabling will prevent highs from being tracked"
dlowsTip = "Disabling will prevent lows from being tracked"
detectBOTip = "Show points that price action breaks above all pivots. An arrow from below is displayed"
detectBDTip = "Show points that price action breaks below all pivots. An arrow from above is displayed"
breakUpTip = "Show points that price action breaks above resistance. An arrow from below is displayed"
breakDnTip = "Show points that price action breaks below support. An arrow from above is displayed"
falseBullTip = "Show points that price action initially breaks below support before reversing. False moves can lead to fast moves in the opposite direction (bear trap). A large arrow from below is displayed"
falseBearTip = "Show points that price action initially breaks above resistance before reversing. False moves can lead to fast moves in the opposite direction (bull trap). A large arrow from above is displayed"
supPushTip = "Show up candles that are detected within a support zone. Can show points support is being respected. A triangle from below is displayed"
resPushTip = "Show down candles that are detected within a resistance zone. Can show points resistance is being respected. A triangle from above is displayed"
curlTip = "Show Bjorgum TSI 'curl' when candles are detected in the range of a key zone. Can show momentum shift at Key Levels. (Correlates to Bjorgum TSI indicator)"
repaintTip = "Wait for candles end before detecting patterns. False will show potential patterns forming before they are confirmed."
labelsTip = "Show a label for detected candle patterns"
sBoxTip = "Show a box around detected candle patterns"
dTip = "Detect Doji candle patterns"
beTip = "Detect Engulfing patterns"
hsTip = "Detect Hammers and Shooting Star patterns"
dgTip = "Detect Dragonfly Doji and Gravestone Doji patterns"
twTip = "Detect Tweezer Top and Tweezer Bottom patterns"
stTip = "Detect Spinning Top patterns"
pcTip = "Detect Piercing and Dark Cloud Cover patterns"
bhTip = "Detect Harami candle patterns"
lsTip = "Detect Long Upper Shadow and Long Lower Shadow patterns"
ecWickTip = "Determines if engulfing candles must engulf the wick or just the body of the preceding candle"
colorMatchTip = "Determines if hammers must be up candles and shooting stars must be down candles"
closeHalfTip = "Determines if Tweezer patterns must close beyond the half way point of the preceding candle"
atrMaxTip = "Maximum size of setup candles (as a multiplier of the current ATR)"
rejectWickTip = "The maximum wick size as a percentage of body size allowable for a rejection wick on the resolution candle of the pattern. 0 disables the filter"
hammerFibTip = "The relationship of body to candle size for hammers and stars. (ie. body is 33% of total candle size)."
hsShadowPercTip = "The maximum allowable opposing wick size as a percent of body size (ex. top wick for a hammer pattern etc.)"
hammerSizeTip = "The minimum size of hammers, stars, or long shadows as a multiplier of ATR. (To filter out tiny setups)"
dojiSizeTip = "The relationship of body to candle size (ie. body is 5% of total candle size)."
dojiWickSizeTip = "Maximum wick size comparative to the opposite wick. (eg. 2 = bottom wick must be less than or equal to 2x the top wick)."
luRatioTip = "A relationship of the upper wick to the overall candle size expressed as a percent."
lookbackTip = "Number of candles that can be included in a false break signal"
swingTip = "Swing detection is used to filter signals on breakout type signals. A higher number will mean more significant points, but less of them"
reflectTip = "Filter to ensure a setup is a significant swing point. Look back this far"
offsetTip = "Candle pattern high/low distance from absolute swing high/low. Example: 0 would filter patterns that are only the highest/lowest, 1 filters second highest over the significant length, etc."
bullPivotTip = "Color of bullish Key Levels\n(border, background)"
bearPivotTip = "Color of bearish Key Levels\n(border, background)"
breakoutTip = "Color of breakout arrows\n(bull, bear,)"
SnRTip = "Color of triangles for broken support or resistance\n(bull, bear)"
falseBreakTip = "Color of arrows for false breaks\n(bull, bear, arrow max height in pixels)"
moveTip = "Color of triangles for candles that are detected within zones\n(bull, bear)"
patTip = "Color of boxes that wrap candestick patterns\nBackgrounds: (bull, neutral, bear)\nBorders: (bull, neutral, bear)"
labTip = "Color of labels that mark candestick patterns\nText: (bull, neutral, bear)\nLabels: (bull, neutral, bear)"
stratTip = "TSI speed control presets. Both speeds correlate to the Bjorgum TSI indicator"
// ================================== //
// ---------> User Input <----------- //
// ================================== //
left = input.int (20 , "Look Left" , group= "Zones" , tooltip= leftTip )
right = input.int (15 , "Look Right" , group= "Zones" , tooltip= rightTip )
nPiv = input.int (1 , "Number of Pivots" , group= "Zones" , tooltip= nPivTip )
atrLen = input.int (30 , "ATR Length" , group= "Zones" , tooltip= atrLenTip )
mult = input.float (0.5 , "Zone Width (ATR)" , group= "Zones" , tooltip= multTip , step = 0.1)
per = input.float (5 , "Max Zone Percent" , group= "Zones" , tooltip= perTip )
max = input.float (10 , "Max Boxes for Patterns" , group= "Zones" , tooltip= maxTip )
fut = input.int (30 , "Offset For Labels" , group= "Zones" , tooltip= futTip )
src = input.string ("HA" , "Source For Pivots" , group= "Zones" , tooltip= srcTip , options= ["HA", "High/Low Body", "High/Low"])
alignZones = input.bool (true , "Align Zones" , group= "Zones" , tooltip= alignZonesTip )
extend = input.bool (false , "Extend Right" , group= "Zones" , tooltip= extendTip )
lLab = input.bool (false , "Show Level Labels" , group= "Zones" , tooltip= lLabTip )
dhighs = input.bool (true , "Detect Pivot Highs" , group= "Detection" , tooltip= dhighsTip )
dlows = input.bool (true , "Detect Pivot Lows" , group= "Detection" , tooltip= dlowsTip )
detectBO = input.bool (false , "Detect Breakout" , group= "Detection" , tooltip= detectBOTip )
detectBD = input.bool (false , "Detect Breakdown" , group= "Detection" , tooltip= detectBDTip )
breakUp = input.bool (false , "Detect Resistance Break" , group= "Detection" , tooltip= breakUpTip )
breakDn = input.bool (false , "Detect Support Break" , group= "Detection" , tooltip= breakDnTip )
falseBull = input.bool (false , "Detect False Breakdown" , group= "Detection" , tooltip= falseBullTip )
falseBear = input.bool (false , "Detect False Breakup" , group= "Detection" , tooltip= falseBearTip )
supPush = input.bool (false , "Detect Moves Off Support" , group= "Detection" , tooltip= supPushTip )
resPush = input.bool (false , "Detect Moves Off Resistance" , group= "Detection" , tooltip= resPushTip )
curl = input.bool (false , "Detect TSI Curl" , group= "Detection" , tooltip= curlTip )
repaint = input.bool (true , "Wait For Confirmed Bar" , group= "Candle Patterns" , tooltip= repaintTip )
labels = input.bool (false , "Show Label" , group= "Candle Patterns" , tooltip= labelsTip )
sBox = input.bool (false , "Show Boxes Around Patterns" , group= "Candle Patterns" , tooltip= sBoxTip )
d_ = input.bool (false , "Detect Doji" , group= "Candle Patterns" , tooltip= dTip )
be_ = input.bool (false , "Detect Engulfing" , group= "Candle Patterns" , tooltip= beTip )
hs_ = input.bool (false , "Detect Hammers and Stars" , group= "Candle Patterns" , tooltip= hsTip )
dg_ = input.bool (false , "Detect Dragons and Graves" , group= "Candle Patterns" , tooltip= dgTip )
tw_ = input.bool (false , "Detect Tweezers" , group= "Candle Patterns" , tooltip= twTip )
st_ = input.bool (false , "Detect Spinning Top" , group= "Candle Patterns" , tooltip= stTip )
pc_ = input.bool (false , "Detect Piercing and Clouds" , group= "Candle Patterns" , tooltip= pcTip )
bh_ = input.bool (false , "Detect Harami" , group= "Candle Patterns" , tooltip= bhTip )
ls_ = input.bool (false , "Detect Long Shadows" , group= "Candle Patterns" , tooltip= lsTip )
alertMode = input.string (alert.freq_once_per_bar_close , "Alerts Mode" , group = "Alert Frequency" , options= [alert.freq_once_per_bar, alert.freq_once_per_bar_close])
ecWick = input.bool (false , "Engulfing Must Engulf Wick" , group= "Candle Filters" , tooltip= ecWickTip )
colorMatch = input.bool (false , "H&S Must Match Color" , group= "Candle Filters" , tooltip= colorMatchTip )
closeHalf = input.bool (false , "Tweezer Close Over Half" , group= "Candle Filters" , tooltip= closeHalfTip )
atrMax = input.float (0.0 , "Max Candle Size (≠ ATR)" , group= "Candle Filters" , tooltip= atrMaxTip , step= 0.1 )
rejectWickMax = input.float (0.0 , "[EC] Max Reject Wick Size" , group= "Candle Filters" , tooltip= rejectWickTip , step= 1 )
hammerFib = input.float (33 , "[HS] H&S Ratio (%)" , group= "Candle Filters" , tooltip= hammerFibTip , step= 1 )
hsShadowPerc = input.float (5 , "[HS] H&S Opposing Shadow (%)" , group= "Candle Filters" , tooltip= hsShadowPercTip , step= 1 )
hammerSize = input.float (0.1 , "[HS] H&S Min Size (≠ ATR)" , group= "Candle Filters" , tooltip= hammerSizeTip , step= 0.1 )
dojiSize = input.float (5 , "[DJ] Doji Size (%)" , group= "Candle Filters" , tooltip= dojiSizeTip , step= 1 )
dojiWickSize = input.float (2 , "[DJ] Max Doji Wick Size" , group= "Candle Filters" , tooltip= dojiWickSizeTip , step= 1 )
luRatio = input.float (75 , "[LS] Long Shadow (%)" , group= "Candle Filters" , tooltip= luRatioTip , step= 1 )
lookback = input.int (2 , "Lookback For Breaks" , group= "Lookback" , tooltip= lookbackTip )
swing = input.int (5 , "swing High/Low" , group= "Lookback" , tooltip= swingTip )
reflect = input.int (10 , "Significant High/Low" , group= "Lookback" , tooltip= reflectTip )
offset = input.int (1 , "Consider Bar From High/Low" , group= "Lookback" , tooltip= offsetTip )
bullBorder = input.color (color.new(#7ec4fd, 0), "", inline= "0" , group= "Pivot Color" )
bullBgCol = input.color (color.new (#64b5f6, 95), "", inline= "0" , group= "Pivot Color" , tooltip= bullPivotTip )
bearBorder = input.color (color.new(#f7ea7e, 0), "", inline= "1" , group= "Pivot Color" )
bearBgCol = input.color (color.new (#ffeb3b, 95), "", inline= "1" , group= "Pivot Color" , tooltip= bearPivotTip )
upCol = input.color (color.new (#ff6d00, 25), "", inline= "2" , group= "Breakout Color" )
dnCol = input.color (color.new (#ff00ff, 25), "", inline= "2" , group= "Breakout Color" , tooltip= breakoutTip )
supCol = input.color (color.new (#17ff00, 25), "", inline= "3" , group= "S&R Break Color" )
resCol = input.color (color.new (#ff0000, 25), "", inline= "3" , group= "S&R Break Color" , tooltip= SnRTip )
fBull = input.color (color.new (#17ff00, 25), "", inline= "4" , group= "False Break Color" )
fBear = input.color (color.new (#ff0000, 25), "", inline= "4" , group= "False Break Color" )
arrowMax = input.int (75 , "", inline= "4" , group= "False Break Color" , tooltip= falseBreakTip )
moveBullCol = input.color (color.new(#957af7, 1), "", inline= "5" , group= "Moves From S&R Color" )
moveBearCol = input.color (color.new(#f8eb79, 1), "", inline= "5" , group= "Moves From S&R Color" , tooltip= moveTip )
curlBullCol = input.color (color.new (#17ff00, 40), "", inline= "6" , group= "Momentum Curl Color" )
curlBearCol = input.color (color.new (#f3ff00, 40), "", inline= "6" , group= "Momentum Curl Color" , tooltip= curlTip )
patBullBg = input.color (color.new (#17ff00, 90), "", inline= "7" , group= "Pattern Box Color" )
patNeutBg = input.color (color.new (#b2b5be, 90), "", inline= "7" , group= "Pattern Box Color" )
patBearBg = input.color (color.new (#ff0000, 90), "", inline= "7" , group= "Pattern Box Color" )
patBullBo = input.color (color.new (#17ff00, 80), "", inline= "8" , group= "Pattern Box Color" )
patNeutBo = input.color (color.new (#b2b5be, 80), "", inline= "8" , group= "Pattern Box Color" )
patBearBo = input.color (color.new (#ff0000, 80), "", inline= "8" , group= "Pattern Box Color" , tooltip= patTip )
textBullCol = input.color (color.new (#17ff00, 0), "", inline= "9" , group= "Label Color (Text/Bg)" )
textNeutCol = input.color (color.new (#b2b5be, 0), "", inline= "9" , group= "Label Color (Text/Bg)" )
textBearCol = input.color (color.new (#ff0000, 0), "", inline= "9" , group= "Label Color (Text/Bg)" )
labBullCol = input.color (color.new (#17ff00, 80), "", inline= "10" , group= "Label Color (Text/Bg)" )
labNeutCol = input.color (color.new (#b2b5be, 80), "", inline= "10" , group= "Label Color (Text/Bg)" )
labBearCol = input.color (color.new (#ff0000, 80), "", inline= "10" , group= "Label Color (Text/Bg)", tooltip= labTip )
strat = input.string ("Fast" , "Select a Speed" , group= "TSI Speed Control" , tooltip= stratTip , options= ["Fast", "Slow"])
longf = input.int (25 , "Long Length" , group= "TSI Fast Settings" )
shortf = input.int (5 , "Short Length" , group= "TSI Fast Settings" )
signalf = input.int (14 , "Signal Length" , group= "TSI Fast Settings" )
longs = input.int (25 , "Long Length" , group= "TSI Slow Settings" )
shorts = input.int (13 , "Short Length" , group= "TSI Slow Settings" )
signals = input.int (13 , "Signal Length" , group= "TSI Slow Settings" )
// ================================== //
// -----> Immutable Constants <------ //
// ================================== //
sync = bar_index
labUp = label.style_label_up
labDn = label.style_label_down
confirmed = barstate.isconfirmed
extrap = extend ? extend.right : extend.none
var pivotHigh = array.new_box (nPiv)
var pivotLows = array.new_box (nPiv)
var highBull = array.new_bool (nPiv)
var lowsBull = array.new_bool (nPiv)
var boxes = array.new_box ()
haSrc = src == "HA"
hiLoSrc = src == "High/Low"
tsifast = strat == "Fast"
tsislow = strat == "Slow"
// ================================== //
// ---> Functional Declarations <---- //
// ================================== //
perMax = close* 0.02
min = math.min (perMax, atr*0.3)
_haBody() =>
haClose = (open + high + low + close) / 4
haOpen = float(na)
haOpen := na(haOpen[1]) ? (open + close) / 2 :
(nz(haOpen[1]) + nz(haClose[1])) / 2
[haOpen, haClose]
_extend(_x) =>
for i = 0 to array.size (_x)-1
box.set_right (array.get (_x, i), sync)
_arrayLoad(_x, _max, _val) =>
array.unshift (_x, _val)
if array.size (_x) > _max
array.pop (_x)
_arrayBox(_x, _max, _val) =>
array.unshift (_x, _val)
if array.size (_x) > _max
_b = array.pop (_x)
if extend
box.set_extend (_b, extend.none)
_arrayWrap(_x, _max, _val) =>
array.unshift (_x, _val)
if array.size (_x) > _max
box.delete(array.pop (_x))
_delLab(_x) =>
if array.size(_x) > 0
label.delete (array.pop (_x))
_delLine(_x) =>
if array.size(_x) > 0
line.delete (array.pop (_x))
_delLevels(_x, _y) =>
for i = 0 to array.size (_x)-1
_delLab (_x)
_delLine (_y)
_box(_x1, _t, _r, _b, _boCol, _bgCol, _e) =>
box.new( _x1, _t, _r, _b ,
xloc = xloc.bar_index ,
extend = _e ,
border_color= _boCol ,
bgcolor = _bgCol )
_wrap(_cond, _x, _bb, _bc, _bgc) =>
_t = ta.highest (high, _bb) + min
_b = ta.lowest (low , _bb) - min
_l = bar_index - _bb
_r = bar_index + 1
if _cond
_arrayWrap (_x, max, _box (_l, _t, _r, _b, _bc, _bgc, extend.none))
_getBox(_x,_i) =>
_box = array.get (_x,_i)
_t = box.get_top (_box)
_b = box.get_bottom (_box)
[_t, _b]
_align(_x,_y) =>
for i = 0 to array.size (_x) -1
[_T, _B] = _getBox (_y, 0)
[_t, _b] = _getBox (_x, i)
if _T > _b and _T < _t or
_B < _t and _B > _b or
_T > _t and _B < _b or
_B > _b and _T < _t
box.set_top (array.get (_y, 0), _t)
box.set_bottom (array.get (_y, 0), _b)
_color(_x, _y) =>
var int _track = nPiv
for i = 0 to array.size (_x) -1
[t_, b_] = _getBox (_x, i)
_isBull = array.get (_y, i)
if close > t_ and not _isBull
box.set_extend( array.get (_x, i), extend.none)
array.set(_x, i, _box (sync , t_, sync, b_, bullBorder, bullBgCol, extrap))
array.set(_y, i, true)
_track += 1
if close < b_ and _isBull
box.set_extend( array.get (_x, i), extend.none)
array.set(_x, i, _box (sync , t_, sync, b_, bearBorder, bearBgCol, extrap))
array.set(_y, i, false)
_track -= 1
_track
_detect(_x,_y) =>
int _i = 0
bool _found = false
bool _isBull = na
while (not _found and _i < array.size (_x) )
[t_, b_] = _getBox (_x,_i)
if low < t_ and high > b_
_isBull := array.get (_y,_i)
_found := true
_i += 1
[_found, _isBull]
_falseBreak(_l) =>
bool _d = false
bool _u = false
for i = 1 to lookback
if _l[i] < _l and _l[i+1] >= _l and _l[1] < _l
_d := true
if _l[i] > _l and _l[i+1] <= _l and _l[1] > _l
_u := true
[_d, _u]
_numLevel(_x,_y) =>
int _above = 0
int _fill = 0
for i = 0 to array.size (_x)-1
_isBull = array.get (_x,i)
if _isBull
_above += 1
if not na(_isBull)
_fill += 1
for i = 0 to array.size (_y)-1
_isBull = array.get (_y,i)
if _isBull
_above += 1
if not na(_isBull)
_fill += 1
[_above, _fill]
_check(_src,_l) =>
bool _check = false
for i = 0 to _l
if _src[i]
_check := true
_check
_count(_src, _l) =>
int _result = 0
for i = 0 to _l
if _src > _src[i]
_result += 1
_result
_label(_x, _y, y, _s, _col1, _col2) =>
transp = math.min (color.t(_col1), color.t(_col2))
array.unshift (_x, label.new (sync+fut, y ,
text = str.tostring(math.round_to_mintick(y) ),
color = color.new(_col1, transp) ,
style = _s ,
textcolor = color.white ))
if not extend and fut > 0
array.unshift (_y, line.new (sync, y, sync+fut, y, color= color.new(_col1, transp)))
_level(_x, _y) =>
var label [] lab = array.new_label (nPiv)
var line [] lines = array.new_line (nPiv)
if barstate.islast and lLab
_delLevels (lab, lines)
for i = 0 to array.size (_x)-1
[_t, _b] = _getBox (_x,i)
_isBull = array.get (_y,i)
_col1 = _isBull ? bullBgCol : bearBgCol
_col2 = _isBull ? bullBorder : bearBorder
if close > _t
_label (lab, lines, _t, labUp, _col1, _col2)
if close < _b
_label (lab, lines, _b, labDn, _col1, _col2)
if close < _t and close > _b
_label (lab, lines, _t, labDn, _col1, _col2)
_label (lab, lines, _b, labUp, _col1, _col2)
_alert(_x, _y) =>
if _x
alert (_y + timeframe.period + ' chart. Price is ' + str.tostring(close), alertMode)
// ================================== //
// ----> Variable Calculations <----- //
// ================================== //
shortvar = tsifast ? shortf : shorts
longvar = tsifast ? longf : longs
signalvar = tsifast ? signalf : signals
tsi = ta.tsi (close, shortvar, longvar)
tsl = ta.ema (tsi, signalvar)
highest = close == ta.highest (close, right)
lowest = close == ta.lowest (close, right)
closeLows = ta.lowest (close, swing)
closeHigh = ta.highest (close, swing)
numLows = _count (low, reflect)
numHigh = _count (high, reflect)
[open_, close_] = _haBody ()
hiHaBod = math.max (close_, open_)
loHaBod = math.min (close_, open_)
hiBod = math.max (close, open)
loBod = math.min (close, open)
srcHigh = haSrc ? hiHaBod : hiLoSrc ? high : hiBod
srcLow = haSrc ? loHaBod : hiLoSrc ? low : loBod
pivot_high = ta.pivothigh (srcHigh, left, right)
pivot_low = ta.pivotlow (srcLow, left, right)
perc = close* (per/100)
band = math.min (atr*mult, perc) [right] /2
HH = pivot_high+ band
HL = pivot_high- band
LH = pivot_low+ band
LL = pivot_low- band
coDiff = close - open
// ================================== //
// --------> Logical Order <--------- //
// ================================== //
if pivot_high and dhighs and confirmed
_arrayLoad (highBull , nPiv, false)
_arrayBox (pivotHigh, nPiv, _box(sync[right], HH, sync, HL, bearBorder, bearBgCol, extrap))
if pivot_low and dlows and confirmed
_arrayLoad (lowsBull , nPiv, true)
_arrayBox (pivotLows, nPiv, _box(sync[right], LH, sync, LL, bullBorder, bullBgCol, extrap))
if alignZones
_align (pivotHigh, pivotHigh)
_align (pivotHigh, pivotLows)
_align (pivotLows, pivotLows)
_align (pivotLows, pivotHigh)
_extend (pivotHigh)
_extend (pivotLows)
trackHigh = _color (pivotHigh, highBull)
trackLows = _color (pivotLows, lowsBull)
// ================================== //
// ----> Conditional Parameters <---- //
// ================================== //
isLows = closeLows == close
isHigh = closeHigh == close
wasLows = _check (isLows, lookback)
wasHigh = _check (isHigh, lookback)
[above, total] = _numLevel (highBull, lowsBull)
moveAbove = trackHigh > trackHigh[1]
moveBelow = trackLows < trackLows[1]
resBreak = (trackLows > trackLows[1] or moveAbove)
supBreak = (trackHigh < trackHigh[1] or moveBelow)
breakOut = moveAbove and highest and above == total
breakDwn = moveBelow and lowest and above == 0
[dh, uh] = _falseBreak (trackHigh)
[dl, ul] = _falseBreak (trackLows)
falseBreakBull = wasLows and (dh or dl)
falseBreakBear = wasHigh and (uh or ul)
[fh,hb] = _detect (pivotHigh, highBull)
[fl,lb] = _detect (pivotLows, lowsBull)
bull = (fh or fl) and (hb or lb)
bear = (fh or fl) and not (hb or lb)
bullCheck = not resBreak and not resBreak[1] and (fh or fl) and close > open and (hb or lb)
bearCheck = not supBreak and not supBreak[1] and (fh or fl) and close < open and not (hb or lb)
highrange = reflect-offset
lowsrange = offset
sigLows = numLows <= lowsrange
sigHigh = numHigh >= highrange
isBull1 = sigLows and bull
isBear1 = sigHigh and bear
isBull2 = (sigLows or sigLows[1]) and (bull or bull[1])
isBear2 = (sigHigh or sigHigh[1]) and (bear or bear[1])
data = tsi > tsi[1] and tsi < tsl
dtat = tsi < tsi[1] and tsi > tsl
hMatch = not colorMatch or close > open
sMatch = not colorMatch or close < open
hsFilter = bj.barRange() >= hammerSize * atr
atrMaxSize = bj.barRange() <= atrMax * atr or atrMax == 0.0
rp = confirmed or not repaint
// ================================== //
// -----> Pattern Recognition <------ //
// ================================== //
dw = isBull1 and rp and d_ and atrMaxSize and bj.doji (dojiSize = dojiSize, dojiWickSize = dojiWickSize)
db = isBear1 and rp and d_ and atrMaxSize and bj.doji (dojiSize = dojiSize, dojiWickSize = dojiWickSize)
bew = isBull2 and rp and be_ and atrMaxSize and bj.bullEngulf (maxRejectWick = rejectWickMax, mustEngulfWick = ecWick)
beb = isBear2 and rp and be_ and atrMaxSize and bj.bearEngulf (maxRejectWick = rejectWickMax, mustEngulfWick = ecWick)
h = isBull1 and rp and hs_ and atrMaxSize and bj.hammer (ratio = hammerFib, shadowPercent = hsShadowPerc) and hsFilter and hMatch
ss = isBear1 and rp and hs_ and atrMaxSize and bj.star (ratio = hammerFib, shadowPercent = hsShadowPerc) and hsFilter and sMatch
dd = isBull1 and rp and dg_ and atrMaxSize and bj.dragonflyDoji ()
gd = isBear1 and rp and dg_ and atrMaxSize and bj.gravestoneDoji ()
tb = isBull2 and rp and tw_ and atrMaxSize and bj.tweezerBottom (closeUpperHalf = closeHalf)
tt = isBear2 and rp and tw_ and atrMaxSize and bj.tweezerTop (closeLowerHalf = closeHalf)
stw = isBull1 and rp and st_ and atrMaxSize and bj.spinningTop ()
stb = isBear1 and rp and st_ and atrMaxSize and bj.spinningTop ()
p = isBull1 and rp and pc_ and atrMaxSize and bj.piercing ()
dcc = isBear1 and rp and pc_ and atrMaxSize and bj.darkCloudCover ()
bhw = isBull1 and rp and bh_ and atrMaxSize and bj.haramiBull ()
bhb = isBear1 and rp and bh_ and atrMaxSize and bj.haramiBear ()
ll = isBull1 and rp and ls_ and atrMaxSize and bj.lls (ratio = luRatio) and hsFilter
lu = isBear1 and rp and ls_ and atrMaxSize and bj.lus (ratio = luRatio) and hsFilter
// ================================== //
// ------> Graphical Display <------- //
// ================================== //
plotFalseDn = falseBull and falseBreakBull
plotFalseUp = falseBear and falseBreakBear
falseUpCol = plotFalseUp ? upCol : na
falseDnCol = plotFalseDn ? dnCol : na
plotBreakOut = breakOut and detectBO and not plotFalseDn
plotBreakDn = breakDwn and detectBD and not plotFalseUp
plotResBreak = resBreak and breakUp and not (plotBreakOut or plotFalseDn)
plotSupBreak = supBreak and breakDn and not (plotBreakDn or plotFalseUp)
plotBullCheck = bullCheck and supPush
plotBearCheck = bearCheck and resPush
plotCurlBull = curl and data and bull
plotCurlBear = curl and dtat and bear
plotarrow (plotFalseUp ? coDiff : na , colorup = fBull , colordown= fBear , maxheight= arrowMax)
plotarrow (plotFalseDn ? coDiff : na , colorup = fBull , colordown= fBear , maxheight= arrowMax)
plotshape (plotBreakOut , style=shape.arrowup , location=location.belowbar, color= upCol , size= size.small)
plotshape (plotBreakDn , style=shape.arrowdown , location=location.abovebar, color= dnCol , size= size.small)
plotshape (plotResBreak , style=shape.arrowup , location=location.belowbar, color= supCol, size= size.small)
plotshape (plotSupBreak , style=shape.arrowdown , location=location.abovebar, color= resCol, size= size.small)
plotshape (plotBullCheck , style=shape.triangleup , location=location.belowbar, color= moveBullCol)
plotshape (plotBearCheck , style=shape.triangledown, location=location.abovebar, color= moveBearCol)
plotshape (plotCurlBull , style=shape.triangleup , location=location.belowbar, color= curlBullCol)
plotshape (plotCurlBear , style=shape.triangledown, location=location.abovebar, color= curlBearCol)
bj.dLab (dw and labels, labNeutCol, textNeutCol), _wrap (dw and sBox, boxes, 1, patNeutBo, patNeutBg)
bj.bewLab (bew and labels, labBullCol, textBullCol), _wrap (bew and sBox, boxes, 2, patBullBo, patBullBg)
bj.hLab (h and labels, labBullCol, textBullCol), _wrap (h and sBox, boxes, 1, patBullBo, patBullBg)
bj.ddLab (dd and labels, labBullCol, textBullCol), _wrap (dd and sBox, boxes, 1, patBullBo, patBullBg)
bj.tbLab (tb and labels, labBullCol, textBullCol), _wrap (tb and sBox, boxes, 2, patBullBo, patBullBg)
bj.stwLab (stw and labels, labNeutCol, textNeutCol), _wrap (stw and sBox, boxes, 1, patBullBo, patNeutBg)
bj.pLab (p and labels, labBullCol, textBullCol), _wrap (p and sBox, boxes, 2, patBullBo, patBullBg)
bj.hwLab (bhw and labels, labBullCol, textBullCol), _wrap (bhw and sBox, boxes, 2, patBullBo, patBullBg)
bj.llsLab (ll and labels, labBullCol, textBullCol), _wrap (ll and sBox, boxes, 1, patBullBo, patBullBg)
bj.dLab (db and labels, labNeutCol, textNeutCol), _wrap (db and sBox, boxes, 1, patNeutBo, patNeutBg)
bj.bebLab (beb and labels, labBearCol, textBearCol), _wrap (beb and sBox, boxes, 2, patBearBo, patBearBg)
bj.ssLab (ss and labels, labBearCol, textBearCol), _wrap (ss and sBox, boxes, 1, patBearBo, patBearBg)
bj.gdLab (gd and labels, labBearCol, textBearCol), _wrap (gd and sBox, boxes, 1, patBearBo, patBearBg)
bj.ttLab (tt and labels, labBearCol, textBearCol), _wrap (tt and sBox, boxes, 2, patBearBo, patBearBg)
bj.stbLab (stb and labels, labNeutCol, textNeutCol), _wrap (stb and sBox, boxes, 1, patBearBo, patBearBg)
bj.dccLab (dcc and labels, labBearCol, textBearCol), _wrap (dcc and sBox, boxes, 2, patBearBo, patBearBg)
bj.hbLab (bhb and labels, labBearCol, textBearCol), _wrap (bhb and sBox, boxes, 2, patBearBo, patBearBg)
bj.lusLab (lu and labels, labBearCol, textBearCol), _wrap (lu and sBox, boxes, 1, patBearBo, patBearBg)
_level (pivotHigh, highBull)
_level (pivotLows, lowsBull)
// ================================== //
// -----> Alert Functionality <------ //
// ================================== //
alertcondition (resBreak , 'Resistance break' , 'Resistance broke on {{interval}} chart. Price is {{close}}' )
alertcondition (supBreak , 'Support break' , 'Support broke on {{interval}} chart. Price is {{close}}' )
alertcondition (bullCheck , 'Found support' , 'Pushing Off Key Level Support on {{interval}} chart. Price is {{close}}' )
alertcondition (bearCheck , 'Found resistance' , 'Pushing Off Key Level Resistance on {{interval}} chart. Price is {{close}}' )
alertcondition (falseBreakBull , 'False break down' , 'False Break Down on {{interval}} chart. Price is {{close}}' )
alertcondition (falseBreakBear , 'False break up' , 'False Break Up on {{interval}} chart. Price is {{close}}' )
alertcondition (breakOut , 'Breakout' , 'Breakout on {{interval}} chart. Price is {{close}}' )
alertcondition (breakDwn , 'Breakdown' , 'Breakdown on {{interval}} chart. Price is {{close}}' )
_alert (plotResBreak , 'Resistance broke on ' )
_alert (plotSupBreak , 'Support break ' )
_alert (plotBullCheck , 'Pushing off key level support on ' )
_alert (plotBearCheck , 'Pushing off key level resistance on ' )
_alert (plotFalseDn , 'False break down on ' )
_alert (plotFalseUp , 'False break up on ' )
_alert (plotBreakOut , 'Breakout on ' )
_alert (plotBreakDn , 'Breakdown on ' )
_alert (dw , 'Doji at support on ' )
_alert (db , 'Doji at resistance on ' )
_alert (bew , 'Bullish Engulfing on ' )
_alert (beb , 'Bearish Engulfing on ' )
_alert (h , 'Hammer candle on ' )
_alert (ss , 'Shooting star on ' )
_alert (dd , 'Dragonfly Doji on ' )
_alert (gd , 'Gravestone Doji on ' )
_alert (tb , 'Tweezer Bottom on ' )
_alert (tt , 'Tweezer Top on ' )
_alert (stw , 'White Spinning Top on ' )
_alert (stb , 'Black Spinning Top on ' )
_alert (p , 'Piercing on ' )
_alert (dcc , 'Dark Cloud Cover on ' )
_alert (bhw , 'Bullish Harami on ' )
_alert (bhb , 'Bearish Harami on ' )
_alert (ll , 'Long Lower Shadow on ' )
_alert (lu , 'Long Upper Shadow on ' )
//
//Directions
directions = input.bool(true, title="If you change the Place On The List number, you can reorder the indicators to suit your preferences. Make sure that you change the position number for BOTH indicators for it to show up properly. For example: If you change MACD to position 3, make sure to change whatever indicator is in position 3 to the number that the MACD was before so they switch places(do this even if one of them is turned off). You can also turn off each individual indicator so it only shows the ones you want.")
//Table On/Off
infoDataTableOn = input.bool(true, title="??????? On/Off", group="Info ???????")
//Table Positions
bright = position.bottom_right
bleft = position.bottom_left
bcenter = position.bottom_center
tright = position.top_right
tleft = position.top_left
tcenter = position.top_center
mright = position.middle_right
mleft = position.middle_left
mcenter = position.middle_center
itablePosition = input.string(bright, title="1", options=[bright, bleft, bcenter, tright, tleft, tcenter, mright, mleft, mcenter], group="Info ???????")
//Lengths
macdOn = input.bool(true, title="Turn MACD Label On/Off", group="MACD Settings")
macdOrder = input.int(1, title="Place On The List", minval=1, maxval=9, group="MACD Settings")
macdFast = input.int(12, title="MACD Fast Length", minval=2, group="MACD Settings")
macdSlow = input.int(26, title="MACD Slow Length", minval=2, group="MACD Settings")
macdSignal = input.int(9, title="MACD Signal Length", minval=2, group="MACD Settings")
stochasticOn = input.bool(true, title="Turn Stochstic RSI Label On/Off", group="Stochastic RSI Settings")
stochasticOrder = input.int(2, title="Place On The List", minval=1, maxval=9, group="Stochastic RSI Settings")
smoothK = input.int(3, "K Value - Stochastic RSI", minval=2, group="Stochastic RSI Settings")
smoothD = input.int(3, "D Value - Stochastic RSI", minval=2, group="Stochastic RSI Settings")
lengthRSI = input.int(14, "Stochastic RSI Length", minval=2, group="Stochastic RSI Settings")
lengthStoch = input.int(14, "Stochastic Length", minval=2, group="Stochastic RSI Settings")
vortexOn = input.bool(true, title="Turn Vortex Label On/Off", group="Vortex Settings")
vortexOrder = input.int(3, title="Place On The List", minval=1, maxval=9, group="Vortex Settings")
vortexLength = input.int(14, title="Vortex Length", minval=2, group="Vortex Settings")
momOn = input.bool(true, title="Turn Momentum Label On/Off", group="Momentum Settings")
momOrder = input.int(4, title="Place On The List", minval=1, maxval=9, group="Momentum Settings")
momLength = input.int(14, title="Momentum Length", minval=2, group="Momentum Settings")
rsiOn = input.bool(true, title="Turn RSI Label On/Off", group="RSI Settings")
rsiOrder = input.int(5, title="Place On The List", minval=1, maxval=9, group="RSI Settings")
rsiLength = input.int(14, title="Relative Strength Index Length", minval=2, group="RSI Settings")
psarOn = input.bool(true, title="Turn PSAR Label On/Off", group="PSAR Settings")
psarOrder = input.int(6, title="Place On The List", minval=1, maxval=9, group="PSAR Settings")
psarStart = input.float(.02, title="PSAR Start", minval=.01, group="PSAR Settings")
psarInc = input.float(.02, title="PSAR Increment", minval=.01, group="PSAR Settings")
psarMax = input.float(.2, title="PSAR Max", minval=.01, group="PSAR Settings")
dmiOn = input.bool(true, title="Turn DMI Label On/Off", group="DMI Settings")
dmiOrder = input.int(7, title="Place On The List", minval=1, maxval=9, group="DMI Settings")
dmiLength = input.int(14, title="DMI Length", minval=2, group="DMI Settings")
dmiSmooth = input.int(14, title="DMI Smoothing", minval=2, group="DMI Settings")
mfiOn = input.bool(true, title="Turn Money Flow Index Label On/Off", group="Money Flow Index Settings")
mfiOrder = input.int(8, title="Place On The List", minval=1, maxval=9, group="Money Flow Index Settings")
mfiLength = input.int(14, title="Money Flow Index Length", minval=2, group="Money Flow Index Settings")
fisherOn = input.bool(true, title="Turn Fisher Label On/Off", group="Fisher Settings")
fisherOrder = input.int(9, title="Place On The List", minval=1, maxval=9, group="Fisher Settings")
fisherLength = input.int(14, title="Fisher Length", minval=2, group="Fisher Settings")
//Fisher Transform
high_ = ta.highest(hl2, fisherLength)
low_ = ta.lowest(hl2, fisherLength)
round_(val) => val > .99 ? .999 : val < -.99 ? -.999 : val
value = 0.0
value := round_(.66 * ((hl2 - low_) / (high_ - low_) - .5) + .67 * nz(value[1]))
fish1 = 0.0
fish1 := .5 * math.log((1 + value) / (1 - value)) + .5 * nz(fish1[1])
fish2 = fish1[1]
//Stochastic RSI
rsi1 = ta.rsi(close, lengthRSI)
k = ta.sma(ta.stoch(rsi1, rsi1, rsi1, lengthStoch), smoothK)
d = ta.sma(k, smoothD)
//Vortex
VMP = math.sum( math.abs( high - low[1]), vortexLength)
VMM = math.sum( math.abs( low - high[1]), vortexLength)
STR = math.sum( ta.atr(1), vortexLength)
VIP = VMP / STR
VIM = VMM / STR
//DMI
[diplus, diminus, adx] = ta.dmi(dmiLength, dmiSmooth)
//PSAR
psar = ta.sar(psarStart, psarInc, psarMax)
//Momentum
mom = ta.mom(close, momLength)
//Money Flow Index
mfi = ta.mfi(close, mfiLength)
//RSI
rsi = ta.rsi(close, rsiLength)
//MACD
[macdLine, signalLine, histLine] = ta.macd(close, macdFast, macdSlow, macdSignal)
//Create MACD indicator label table data
macdIndicatorLabel = ' MACD wait '
macdLabel = color.blue
if macdLine > signalLine
macdLabel := color.lime
macdIndicatorLabel := " MACD buy "
else if macdLine < signalLine
macdLabel := color.red
macdIndicatorLabel := " MACD sell "
//Create Stochastic RSI indicator label table data
stochIndicatorLabel = 'Stoch wait '
stochLabel = color.blue
if k > d
stochLabel := color.lime
stochIndicatorLabel := " Stoch buy "
else if k < d
stochLabel := color.red
stochIndicatorLabel := " Stoch sell "
//Create Vortex indicator label table data
vortexIndicatorLabel = ' Vortex wait '
vortexLabel = color.blue
if VIP > VIM
vortexLabel := color.lime
vortexIndicatorLabel := " Vortex buy "
else if VIP < VIM
vortexLabel := color.red
vortexIndicatorLabel := " Vortex sell "
//Create MFI indicator label table data
mfiIndicatorLabel = 'MFI wait '
mfiLabel = color.blue
if mfi > mfi[1]
mfiLabel := color.lime
mfiIndicatorLabel := " MFI buy "
else if mfi < mfi[1]
mfiLabel := color.red
mfiIndicatorLabel := " MFI sell "
//Create Fisher indicator label table data
fisherIndicatorLabel = ' Fisher wait '
fisherLabel = color.blue
if fish1 > fish2
fisherLabel := color.lime
fisherIndicatorLabel := " Fisher buy "
else if fish1 < fish2
fisherLabel := color.red
fisherIndicatorLabel := " Fisher sell "
//Create DMI indicator label table data
dmiIndicatorLabel = ' DMI wait '
dmiLabel = color.blue
if diplus > diminus
dmiLabel := color.lime
dmiIndicatorLabel := " DMI buy "
else if diplus < diminus
dmiLabel := color.red
dmiIndicatorLabel := " DMI sell "
//Create Momentum indicator label table data
momIndicatorLabel = ' Mom wait '
momLabel = color.blue
if mom > mom[1]
momLabel := color.lime
momIndicatorLabel := " Mom buy "
else if mom < mom[1]
momLabel := color.red
momIndicatorLabel := " Mom sell "
//Create PSAR indicator label table data
psarIndicatorLabel = ' PSAR wait '
psarLabel = color.blue
if close > psar
psarLabel := color.lime
psarIndicatorLabel := " PSAR buy "
else if close < psar
psarLabel := color.red
psarIndicatorLabel := " PSAR sell "
//Create RSI indicator label table data
rsiIndicatorLabel = ' RSI wait '
rsiLabel = color.blue
if rsi > rsi[1]
rsiLabel := color.lime
rsiIndicatorLabel := " RSI buy "
else if rsi < rsi[1]
rsiLabel := color.red
rsiIndicatorLabel := " RSI sell "
//Plot Price Difference Table
infoDataTable = table.new(itablePosition, columns=1, rows=10)
if infoDataTableOn and barstate.islast
table.cell(table_id=infoDataTable, column=0, row=mfiOrder, text=mfiOn ? mfiIndicatorLabel : na, height=0, text_color=color.white, text_halign=text.align_left, text_valign=text.align_top, bgcolor=mfiLabel)
table.cell(table_id=infoDataTable, column=0, row=fisherOrder, text=fisherOn ? fisherIndicatorLabel : na, height=0, text_color=color.white, text_halign=text.align_left, text_valign=text.align_top, bgcolor=fisherLabel)
table.cell(table_id=infoDataTable, column=0, row=dmiOrder, text=dmiOn ? dmiIndicatorLabel : na, height=0, text_color=color.white, text_halign=text.align_left, text_valign=text.align_top, bgcolor=dmiLabel)
table.cell(table_id=infoDataTable, column=0, row=momOrder, text=momOn ? momIndicatorLabel : na, height=0, text_color=color.white, text_halign=text.align_left, text_valign=text.align_top, bgcolor=momLabel)
table.cell(table_id=infoDataTable, column=0, row=psarOrder, text=psarOn ? psarIndicatorLabel : na, height=0, text_color=color.white, text_halign=text.align_left, text_valign=text.align_top, bgcolor=psarLabel)
table.cell(table_id=infoDataTable, column=0, row=rsiOrder, text=rsiOn ? rsiIndicatorLabel : na, height=0, text_color=color.white, text_halign=text.align_left, text_valign=text.align_top, bgcolor=rsiLabel)
table.cell(table_id=infoDataTable, column=0, row=macdOrder, text=macdOn ? macdIndicatorLabel : na, height=0, text_color=color.white, text_halign=text.align_left, text_valign=text.align_top, bgcolor=macdLabel)
table.cell(table_id=infoDataTable, column=0, row=stochasticOrder, text=stochasticOn ? stochIndicatorLabel : na, height=0, text_color=color.white, text_halign=text.align_left, text_valign=text.align_top, bgcolor=stochLabel)
table.cell(table_id=infoDataTable, column=0, row=vortexOrder, text=vortexOn ? vortexIndicatorLabel : na, height=0, text_color=color.white, text_halign=text.align_left, text_valign=text.align_top, bgcolor=vortexLabel)
table.cell(table_id=infoDataTable, column=0, row=0, text=" direction", height=0, text_color=color.white, text_halign=text.align_left, text_valign=text.align_top, bgcolor=color.purple)
//Alerts
alertcondition(rsiLabel == color.red and mfiLabel == color.red and fisherLabel == color.red and dmiLabel == color.red and momLabel == color.red and psarLabel == color.red and
macdLabel == color.red and stochLabel == color.red and vortexLabel == color.red, "All Bearish Indicators Alert", "All Bearish Indicators {{ticker}} {{interval}}")
alertcondition(rsiLabel == color.lime and mfiLabel == color.lime and fisherLabel == color.lime and dmiLabel == color.lime and momLabel == color.lime and psarLabel == color.lime and
macdLabel == color.lime and stochLabel == color.lime and vortexLabel == color.lime, "All Bullish Indicators Alert", "All Bullish Indicators {{ticker}} {{interval}}")
//
//////////////////////////////////////////////////////////////////////////////////////////
// BULB Indicator settings
recommendation = input(true, title='BULB')
rsiSource = close
rsiLength1 = 13
rsiOverbought = 65
rsiOvesold = 30
rsiValue = ta.rsi(rsiSource, rsiLength1)
isOverbought = rsiValue >= rsiOverbought
isOversold = rsiValue <= rsiOvesold
var laststate = 0
var hh = low
var ll1 = high
var label labelll = na
var label labelhh = na
var last_actual_label_hh_price = 0.0
var last_actual_label_ll_price = 0.0
obLabelText() =>
if last_actual_label_hh_price < high
'sell'
else
'sell'
osLabelText() =>
if last_actual_label_ll_price < low
'buy'
else
'buy'
createOverBoughtLabel(isIt) =>
if isIt
label.new(x=bar_index, y=na, yloc=yloc.price, style=label.style_label_down, color=#F70700, size=size.normal, text=obLabelText(), textcolor=color.white)
else
label.new(x=bar_index, y=na, yloc=yloc.price, style=label.style_label_up, color=#22E139, size=size.normal, text=osLabelText(), textcolor=color.white)
moveOversoldLabel() =>
label.set_x(labelll, bar_index)
label.set_y(labelll, low)
label.set_text(labelll, osLabelText())
moveOverBoughtLabel() =>
label.set_x(labelhh, bar_index)
label.set_y(labelhh, high)
label.set_text(labelhh, obLabelText())
if laststate == 2 and isOverbought and recommendation
hh := high
labelhh := createOverBoughtLabel(true)
last_actual_label_ll_price := label.get_y(labelll)
labelll_ts = label.get_x(labelll)
labelll_price = label.get_y(labelll)
labelll_price
if laststate == 1 and isOversold and recommendation
ll1 := low
labelll := createOverBoughtLabel(false)
last_actual_label_hh_price := label.get_y(labelhh)
labelhh_ts = label.get_x(labelhh)
labelhh_price = label.get_y(labelhh)
labelhh_price
if isOverbought and recommendation
if high >= hh
hh := high
moveOverBoughtLabel()
laststate := 1
laststate
if isOversold and recommendation
if low <= ll1
ll1 := low
moveOversoldLabel()
laststate := 2
laststate
if laststate == 1 and isOverbought and recommendation
if hh <= high
hh := high
moveOverBoughtLabel()
if laststate == 2 and isOversold and recommendation
if low <= ll1
ll1 := low
moveOversoldLabel()
if laststate == 1 and recommendation
if hh <= high
hh := high
moveOverBoughtLabel()
if laststate == 2 and recommendation
if ll1 >= low
ll1 := low
moveOversoldLabel()
// Custom ATR Bands settings
mal = input(defval=47, title='Half Length')
mva = ta.sma(close, mal)
atrl = input(defval=89, title='Atr Length')
atrv = ta.atr(atrl)
atrm = input(defval=3.0, title='Atr Multiplier')
pEnv = mva + mva * atrv / close * atrm
mEnv = mva - mva * atrv / close * atrm
plot(mva, title='Simple Moving Average', linewidth=2)
plot(pEnv, color=color.new(color.red, 0), title='High Envelope', linewidth=2)
plot(mEnv, color=color.new(color.green, 0), title='Low Envelope', linewidth=2)
How to Apply Pine Script in TradingView:
- Open TradingView and log in to your account.
- Navigate to the Pine Script Editor by:
- Clicking on the “Pine Script” tab at the bottom of the screen.
- Copy the entire Pine Script code provided.
- Paste the script into the editor.
- Click Save and provide a descriptive name for the script.
- Click Add to Chart to apply the script to your chart.
- Customize settings via the indicator settings panel to match your trading preferences.
Key Features of the Script:
- Multi-Layered Market Structure Detection:
- Identifies internal and swing market structures.
- Highlights bullish and bearish structures, including Break of Structure (BOS) and Change of Character (CHoCH).
- Smart Money Concepts (SMC):
- Detects order blocks for both internal and swing levels.
- Filters order blocks using ATR or cumulative mean range for precision.
- Trend Analysis:
- Provides colored candles to reflect real-time market trends.
- Detects strong and weak highs/lows with visual labels.
- Demand and Supply Zones:
- Highlights demand and supply zones based on user-defined parameters.
- Integrates alerts for zone hits and proximity notifications.
- Advanced Tools and Indicators:
- Displays fair value gaps (FVG) and premium/discount zones.
- Highlights equal highs/lows to identify potential liquidity zones.
- Custom Alerts:
- Alerts for various market events, including BOS, CHoCH, and zone breaches.
Recommended Usage:
- Day Trading and Scalping:
- Best for traders looking for precise entry/exit points in fast-moving markets.
- Use the script to identify significant price levels and order blocks.
- Swing Trading:
- Helps in identifying broader market structures and trends for mid-to-long-term trading strategies.
- Liquidity and Volatility Analysis:
- Ideal for detecting fair value gaps and liquidity zones, ensuring well-timed trades.
- Custom Alerts for Automation:
- Automate trade monitoring with predefined alerts for critical price actions.