RSI ALGO + EMA + SuperTrend: A Powerful Trading Indicator for Precision Entries
January 23, 2025 | by admin
Successful trading requires precision, and combining multiple indicators can help provide more accurate signals. The RSI ALGO + EMA + SuperTrend script offers a multi-dimensional approach to market analysis by integrating Relative Strength Index (RSI), Exponential Moving Averages (EMA), and SuperTrend indicators into a single comprehensive tool.
Whether you’re a scalper or swing trader, this script offers trend-following and momentum-based signals to enhance your trading strategies.
⚠ Disclaimer: No indicator guarantees profits. Use the RSI ALGO + EMA + SuperTrend script as a reference tool alongside a solid trading plan and risk management strategies.
🛠 Key Features of the RSI ALGO + EMA + SuperTrend Indicator
- Multi-Timeframe RSI Analysis:
- Analyzes RSI values across 1-minute, 15-minute, 30-minute, and 1-hour timeframes.
- Provides confirmation signals by comparing short-term and long-term RSI trends.
- Helps identify overbought and oversold conditions effectively.
- EMA Crossovers for Trend Confirmation:
- Incorporates four customizable EMAs (9, 20, 50, 200-period).
- Provides visual cues for bullish and bearish crossovers.
- Dynamic crossover alerts to notify traders of potential trend changes.
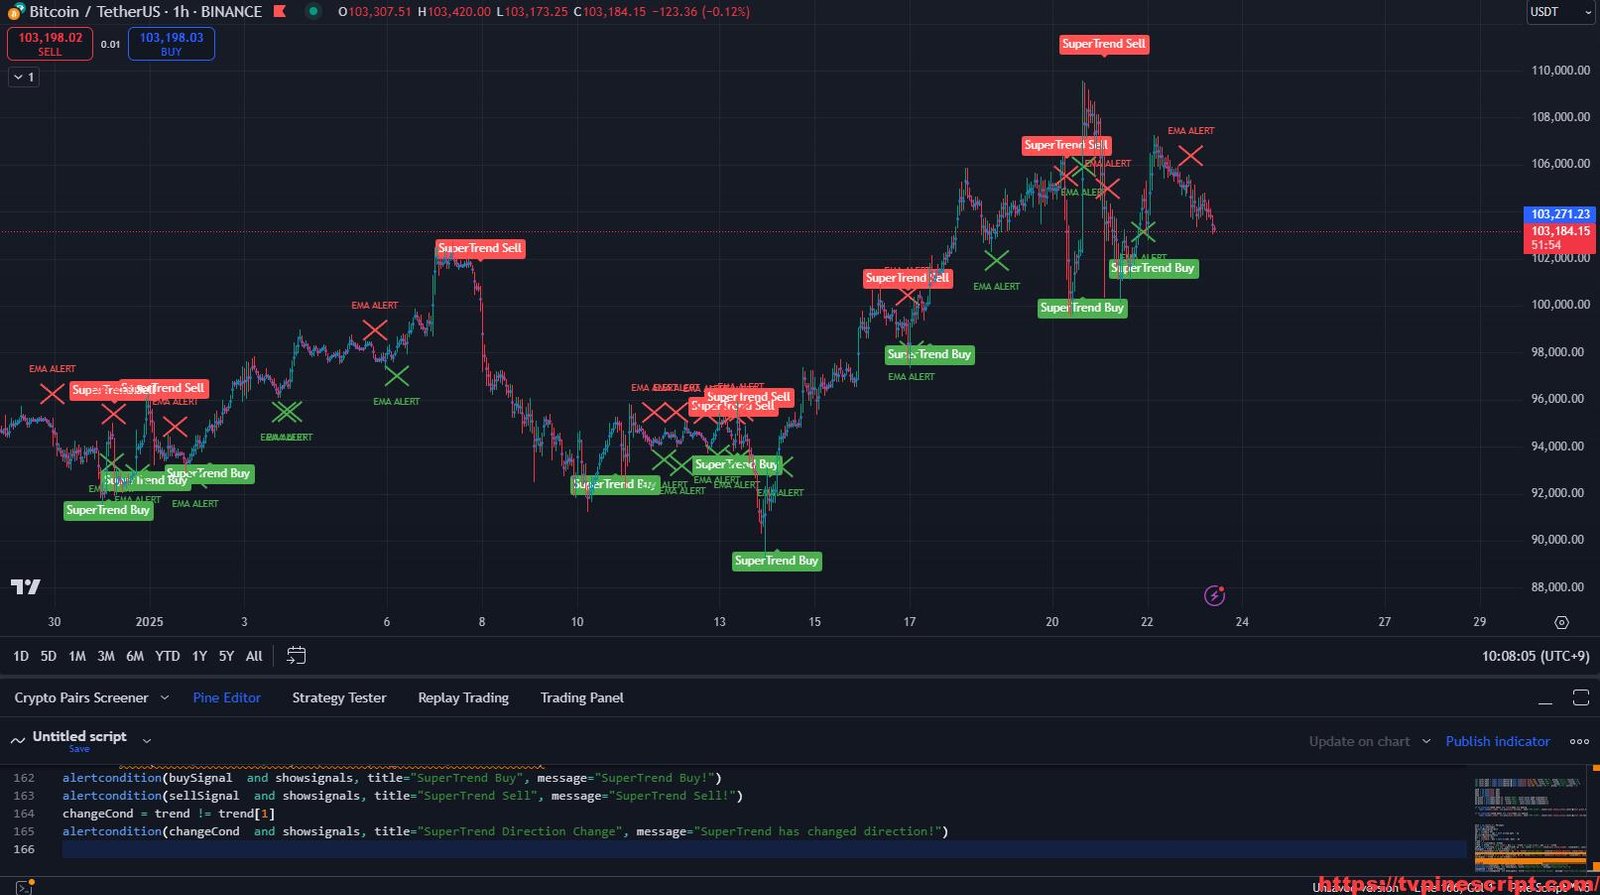
- SuperTrend Indicator Integration:
- Automatically plots support/resistance levels based on ATR values.
- Generates buy/sell signals when trend direction shifts.
- Ideal for trailing stop-loss placements and trend-following strategies.
- Customizable Alerts and Visuals:
- Alert notifications for RSI-based buy/sell signals and EMA crossovers.
- Candlestick coloring for enhanced visualization of bullish/bearish signals.
- Adjustable colors for buy/sell conditions to suit different trading styles.
- Dynamic Support and Resistance Lines:
- Plots dashed lines to highlight significant market levels.
- Continuously updates based on RSI and EMA conditions.
- Useful for setting stop-loss and take-profit levels.
- Scalable for Multiple Trading Styles:
- Suitable for scalping, day trading, and swing trading across various timeframes.
- Ideal for volatile markets such as forex, crypto, and stocks.
📊 Recommended Usage
- Scalping:
- Recommended timeframes: 1-minute to 5-minute charts.
- Utilize RSI overbought/oversold zones for quick in-and-out trades.
- Day Trading:
- Best suited for 15-minute to 1-hour charts.
- Use EMA crossovers in combination with SuperTrend signals for trend confirmation.
- Swing Trading:
- Optimal on 4-hour to daily charts.
- Leverage long-term EMA and SuperTrend signals to ride major market trends.
🔍 Script Evaluation
- Functionality: 4.7/5
The indicator combines three powerful tools into a cohesive strategy, offering strong trend identification capabilities. - Ease of Use: 4.2/5
Traders may need to adjust various settings to suit their preferences, but the overall layout is intuitive. - Accuracy: 4.5/5
The script provides reliable signals, but should be paired with volume analysis for greater confidence. - Repainting Analysis:
The script does not repaint.
All calculations are based on confirmed bar data, ensuring that signals remain consistent in real-time trading. - Optimal Timeframes:
- Scalping: 1-minute to 5-minute charts.
- Day Trading: 15-minute to 1-hour charts.
- Swing Trading: 4-hour to daily charts.
- Overall Score: 4.6/5
A versatile trading tool that provides reliable entry and exit signals across different market conditions.
// This source code is subject to the terms of the Mozilla Public License 2.0 at https://mozilla.org/MPL/2.0/
// © NIC1101

//@version=5
indicator("RSI ALGO + EMA + SuperTrend",overlay=true)

var showRSITrend= input.bool(true, title="RSI",tooltip="Developed for 1 min TF, Max 5 min",group="ALGOS")
rsi_source60 =  request.security(syminfo.tickerid,'60',close, barmerge.gaps_off, barmerge.lookahead_on)
rsi_source30 =  request.security(syminfo.tickerid,'30',close, barmerge.gaps_off, barmerge.lookahead_on)
rsi_source15 =  request.security(syminfo.tickerid,'15',close, barmerge.gaps_off, barmerge.lookahead_on)
rsi_source1 =  request.security(syminfo.tickerid,'1',close, barmerge.gaps_off, barmerge.lookahead_on)
emas = input.bool(false, title="Show EMA",group="ALGOS")
emasig = input.bool(true, title="Show EMA Crossover",group="ALGOS")

rsi_lengthR = input.int(14,title='RSI Length',group = "RSI",inline='1')

ma0 = input.int(9,title='EMA0',group = "EMA",inline='1')
ma1 = input.int(20,title='EMA1',group = "EMA",inline='1')
ma2 = input.int(50,title='EMA2',group = "EMA",inline='2')
ma3 = input.int(200,title='EMA3',group = "EMA",inline='2')

superTrend = input.bool(false, title="Show superTrend",group="ALGOS")
showsignals = input.bool(title="Show SuperTrend Buy/Sell Signals", defval=true,group="ALGOS")
Periods = input.int(title="ATR Period", defval=12,step=1,group="SuperTrend")
src = input.source(hl2, title="Source",group="SuperTrend")
Multiplier = input.float(title="ATR Multiplier", step=0.1, defval=3.0,group="SuperTrend")

var rsiBuy=color.new(color.green,0)
var rsiSell=color.new(color.red,0)
var rsiBuyCandle=input.color(defval=color.new(color.black,20), title='Buy Bar', group='Colors', inline='1')
var rsiSellCandle=input.color(defval=color.new(color.blue,20), title='Sell Bar', group='Colors', inline='1')
var rsiAlertCandle=input.color(defval=color.new(color.yellow,20), title='Alert Bar', group='Colors', inline='1')

rsi60 = ta.rsi(rsi_source60, rsi_lengthR)
rsi30 = ta.rsi(rsi_source30, rsi_lengthR)
rsi15 = ta.rsi(rsi_source15, rsi_lengthR)
rsi1 = ta.rsi(rsi_source1, rsi_lengthR)


color colorbarrsi=na

var indicB=false
var indicS=false
var condBuy=false
var condSell=false
//var int rih=ta.change(dayofweek(time),1)?bar_index:bar_index[1]
var int rih=0

var float vrih=0
var float vril=0

var line rlinekh=na
var line rlinekl=na
line.delete(rlinekh)
line.delete(rlinekl)


condBuy:=rsi60>60 and rsi30>60  and rsi1<40 and rsi15>rsi1
condSell:=rsi60<40 and rsi30<40 and rsi1>60 and rsi15<rsi1
if timeframe.isintraday and timeframe.multiplier<=5 and showRSITrend
    showRSITrend:=true
else
    showRSITrend:=false

if condBuy and showRSITrend
    colorbarrsi:=rsiBuyCandle
    condSell:=false
    indicB:=true
    indicS:=false
if condSell and showRSITrend
    condBuy:=false
    colorbarrsi:=rsiSellCandle
    indicB:=false
    indicS:=true
if indicB and rsi1>75 and rsi30<45 and showRSITrend
    colorbarrsi:=rsiAlertCandle
    indicB:=false
    label.new(bar_index, low,yloc=yloc.abovebar, text="RSI ALERT", style=label.style_xcross,color=color.red,textcolor=color.red,size=size.small)
    alert("ALERT",alert.freq_once_per_bar_close)
if indicS and rsi1<25 and rsi30>55 and showRSITrend
    colorbarrsi:=rsiAlertCandle
    indicS:=false
    label.new(bar_index, low,yloc=yloc.belowbar, text="RSI ALERT", style=label.style_xcross,color=color.green,textcolor=color.green,size=size.small)
    alert("RSI",alert.freq_once_per_bar_close)

if  rsi60<40 and indicB and showRSITrend
    colorbarrsi:=rsiAlertCandle
    indicB:=false
    indicS:=true
    label.new(bar_index, low,yloc=yloc.abovebar, text="RSI ALERT", style=label.style_xcross,color=color.red,textcolor=color.red,size=size.small)
    rih:=bar_index
    vrih:=high
    vril:=low
if rsi60>60 and indicS and showRSITrend
    colorbarrsi:=rsiAlertCandle
    indicB:=true
    indicS:=false
    rih:=bar_index
    vrih:=high
    vril:=low
    label.new(bar_index, low,yloc=yloc.belowbar, text="RSI ALERT", style=label.style_xcross,color=color.green,textcolor=color.green,size=size.small)
barcolor(showRSITrend?colorbarrsi:na)

if condBuy and showRSITrend and ta.change(condBuy,1)
    label.new(bar_index, low,yloc=yloc.belowbar, text="RSI Buy", style=label.style_label_up,color=rsiBuy,textcolor=color.white,size=size.small)
if condSell and showRSITrend and ta.change(condSell,1)
    label.new(bar_index, high,yloc=yloc.abovebar, text="RSI Sell", style=label.style_label_down,color=rsiSell,textcolor=color.white,size=size.small)
if(showRSITrend)
    rlinekh :=line.new(x1=rih, y1=vrih, x2=bar_index, y2=vrih, xloc=xloc.bar_index,  color=color.new(color.purple,10), style=line.style_dashed, width=1,extend=extend.right)
    rlinekl :=line.new(x1=rih, y1=vril, x2=bar_index, y2=vril, xloc=xloc.bar_index,  color=color.new(color.purple,10), style=line.style_dashed, width=1,extend=extend.right)


var color_ema0 = input.color(defval=color.new(color.blue,30), title='EMA 0', group='Colors',inline='2')
var color_ema1 = input.color(defval=color.new(color.green,30), title='EMA 1', group='Colors',inline='2')
var color_ema2 = input.color(defval=color.new(color.yellow,30), title='EMA 2', group='Colors',inline='3')
var color_ema3 = input.color(defval=color.new(color.red,30), title='EMA 3', group='Colors',inline='3')

ema0 = ta.ema(close, ma0)
ema1 = ta.ema(close, ma1)
ema2 = ta.ema(close, ma2)
ema3 = ta.ema(close, ma3)
ma_plot0 = plot(emas?ema0:na, title="EMA0", color=color_ema0,linewidth=2)
ma_plot1 = plot(emas?ema1:na, title="EMA1", color=color_ema1,linewidth=2)
ma_plot2 = plot(emas?ema2:na , title="EMA2", color=color_ema2,linewidth=1)
ma_plot3 = plot(emas?ema3:na , title="EMA3", color=color_ema3,linewidth=1)

if ta.crossover(ema0,ema1) and close>ema2 and emasig
    label.new(bar_index, low,yloc=yloc.belowbar, text="EMA ALERT", style=label.style_xcross,color=color.green,textcolor=color.green,size=size.small)

if ta.crossunder(ema0,ema1) and close<ema2 and emasig
    label.new(bar_index, low,yloc=yloc.abovebar, text="EMA ALERT", style=label.style_xcross,color=color.red,textcolor=color.red,size=size.small)


atr2 = ta.sma(ta.tr, Periods)
atr= ta.atr(Periods)
up=src-(Multiplier*atr)
up1 = nz(up[1],up)
up := close[1] > up1 ? math.max(up,up1) : up
dn=src+(Multiplier*atr)
dn1 = nz(dn[1], dn)
dn := close[1] < dn1 ? math.min(dn, dn1) : dn
trend = 1
trend := nz(trend[1], trend)
trend := trend == -1 and close > dn1 ? 1 : trend == 1 and close < up1 ? -1 : trend
upPlot = plot(trend == 1 and  superTrend? up : na, title="Up Trend", style=plot.style_linebr, linewidth=2, color=color.green)
buySignal = trend == 1 and trend[1] == -1
plotshape(buySignal and superTrend ? up : na, title="UpTrend Begins", location=location.absolute, style=shape.circle, size=size.tiny, color=color.new(color.green,10))
plotshape(buySignal and showsignals? up : na, title="Buy", text="SuperTrend Buy", location=location.absolute, style=shape.labelup, size=size.tiny, color=color.green, textcolor=color.white, transp=0)
dnPlot = plot(trend == 1 ? na :superTrend? dn:na, title="Down Trend", style=plot.style_linebr, linewidth=2, color=color.new(color.red,10))
sellSignal = trend == -1 and trend[1] == 1
plotshape(sellSignal and superTrend ? dn : na, title="DownTrend Begins", location=location.absolute, style=shape.circle, size=size.tiny, color=color.red, transp=0)
plotshape(sellSignal and showsignals ? dn : na, title="Sell", text="SuperTrend Sell", location=location.absolute, style=shape.labeldown, size=size.tiny, color=color.red, textcolor=color.white, transp=0)
mPlot = plot(ohlc4, title="", style=plot.style_circles, linewidth=0)
alertcondition(buySignal  and showsignals, title="SuperTrend Buy", message="SuperTrend Buy!")
alertcondition(sellSignal  and showsignals, title="SuperTrend Sell", message="SuperTrend Sell!")
changeCond = trend != trend[1]
alertcondition(changeCond  and showsignals, title="SuperTrend Direction Change", message="SuperTrend has changed direction!")
🛠 How to Apply the RSI ALGO + EMA + SuperTrend Indicator in TradingView
- Open TradingView and log in.
- Go to the Pine Script Editor at the bottom of the platform.
- Copy and paste the provided script code.
- Click Save, then name the script (e.g., “RSI ALGO EMA SuperTrend”).
- Click Add to Chart to visualize the indicator.
- Adjust input settings to match your trading preferences.
💡 Additional Trading Tips
- Combine with Volume Indicators:
Use On-Balance Volume (OBV) or Volume Profile to validate trade entries based on RSI and EMA signals. - Trade During High Liquidity Periods:
Enter trades during major market sessions to avoid false breakouts and take advantage of volatility. - Avoid Trading Against the Trend:
Always ensure that signals align with the overall market direction before executing trades.
🎯 Final Thoughts
The RSI ALGO + EMA + SuperTrend script is a comprehensive trading tool that combines momentum and trend-following elements to help traders make better decisions. Its flexibility across different timeframes makes it suitable for a wide range of trading styles.
However, it’s important to remember that no indicator can replace thorough analysis and disciplined risk management. Traders should backtest their strategies and adapt settings to their individual preferences.
Take your trading to the next level with the RSI ALGO + EMA + SuperTrend indicator – precise, powerful, and efficient! 🚀
RELATED POSTS
View all
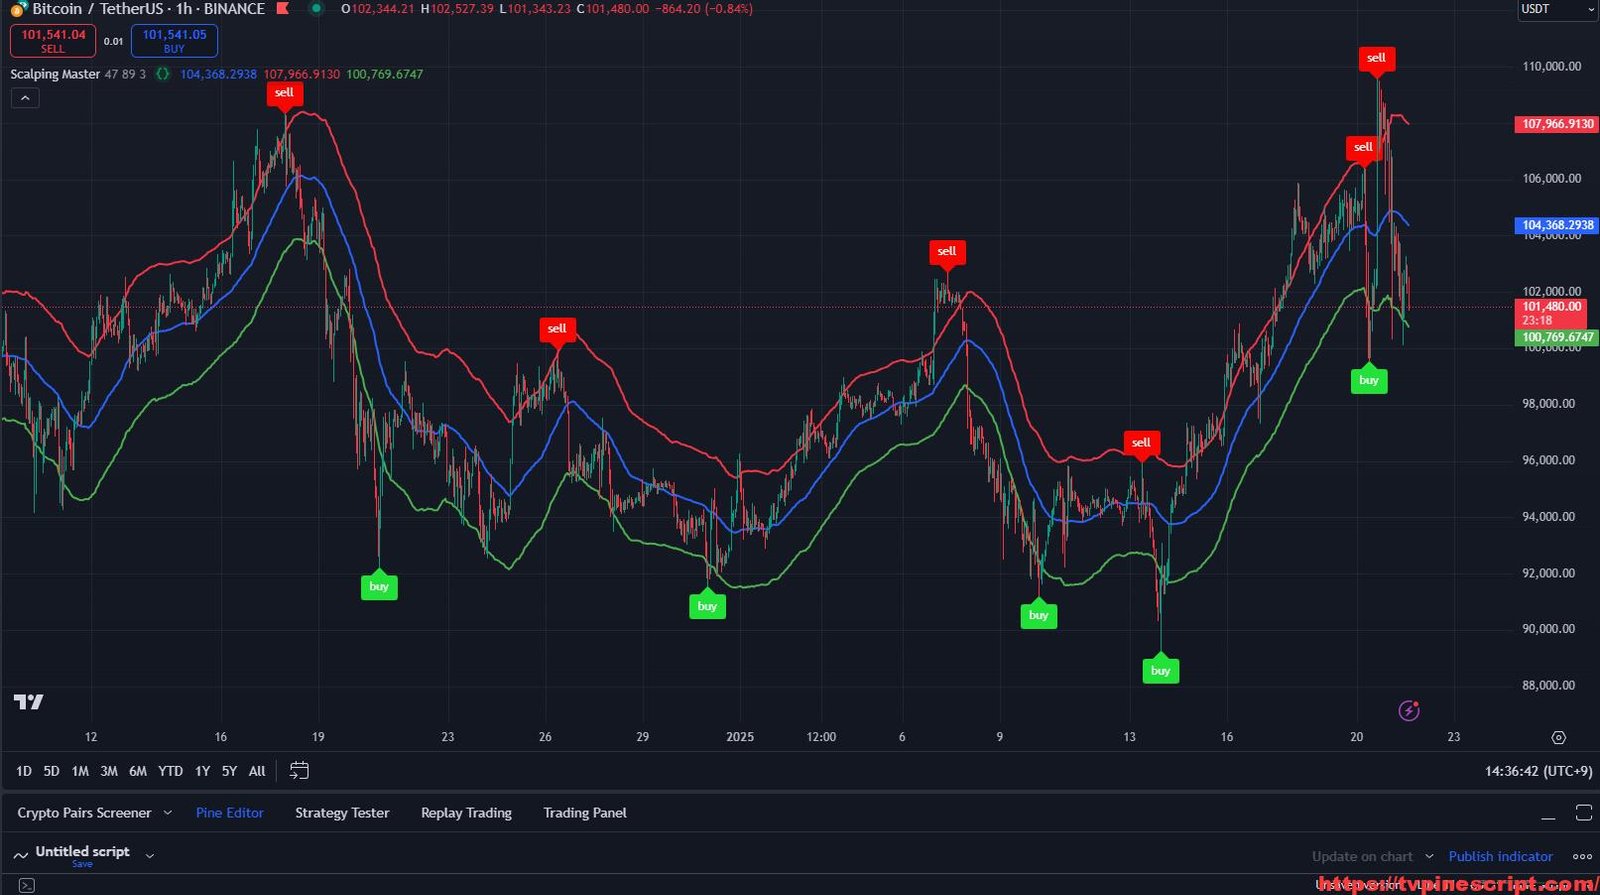
Scalping Master: Precision Entry and Exit Strategy for High-Frequency Traders
January 21, 2025 | by admin

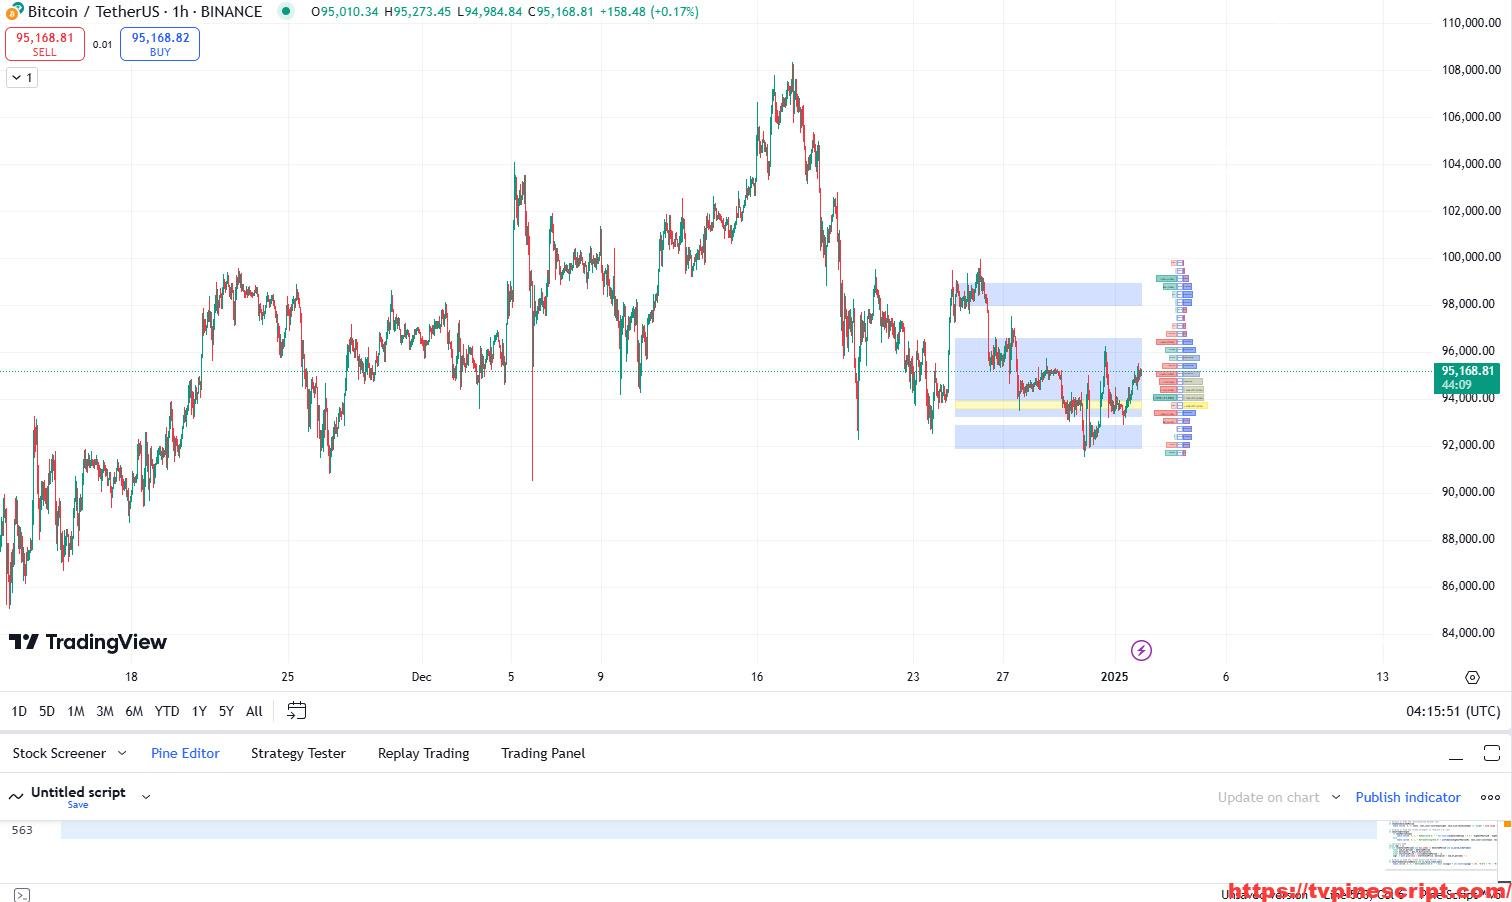
FluidTrades – SMC Lite: A Smart Money Concept (SMC) Trading Tool for Precision Market Analysis
January 21, 2025 | by admin
Enhance Market Insights with the Comprehensive Trendline and Volume Profile Script
January 3, 2025 | by admin