TradeWortex Indicator: A Multi-Faceted Trading Tool for Trend and Volatility Analysis
January 21, 2025 | by admin
In the complex world of trading, relying solely on price action without considering volatility and trend analysis can lead to inconsistent results. TradeWortex aims to simplify market analysis by providing a comprehensive set of tools, combining EMA clouds, volatility bands, support/resistance levels, and ATR-based risk management. However, it is important to note that no trading indicator guarantees profits—this script should be used as part of a well-rounded trading strategy with proper risk management and market understanding.
Whether you’re looking for short-term scalping opportunities or long-term trend confirmation, this indicator equips you with actionable insights to navigate the markets with confidence
Key Features of the Script:
- EMA Cloud System:
- A dynamic Exponential Moving Average (EMA) Cloud, composed of five EMAs to track market trends efficiently.
- Color-coded clouds to visually indicate bullish or bearish trends.
- Volatility Bands and Sensitivity Control:
- Incorporates Keltner Channels with adjustable sensitivity to monitor market volatility.
- Provides an early indication of breakout or reversal potential.
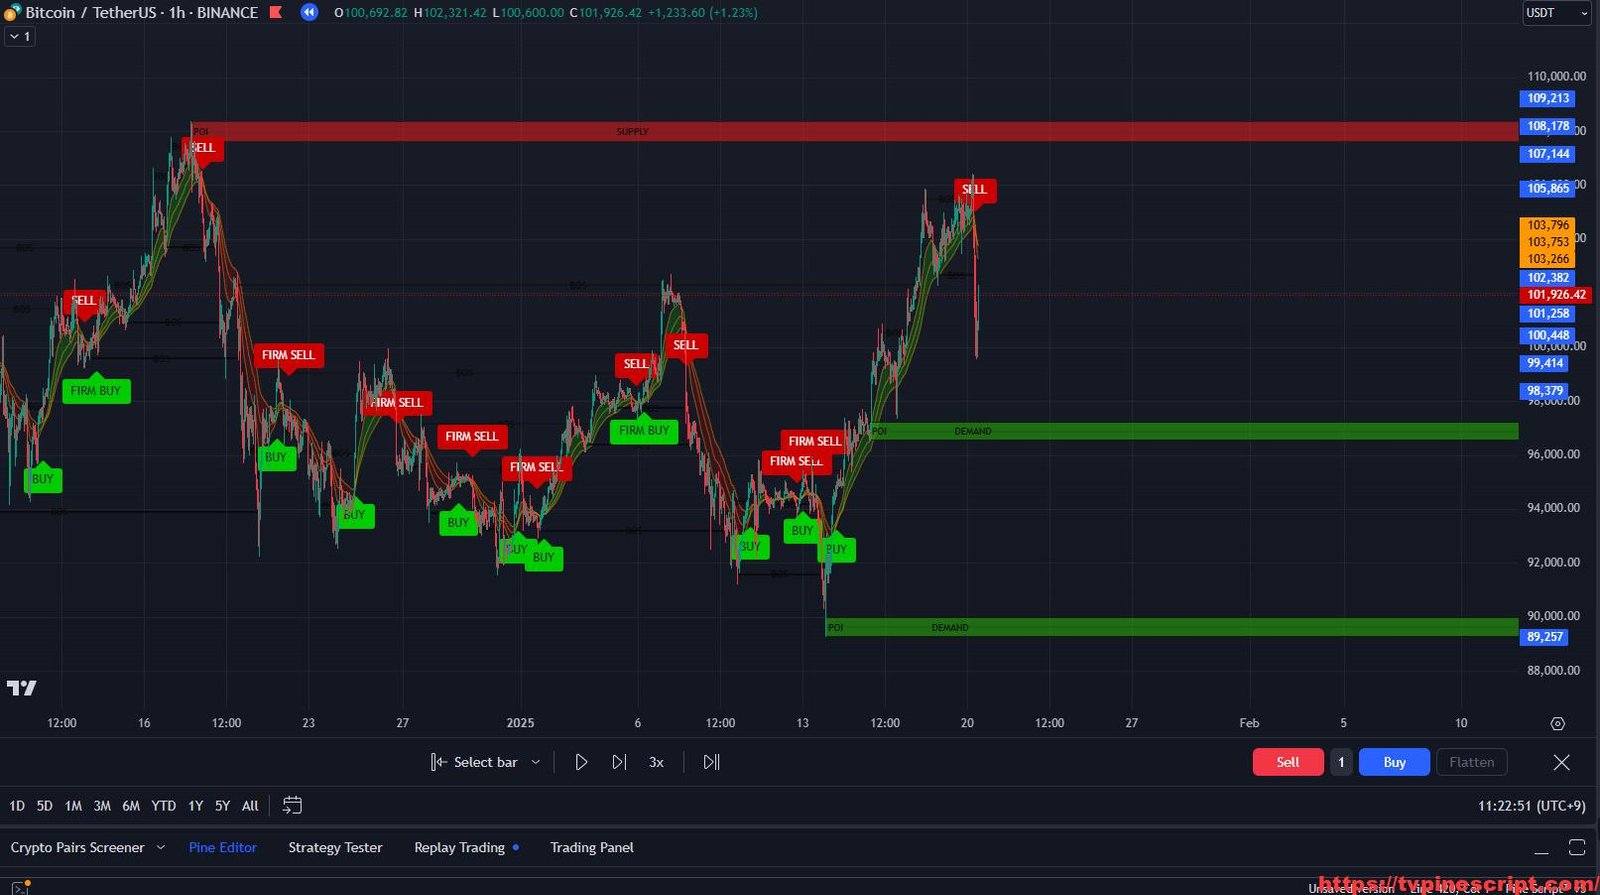
- Buy/Sell Signal Alerts:
- Automatic detection of buy (“BUY” and “FIRM BUY”) and sell (“SELL” and “FIRM SELL”) signals based on EMA crossovers.
- Customizable alert notifications to stay updated without constantly watching the charts.
- Support and Resistance Zones:
- Automatically detects major pivot highs and lows, creating dynamic support and resistance zones.
- Helps traders identify potential price reversal points or breakout areas.
- ATR-Based Stop-Loss and Take-Profit Levels:
- Calculates stop-loss and take-profit levels based on Average True Range (ATR).
- Configurable risk settings to suit different trading styles.
- Customizable Trend Candles:
- Automatically colors bars based on price action relative to EMA positioning.
- Helps traders quickly assess market sentiment at a glance.
- Supply and Demand Zone Detection:
- Identifies supply and demand zones using historical data.
- Tracks areas of high liquidity to predict potential market movements.
- Flexible Visualization Options:
- Supports various customization options, including line styles, color schemes, and display options for trend clarity.
- Adaptable to different trading strategies and personal preferences.
- Zigzag and Swing Point Detection:
- Highlights significant swing highs and lows with labels for trend-following traders.
- Useful for identifying market structure and trend continuation.
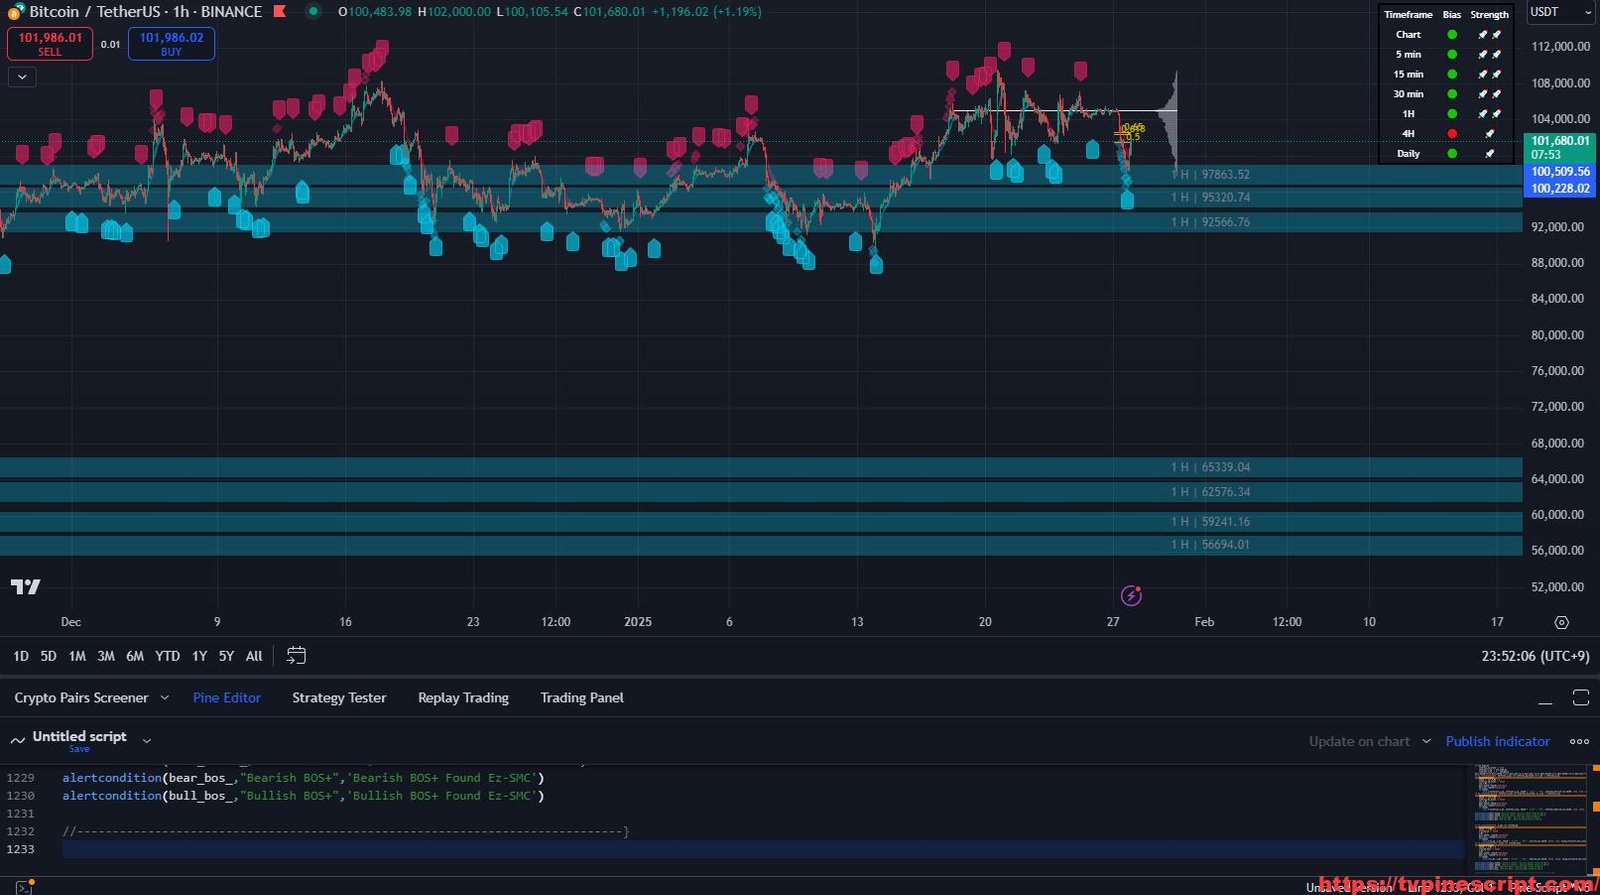
- Multi-Timeframe Compatibility:
- Can be applied across various timeframes to align short-term and long-term strategies.
- Ideal for scalpers and swing traders alike.
Recommended Usage:
- Scalping:
- Best suited for 5-minute to 15-minute charts.
- Utilize EMA clouds and volatility bands for quick entries and exits.
- Day Trading:
- Effective on 30-minute to 1-hour charts.
- Leverage buy/sell signals and ATR-based stop-loss for intraday opportunities.
- Swing Trading:
- Recommended for 4-hour to daily charts.
- Identify trend reversals using support/resistance and supply/demand zones.
- Risk Management:
- Use ATR-based stop-loss and take-profit levels to optimize reward-to-risk ratios.
- Avoid overtrading by focusing on high-confluence areas.
Script Evaluation:
- Functionality: 4.7/5
A robust trading tool offering multiple market analysis techniques, including trend tracking and volatility detection. - Ease of Use: 4.3/5
The extensive customization options may require some time for beginners to fully utilize. - Accuracy: 4.5/5
Provides reliable signals when used with the recommended settings and market context. - Repainting Analysis:
This script does not repaint.
It relies on confirmed price action, making it suitable for backtesting and live market use. - Optimal Timeframes:
- Scalping: 5-minute to 15-minute charts.
- Day Trading: 30-minute to 1-hour charts.
- Swing Trading: 4-hour to daily charts.
- Author and Development Quality:
The script is well-structured, reflecting solid programming expertise. However, the author is unnamed, and more documentation could be beneficial for better usability. - Overall Score: 4.6/5
A reliable, feature-rich indicator that offers comprehensive market insights and trading strategies.
//@version=5
indicator("Trade wortex ", overlay=true, precision=0, explicit_plot_zorder=true, max_labels_count=500)


// Get user input
emaCloud    = input.bool(true, "EMA Cloud?")
volCloud    = input.bool(false, "Volatility Cloud?")
volBands    = input.bool(false, "Volatility Bands?")
volSen      = input.float(1.5, "Volatility Sensitivity (1-5 (Half Allowed))", 0.5, 5, 0.5)
signals     = input.bool(true, "Buy/Sell Signals?")
levels      = input.bool(false, "TP/SL Levels?  ", inline="levels")
lvlLines    = input.bool(false, "Show Lines? ", inline="levels")
linesStyle  = input.string("SOLID", "", ["SOLID", "DASHED", "DOTTED"], inline="levels")
lvlDistance = input.int(1, "Distance", 1, inline="levels2")
lvlDecimals = input.int(2, "   Decimals", 1, 8, inline="levels2")
suppRes     = input.bool(false, "Support/Resistance?")
atrLen      = input.int(14, "ATR Length", 1)
atrRisk     = input.int(2, "ATR/ Risk", 1)
candlesT    = input.bool(true, "Trending Candles")
volBandsSen = input.int(5, "Vol Bands Sensitivity (Default: 5.0)", 1)
useEma      = input.bool(true, "Use Exponential MA?")
barsLR      = input.int(35, "S/R Looking Period", 1)
// Get Components
ema1        = ta.ema(ohlc4, int(5*volSen*2))
ema2        = ta.ema(ohlc4, int(9*volSen*2))
ema3        = ta.ema(ohlc4, int(13*volSen*2))
ema4        = ta.ema(ohlc4, int(34*volSen*2))
ema5        = ta.ema(ohlc4, int(50*volSen*2))
f_kc(src, len, mult) =>
    float basis = useEma ? ta.ema(src, len) : ta.sma(src, len)
    float span  = useEma ? ta.ema(ta.tr, len) : ta.sma(ta.tr, len)
    [basis + span * mult, basis - span * mult]
[upperKC1, lowerKC1] = f_kc(close, 35, 0.5236 * volBandsSen)
[upperKC2, lowerKC2] = f_kc(close, 35, 0.6854 * volBandsSen)
[upperKC3, lowerKC3] = f_kc(close, 35, 0.8472 * volBandsSen)
bull = ema3 >= ema3[1] and ema1 >= ema2 and ema1[1] < ema2[1]
bear = ema3 <= ema3[1] and ema1 <= ema2 and ema1[1] > ema2[1]
countBull = ta.barssince(bull)
countBear = ta.barssince(bear)
trigger = bull ? 1 : 0
atrBand = ta.atr(atrLen) * atrRisk
atrStop = trigger == 1 ? low - atrBand : high + atrBand
barsL     = barsLR
barsR     = barsLR
pivotHigh = fixnan(ta.pivothigh(barsL, barsR)[1])
pivotLow  = fixnan(ta.pivotlow(barsL, barsR)[1])
decimals  = lvlDecimals == 1 ? "#.#" : lvlDecimals == 2 ? "#.##" : lvlDecimals == 3 ? "#.###" : lvlDecimals == 4 ? "#.####" : lvlDecimals == 5 ? "#.#####" : lvlDecimals == 6 ? "#.######" : lvlDecimals == 7 ? "#.#######" : "#.########"
// Colors
green  =            #00CC00     ,   green5   = volCloud ? color.new(#00CC00, 95) : na,   green12_5 = volCloud ? color.new(#00CC00, 87.5) : na,   green20 = emaCloud ? color.new(#00CC00, 80) : na
red    =            #CC0000     ,   red5     = volCloud ? color.new(#CC0000, 95) : na,   red12_5   = volCloud ? color.new(#CC0000, 87.5) : na,   red20   = emaCloud? color.new(#CC0000, 80) : na
orange =            #FF9800     ,   orange50 = emaCloud ? color.new(orange, 50) : na
gray   = volBands ? #787B86 : na,   gray40   = volBands ? color.new(gray, 60) : na,      gray5     = volBands ? color.new(gray, 95) : na,        gray20  = volBands ? color.new(gray, 80) : na
// Plots
p1 = plot(ema1, "", orange50, editable=false)
p2 = plot(ema2, "", orange50, editable=false)
p3 = plot(ema3, "", orange50, editable=false)
p4 = plot(ema4, "", na, editable=false)
p5 = plot(ema5, "", na, editable=false)
fill(p4, p5, ema4 >= ema5 ? green5 : red5)
fill(p3, p4, ema3 >= ema4 ? green12_5 : red12_5)
fill(p2, p3, ema3 >= ema3[1] ? green20 : red20)
fill(p1, p2, ema1 >= ema3 ? green20 : red20)
barcolor(candlesT ? (ema3 >= ema3[1] ? green : red) : na)
b1 = plot(upperKC1, "", gray40, editable=false)
b2 = plot(upperKC2, "", gray40, editable=false)
b3 = plot(upperKC3, "", gray40, editable=false)
b4 = plot(lowerKC1, "", gray40, editable=false)
b5 = plot(lowerKC2, "", gray40, editable=false)
b6 = plot(lowerKC3, "", gray40, editable=false)
fill(b1, b2, gray5)
fill(b2, b3, gray20)
fill(b4, b5, gray5)
fill(b5, b6, gray20)
plot(pivotHigh, "Resistance", not suppRes or ta.change(pivotHigh) ? na : red, 3, offset=-(barsR + 1), editable=false)
plot(pivotLow, "Support", not suppRes or ta.change(pivotLow) ? na : green, 3, offset=-(barsR + 1), editable=false)
y1 = low - (ta.atr(30) * 1.6)
y2 = high + (ta.atr(30) * 1.6)
buy  = signals and bull ? label.new(bar_index, y1, ema4 >= ema5 ? "FIRM BUY" : "BUY", xloc.bar_index, yloc.price, #00CC00, label.style_label_up, #141923, size.normal) : na
sell = signals and bear ? label.new(bar_index, y2, ema4 <= ema5 ? "FIRM SELL" : "SELL", xloc.bar_index, yloc.price, #CC0000, label.style_label_down, color.white, size.normal) : na
lastTrade(src) => ta.valuewhen((ema3 >= ema3[1] and ema1 >= ema2 and ema1[1] < ema2[1]) or (ema3 <= ema3[1] and ema1 <= ema2 and ema1[1] > ema2[1]), src, 0)
entry = levels ? label.new(time, close, "ENTRY " + str.tostring(lastTrade(close), decimals), xloc.bar_time, yloc.price, color.gray, label.style_label_left, color.white, size.normal) : na
label.set_x(entry, label.get_x(entry) + math.round(ta.change(time) * lvlDistance))
label.set_y(entry, lastTrade(close))
label.delete(entry[1])
stop_y = lastTrade(atrStop)
stop  = levels ? label.new(time, close, "SL " + str.tostring(stop_y, decimals), xloc.bar_time, yloc.price, #CC0000, label.style_label_left, color.white, size.normal) : na
label.set_x(stop, label.get_x(stop) + math.round(ta.change(time) * lvlDistance))
label.set_y(stop, stop_y)
label.delete(stop[1])
tp1_y = (lastTrade(close)-lastTrade(atrStop))*1 + lastTrade(close)
tp1   = levels ? label.new(time, close, "1:1 TP " + str.tostring(tp1_y, decimals), xloc.bar_time, yloc.price, #00CC00, label.style_label_left, color.white, size.normal) : na
label.set_x(tp1, label.get_x(tp1) + math.round(ta.change(time) * lvlDistance))
label.set_y(tp1, tp1_y)
label.delete(tp1[1])
tp2_y = (lastTrade(close)-lastTrade(atrStop))*2 + lastTrade(close)
tp2   = levels ? label.new(time, close, "2:1 TP " + str.tostring(tp2_y, decimals), xloc.bar_time, yloc.price, #00CC00, label.style_label_left, color.white, size.normal) : na
label.set_x(tp2, label.get_x(tp2) + math.round(ta.change(time) * lvlDistance))
label.set_y(tp2, tp2_y)
label.delete(tp2[1])
tp3_y = (lastTrade(close)-lastTrade(atrStop))*3 + lastTrade(close)
tp3   = levels ? label.new(time, close, "3:1 TP " + str.tostring(tp3_y, decimals), xloc.bar_time, yloc.price, #00CC00, label.style_label_left, color.white, size.normal) : na
label.set_x(tp3, label.get_x(tp3) + math.round(ta.change(time) * lvlDistance))
label.set_y(tp3, tp3_y)
label.delete(tp3[1])
style = linesStyle == "SOLID" ? line.style_solid : linesStyle == "DASHED" ? line.style_dashed : line.style_dotted
lineEntry = levels and lvlLines ? line.new(bar_index - (trigger == 0 ? countBull : countBear), lastTrade(close), bar_index + lvlDistance, lastTrade(close), xloc.bar_index, extend.none, color.gray, style, 2) : na, line.delete(lineEntry[1])
lineStop  = levels and lvlLines ? line.new(bar_index - (trigger == 0 ? countBull : countBear), stop_y, bar_index + lvlDistance, stop_y, xloc.bar_index, extend.none, #CC0000, style, 2) : na, line.delete(lineStop[1])
lineTp1   = levels and lvlLines ? line.new(bar_index - (trigger == 0 ? countBull : countBear), tp1_y, bar_index + lvlDistance, tp1_y, xloc.bar_index, extend.none, #00CC00, style, 2) : na, line.delete(lineTp1[1])
lineTp2   = levels and lvlLines ? line.new(bar_index - (trigger == 0 ? countBull : countBear), tp2_y, bar_index + lvlDistance, tp2_y, xloc.bar_index, extend.none, #00CC00, style, 2) : na, line.delete(lineTp2[1])
lineTp3   = levels and lvlLines ? line.new(bar_index - (trigger == 0 ? countBull : countBear), tp3_y, bar_index + lvlDistance, tp3_y, xloc.bar_index, extend.none, #00CC00, style, 2) : na, line.delete(lineTp3[1])
// Alerts
alertcondition(bull, "Buy", "EasyAlgo Community\nBuy {{ticker}} @ {{close}}")
alertcondition(bull and ema4 >= ema5, "Firm Buy", "EasyAlgo Community\nFirm Buy {{ticker}} @ {{close}}")
alertcondition(bear and ema4 <= ema5, "Firm Sell", "EasyAlgo Community\nFirm Sell {{ticker}} @ {{close}}")
alertcondition(bear, "Sell", "EasyAlgo Community\nSell {{ticker}} @ {{close}}")

////////////////////////////////////////////////////////////////////////////////////////////////
//?????????????????????????????????  DESTEK D?EN?B?GELER? ??????????????????????????????????
////////////////////////////////////////////////////////////////////////////////////////////////

//      INDICATOR SETTINGS
swing_length = input.int(10, title = 'Swing High/Low Length', group = 'Settings', minval = 1, maxval = 50)
history_of_demand_to_keep = input.int(20, title = 'History To Keep', minval = 5, maxval = 50)
box_width = input.float(10, title = 'Supply/Demand Box Width', group = 'Settings', minval = 1, maxval = 10, step = 0.5)

//      INDICATOR VISUAL SETTINGS
show_zigzag = input.bool(false, title = 'Show Zig Zag', group = 'Visual Settings', inline = '1')
show_price_action_labels = input.bool(false, title = 'Show Price Action Labels', group = 'Visual Settings', inline = '2')

supply_color = input.color(color.new(#e41c1c, 44), title = 'Supply', group = 'Visual Settings', inline = '3')
supply_outline_color = input.color(color.new(#131111, 31), title = 'Outline', group = 'Visual Settings', inline = '3')

demand_color = input.color(color.new(#27a507, 40), title = 'Demand', group = 'Visual Settings', inline = '4')
demand_outline_color = input.color(color.new(#080808, 22), title = 'Outline', group = 'Visual Settings', inline = '4')

bos_label_color = input.color(color.rgb(8, 8, 8), title = 'BOS Label', group = 'Visual Settings', inline = '5')
poi_label_color = input.color(color.rgb(12, 11, 11), title = 'POI Label', group = 'Visual Settings', inline = '7')

swing_type_color = input.color(color.black, title = 'Price Action Label', group = 'Visual Settings', inline = '8')
zigzag_color = input.color(color.new(#000000,0), title = 'Zig Zag', group = 'Visual Settings', inline = '9')

//
//END SETTINGS
//


//
//FUNCTIONS
//

//      FUNCTION TO ADD NEW AND REMOVE LAST IN ARRAY
f_array_add_pop(array, new_value_to_add) =>
    array.unshift(array, new_value_to_add)
    array.pop(array)

//      FUNCTION SWING H & L LABELS
f_sh_sl_labels(array, swing_type) =>

    var string label_text = na
    if swing_type == 1
        if array.get(array, 0) >= array.get(array, 1)
            label_text := 'HH'
        else
            label_text := 'LH'
        label.new(bar_index - swing_length, array.get(array,0), text = label_text, style=label.style_label_down, textcolor = swing_type_color, color = color.new(swing_type_color, 100), size = size.tiny)

    else if swing_type == -1
        if array.get(array, 0) >= array.get(array, 1)
            label_text := 'HL'
        else
            label_text := 'LL'
        label.new(bar_index - swing_length, array.get(array,0), text = label_text, style=label.style_label_up, textcolor = swing_type_color, color = color.new(swing_type_color, 100), size = size.tiny)

//      FUNCTION MAKE SURE SUPPLY ISNT OVERLAPPING
f_check_overlapping(new_poi, box_array, atr) =>

    atr_threshold = atr * 2
    okay_to_draw = true

    for i = 0 to array.size(box_array) - 1
        top = box.get_top(array.get(box_array, i))
        bottom = box.get_bottom(array.get(box_array, i))
        poi = (top + bottom) / 2

        upper_boundary = poi + atr_threshold
        lower_boundary = poi - atr_threshold

        if new_poi >= lower_boundary and new_poi <= upper_boundary
            okay_to_draw := false
            break
        else
            okay_to_draw := true
    okay_to_draw


//      FUNCTION TO DRAW SUPPLY OR DEMAND ZONE
f_supply_demand(value_array, bn_array, box_array, label_array, box_type, atr) =>

    atr_buffer = atr * (box_width / 10)
    box_left = array.get(bn_array, 0)
    box_right = bar_index

    var float box_top = 0.00
    var float box_bottom = 0.00
    var float poi = 0.00


    if box_type == 1
        box_top := array.get(value_array, 0)
        box_bottom := box_top - atr_buffer
        poi := (box_top + box_bottom) / 2
    else if box_type == -1
        box_bottom := array.get(value_array, 0)
        box_top := box_bottom + atr_buffer
        poi := (box_top + box_bottom) / 2

    okay_to_draw = f_check_overlapping(poi, box_array, atr)
    // okay_to_draw = true

    //delete oldest box, and then create a new box and add it to the array
    if box_type == 1 and okay_to_draw
        box.delete( array.get(box_array, array.size(box_array) - 1) )
        f_array_add_pop(box_array, box.new( left = box_left, top = box_top, right = box_right, bottom = box_bottom, border_color = supply_outline_color,
             bgcolor = supply_color, extend = extend.right, text = 'SUPPLY', text_halign = text.align_center, text_valign = text.align_center, text_color = poi_label_color, text_size = size.small, xloc = xloc.bar_index))

        box.delete( array.get(label_array, array.size(label_array) - 1) )
        f_array_add_pop(label_array, box.new( left = box_left, top = poi, right = box_right, bottom = poi, border_color = color.new(poi_label_color,90),
             bgcolor = color.new(poi_label_color,90), extend = extend.right, text = 'POI', text_halign = text.align_left, text_valign = text.align_center, text_color = poi_label_color, text_size = size.small, xloc = xloc.bar_index))

    else if box_type == -1 and okay_to_draw
        box.delete( array.get(box_array, array.size(box_array) - 1) )
        f_array_add_pop(box_array, box.new( left = box_left, top = box_top, right = box_right, bottom = box_bottom, border_color = demand_outline_color,
             bgcolor = demand_color, extend = extend.right,  text = 'DEMAND', text_halign = text.align_center, text_valign = text.align_center, text_color = poi_label_color, text_size = size.small, xloc = xloc.bar_index))

        box.delete( array.get(label_array, array.size(label_array) - 1) )
        f_array_add_pop(label_array, box.new( left = box_left, top = poi, right = box_right, bottom = poi, border_color = color.new(poi_label_color,90),
             bgcolor = color.new(poi_label_color,90), extend = extend.right,  text = 'POI', text_halign = text.align_left, text_valign = text.align_center, text_color = poi_label_color, text_size = size.small, xloc = xloc.bar_index))


//      FUNCTION TO CHANGE SUPPLY/DEMAND TO A BOS IF BROKEN
f_sd_to_bos(box_array, bos_array, label_array, zone_type) =>

    if zone_type == 1
        for i = 0 to array.size(box_array) - 1
            level_to_break = box.get_top(array.get(box_array,i))
            // if ta.crossover(close, level_to_break)
            if close >= level_to_break
                copied_box = box.copy(array.get(box_array,i))
                f_array_add_pop(bos_array, copied_box)
                mid = (box.get_top(array.get(box_array,i)) + box.get_bottom(array.get(box_array,i))) / 2
                box.set_top(array.get(bos_array,0), mid)
                box.set_bottom(array.get(bos_array,0), mid)
                box.set_extend( array.get(bos_array,0), extend.none)
                box.set_right( array.get(bos_array,0), bar_index)
                box.set_text( array.get(bos_array,0), 'BOS' )
                box.set_text_color( array.get(bos_array,0), bos_label_color)
                box.set_text_size( array.get(bos_array,0), size.small)
                box.set_text_halign( array.get(bos_array,0), text.align_center)
                box.set_text_valign( array.get(bos_array,0), text.align_center)
                box.delete(array.get(box_array, i))
                box.delete(array.get(label_array, i))


    if zone_type == -1
        for i = 0 to array.size(box_array) - 1
            level_to_break = box.get_bottom(array.get(box_array,i))
            // if ta.crossunder(close, level_to_break)
            if close <= level_to_break
                copied_box = box.copy(array.get(box_array,i))
                f_array_add_pop(bos_array, copied_box)
                mid = (box.get_top(array.get(box_array,i)) + box.get_bottom(array.get(box_array,i))) / 2
                box.set_top(array.get(bos_array,0), mid)
                box.set_bottom(array.get(bos_array,0), mid)
                box.set_extend( array.get(bos_array,0), extend.none)
                box.set_right( array.get(bos_array,0), bar_index)
                box.set_text( array.get(bos_array,0), 'BOS' )
                box.set_text_color( array.get(bos_array,0), bos_label_color)
                box.set_text_size( array.get(bos_array,0), size.small)
                box.set_text_halign( array.get(bos_array,0), text.align_center)
                box.set_text_valign( array.get(bos_array,0), text.align_center)
                box.delete(array.get(box_array, i))
                box.delete(array.get(label_array, i))


//      FUNCTION MANAGE CURRENT BOXES BY CHANGING ENDPOINT
f_extend_box_endpoint(box_array) =>

    for i = 0 to array.size(box_array) - 1
        box.set_right(array.get(box_array, i), bar_index + 100)


//
//END FUNCTIONS
//


//
//CALCULATIONS
//

//      CALCULATE ATR
atr = ta.atr(50)

//      CALCULATE SWING HIGHS & SWING LOWS
swing_high = ta.pivothigh(high, swing_length, swing_length)
swing_low = ta.pivotlow(low, swing_length, swing_length)

//      ARRAYS FOR SWING H/L & BN
var swing_high_values = array.new_float(5,0.00)
var swing_low_values = array.new_float(5,0.00)

var swing_high_bns = array.new_int(5,0)
var swing_low_bns = array.new_int(5,0)

//      ARRAYS FOR SUPPLY / DEMAND
var current_supply_box = array.new_box(history_of_demand_to_keep, na)
var current_demand_box = array.new_box(history_of_demand_to_keep, na)

//      ARRAYS FOR SUPPLY / DEMAND POI LABELS
var current_supply_poi = array.new_box(history_of_demand_to_keep, na)
var current_demand_poi = array.new_box(history_of_demand_to_keep, na)

//      ARRAYS FOR BOS
var supply_bos = array.new_box(5, na)
var demand_bos = array.new_box(5, na)
//
//END CALCULATIONS
//

//      NEW SWING HIGH
if not na(swing_high)

    //MANAGE SWING HIGH VALUES
    f_array_add_pop(swing_high_values, swing_high)
    f_array_add_pop(swing_high_bns, bar_index[swing_length])
    if show_price_action_labels
        f_sh_sl_labels(swing_high_values, 1)

    f_supply_demand(swing_high_values, swing_high_bns, current_supply_box, current_supply_poi, 1, atr)

//      NEW SWING LOW
else if not na(swing_low)

    //MANAGE SWING LOW VALUES
    f_array_add_pop(swing_low_values, swing_low)
    f_array_add_pop(swing_low_bns, bar_index[swing_length])
    if show_price_action_labels
        f_sh_sl_labels(swing_low_values, -1)

    f_supply_demand(swing_low_values, swing_low_bns, current_demand_box, current_demand_poi, -1, atr)


f_sd_to_bos(current_supply_box, supply_bos, current_supply_poi, 1)
f_sd_to_bos(current_demand_box, demand_bos, current_demand_poi, -1)

f_extend_box_endpoint(current_supply_box)
f_extend_box_endpoint(current_demand_box)

//ZIG ZAG
h = ta.highest(high, swing_length * 2 + 1)
l = ta.lowest(low, swing_length * 2 + 1)
f_isMin(len) =>
    l == low[len]
f_isMax(len) =>
    h == high[len]

var dirUp = false
var lastLow = high * 100
var lastHigh = 0.0
var timeLow = bar_index
var timeHigh = bar_index
var line li = na

f_drawLine() =>
    _li_color = show_zigzag ? zigzag_color : color.new(#ffffff,100)
    line.new(timeHigh - swing_length, lastHigh, timeLow - swing_length, lastLow, xloc.bar_index, color=_li_color, width=2)

if dirUp
    if f_isMin(swing_length) and low[swing_length] < lastLow
        lastLow := low[swing_length]
        timeLow := bar_index
        line.delete(li)
        li := f_drawLine()
        li

    if f_isMax(swing_length) and high[swing_length] > lastLow
        lastHigh := high[swing_length]
        timeHigh := bar_index
        dirUp := false
        li := f_drawLine()
        li

if not dirUp
    if f_isMax(swing_length) and high[swing_length] > lastHigh
        lastHigh := high[swing_length]
        timeHigh := bar_index
        line.delete(li)
        li := f_drawLine()
        li
    if f_isMin(swing_length) and low[swing_length] < lastHigh
        lastLow := low[swing_length]
        timeLow := bar_index
        dirUp := true
        li := f_drawLine()
        if f_isMax(swing_length) and high[swing_length] > lastLow
            lastHigh := high[swing_length]
            timeHigh := bar_index
            dirUp := false
            li := f_drawLine()
            li
// if barstate.islast
    // label.new(x = bar_index + 10, y = close[1], text = str.tostring( array.size(current_supply_poi) ))
//     label.new(x = bar_index + 20, y = close[1], text = str.tostring( box.get_bottom( array.get(current_supply_box, 0))))
//     label.new(x = bar_index + 30, y = close[1], text = str.tostring( box.get_bottom( array.get(current_supply_box, 1))))
//     label.new(x = bar_index + 40, y = close[1], text = str.tostring( box.get_bottom( array.get(current_supply_box, 2))))
//     label.new(x = bar_index + 50, y = close[1], text = str.tostring( box.get_bottom( array.get(current_supply_box, 3))))
//     label.new(x = bar_index + 60, y = close[1], text = str.tostring( box.get_bottom( array.get(current_supply_box, 4))))
How to Apply Pine Script in TradingView:
- Open TradingView and log in to your account.
- Navigate to the Pine Script Editor (bottom panel).
- Copy and paste the provided script code.
- Click Save, name the script (e.g., “TradeWortex”).
- Click Add to Chart to apply it.
- Customize the settings according to your trading strategy.
Additional Trading Tips:
- Combine with Momentum Indicators:
Use the script alongside momentum-based tools such as RSI and MACD for enhanced confirmation. - Set Realistic Expectations:
While the script provides valuable insights, always trade with realistic goals and proper risk management. - Monitor Higher Timeframes:
Before entering a trade, check higher timeframes to confirm trends and avoid false signals.
Final Thoughts:
The TradeWortex indicator is an excellent choice for traders looking to combine trend-following strategies with volatility-based analysis. Its non-repainting nature ensures reliability, making it a valuable tool for day traders, scalpers, and swing traders alike.
However, keep in mind that no trading indicator guarantees success—always practice sound risk management and trade with a clear strategy.
RELATED POSTS
View all

Live FVG + TradingHub3: Advanced Fair Value Gap Strategy for Smart Trading
January 23, 2025 | by admin
Indicator X – A Comprehensive Multi-Strategy Trading Indicator for Trend Analysis and Market Structure
January 27, 2025 | by admin
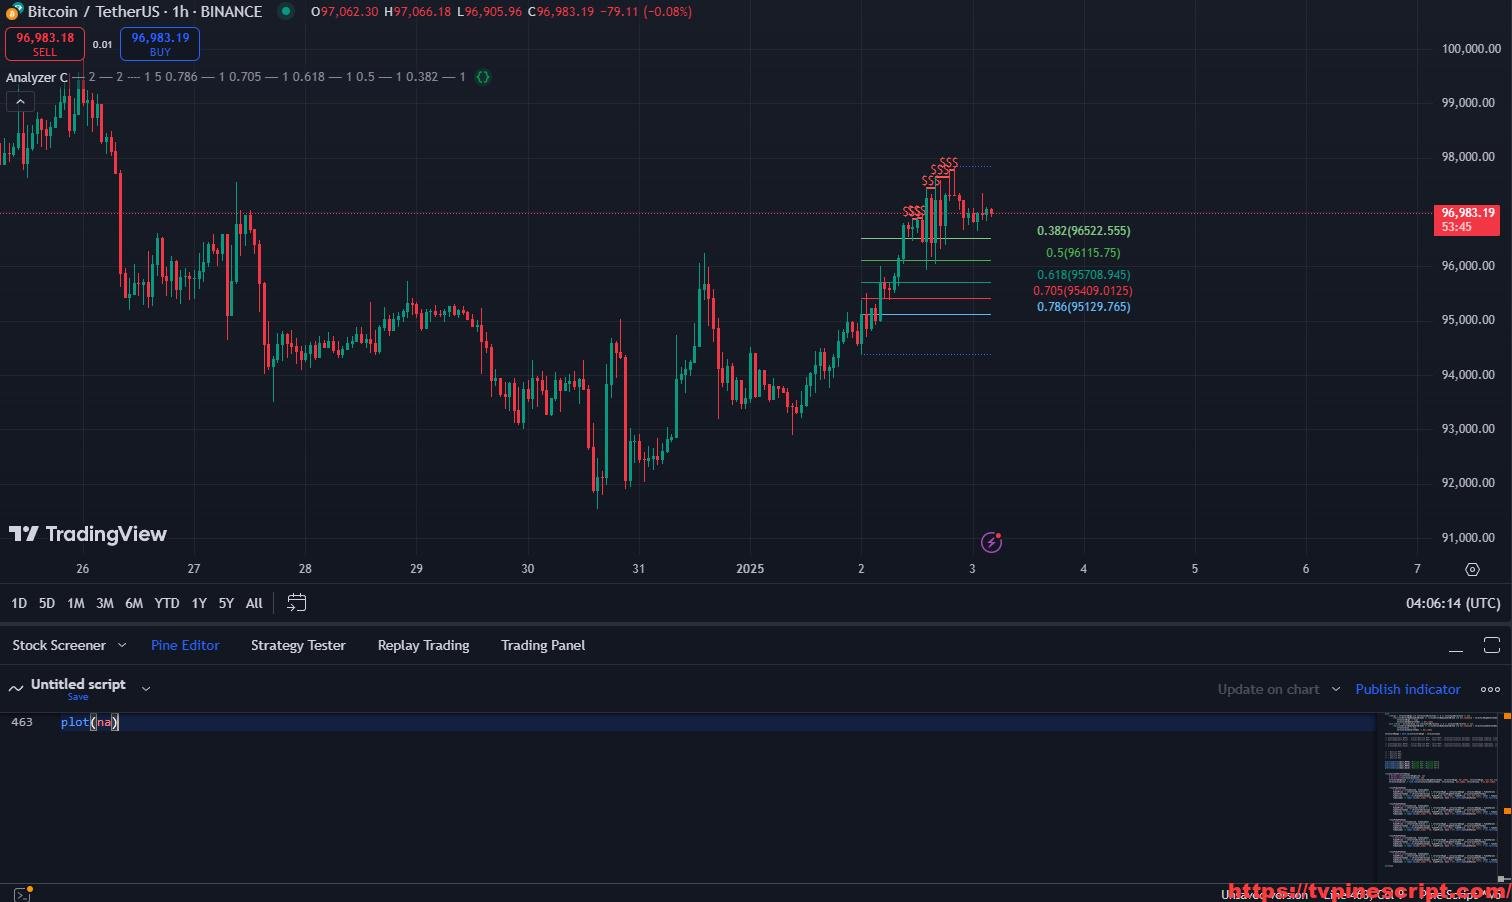
Analyzer C: Advanced Market Structure and Fibonacci-Based Trading Strategy
January 3, 2025 | by admin