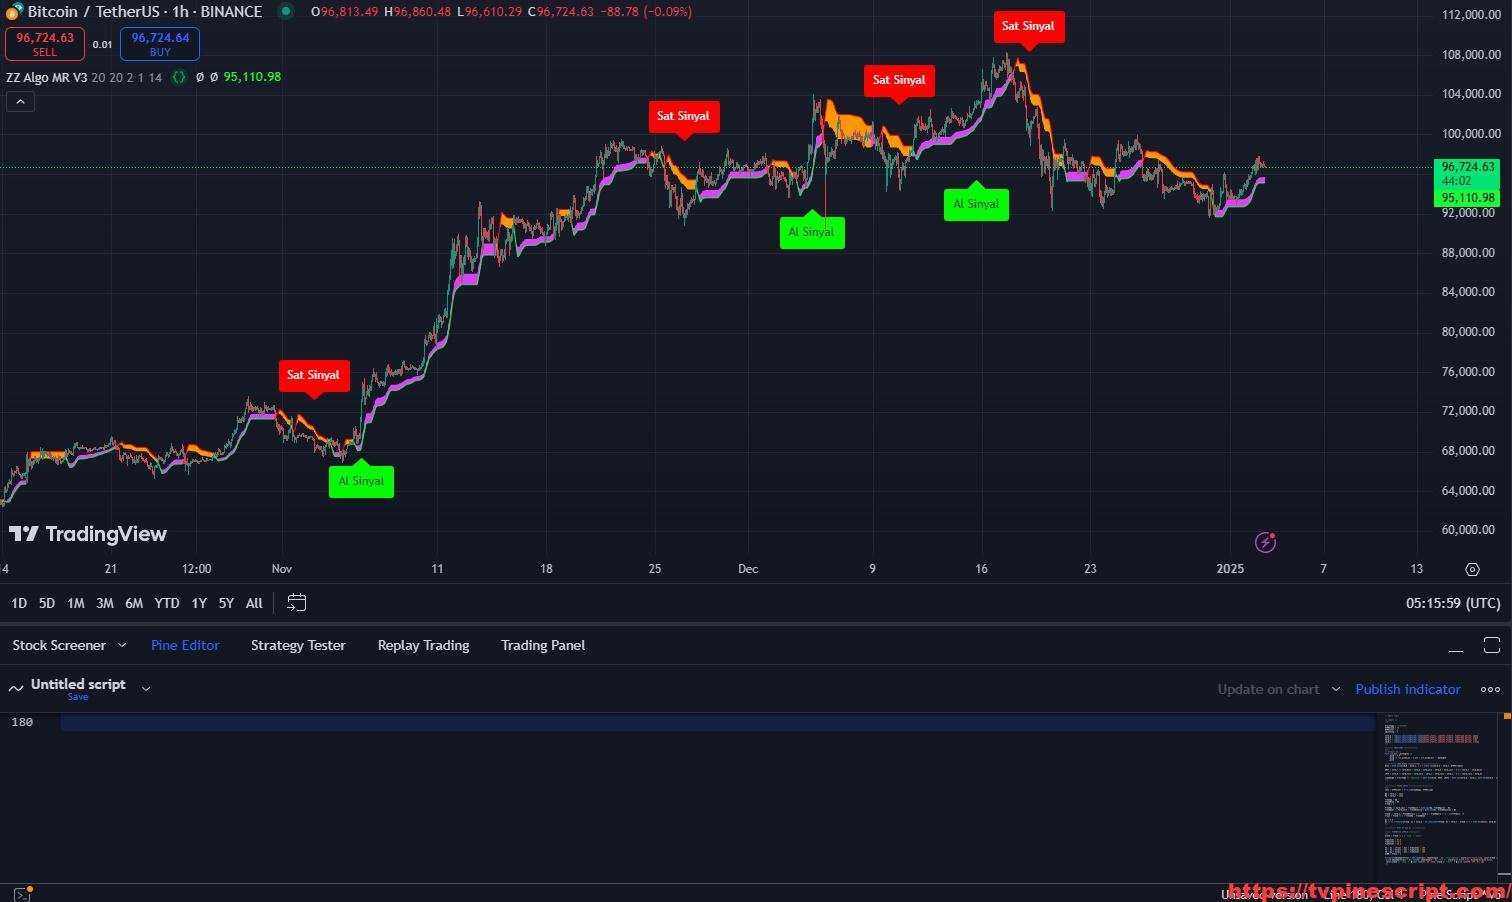
ZZ Algo MR V3: Comprehensive Trend and Risk Management for Precision Trading
January 3, 2025 | by admin
Key Features of the Script:
- Buy/Sell Signal Generation:
- Generates buy and sell signals based on ATR, trend direction, and price action.
- Offers customizable sensitivity for signals, allowing traders to adapt to varying market conditions.
- ATR-Based Smart Trail and Risk Management:
- Integrates a smart trailing stop system based on modified ATR calculations.
- Dynamically updates stop-loss levels and includes Fibonacci extensions (61.8%, 78.6%, and 88.6%) for profit-taking.
- Trend Reversal Detection:
- Identifies trend reversals using MACD and histogram analysis.
- Highlights trend changes with gradient-colored candles for real-time sentiment tracking.
- Support for Reversal Clouds and Trend Following:
- Includes features for reversal cloud visualization and trend-following analysis.
- Tracks trends with adjustable smoothing for flexible and accurate visualizations.
- Session and Multi-Asset Compatibility:
- Adapts seamlessly to various timeframes and asset classes, offering wide applicability.
- Provides real-time alerts for trend shifts and signal activations.
- Custom Visualization and Alerts:
- Allows users to customize line styles, colors, and visual fills for a personalized trading experience.
- Includes dynamic alert conditions for buy/sell signals, trend changes, and key market events.
Recommended Usage:
- Scalping and Day Trading:
- Leverage high-sensitivity buy/sell signals for rapid entries and exits.
- Use the smart trailing stop system to protect profits in volatile markets.
- Swing and Trend Trading:
- Follow trend direction and reversal clouds to capture broader market movements.
- Utilize ATR-based stop-loss levels and Fibonacci targets for disciplined trade management.
- Risk Management:
- Apply ATR and trailing stop-loss strategies to manage exposure effectively.
- Monitor Fibonacci levels for potential profit-taking zones.
- Dynamic Customization:
- Adjust signal sensitivity and visualization options to align with specific trading strategies.
- Combine gradient candle coloring with trend analysis for enhanced clarity.
Script Evaluation:
- Functionality: 4.8/5
The script combines a comprehensive suite of tools for trend-following, risk management, and signal generation, making it adaptable for multiple trading styles. - Ease of Use: 4.4/5
While feature-rich, its settings and customization options may require initial familiarization for new users. - Accuracy: 4.7/5
Reliable signal generation and trailing stop calculations when applied with proper configurations. - Repainting Analysis:
This script does not repaint. All signals and calculations rely on closed bar data, ensuring consistent and actionable results in both historical and real-time scenarios. - Author and Development Quality:
The script appears to be designed by ZZ Algo (Telegram: @ZZAlgo). While it demonstrates significant functionality and flexibility, some portions of the code (such as redundant smoothing calculations) could benefit from optimization to enhance execution speed and resource efficiency. - Overall Score: 4.6/5
A robust and feature-packed trading tool, ideal for intermediate to advanced traders seeking precision in trend-following and risk management strategies.
//@version=5
indicator('ZZ Algo MR V3', overlay=true)
import TradingView/ta/7

// Setting
showsignals = input(title='Sinyalleri Goster', defval=true, group = 'Al Ve Sat Sinyal [ZZAlgo]')
sensitivity = input.int(title='Hassasiyet (1-20)', defval=20, minval = 1, maxval = 45, group = 'Al Ve Sat Sinyal [ZZAlgo]') + 1

levels      = input.bool(false, "Kar Al/Zarar Durdur Noktasi" , group = "Risk yonetimi [ZZ Algo]" , inline = "MMDB2")
lvlLines    = true
linesStyle  = "SOLID"
lvlDistance = input.int(20, "Mesafe", 1, inline="levels2", group = "Risk yonetimi [ZZ Algo]")
lvlDecimals = input.int(2, "Ondalik Sayi", 1, 8, inline="levels2", group = "Risk yonetimi [ZZ Algo]")
atrRisk     = input.int(1, "Risk", 1, group = "Risk yonetimi [ZZ Algo]" , inline="levels3")
atrLen      = input.int(14, "ATR Mesafesi", 1, group = "Risk yonetimi [ZZ Algo]" , inline="levels3")

ShowSmartTrail = input(true,'Akilli iz sürme', group = 'TOOLS [ZZ Algo]')
show_rev = input.bool(true, "Reversal Bulutu", group = 'TOOLS [ZZ Algo]')
TrendFollower     = input(true, 'Trend Takip', group='TOOLS [ZZ Algo]')

Periods = sensitivity * 10
src = hl2
Multiplier = sensitivity / 2
changeATR = true
highlighting = false
atr2 = ta.sma(ta.tr, Periods)
atr = changeATR ? ta.atr(Periods) : atr2
up = src - Multiplier * atr
up1 = nz(up[1], up)
up := close[1] > up1 ? math.max(up, up1) : up
dn = src + Multiplier * atr
dn1 = nz(dn[1], dn)
dn := close[1] < dn1 ? math.min(dn, dn1) : dn
trend = 1
trend := nz(trend[1], trend)
trend := trend == -1 and close > dn1 ? 1 : trend == 1 and close < up1 ? -1 : trend
buySignal = trend == 1 and trend[1] == -1
plotshape(buySignal and showsignals ? up : na, title='Al', text='Al Sinyal', location=location.absolute, style=shape.labelup, size=size.normal, color=#00ff00, textcolor=color.new(color.black, 0))
sellSignal = trend == -1 and trend[1] == 1
plotshape(sellSignal and showsignals ? dn : na, title='Sat', text='Sat Sinyal', location=location.absolute, style=shape.labeldown, size=size.normal, color=#ff0000, textcolor=color.new(color.white, 0))

alertcondition(buySignal, title='ZZAlgo Buy', message='ZZAlgo Buy! Mesaji')
alertcondition(sellSignal, title='ZZAlgo Sell', message='ZZAlgo Sell! Mesaji')
changeCond = trend != trend[1]
alertcondition(changeCond, title='ZZ Algo Yon Degisimi!', message='ZZ Algo Yon Degisimi!')

// Candle Coloring
// Input
fastLength = 25
slowLength = 55
signalLength = 9

// Data reference
[macd, signal, hist] = ta.macd(src, fastLength, slowLength, signalLength)

// 4 level of green
greenHigh = 	color.rgb(0, 188, 212)
greenMidHigh = 	color.rgb(0, 188, 212)
greenMidLow = 	color.rgb(0, 188, 212)
greenLow = color.rgb(0, 188, 212)

// Yellow
yellowLow = color.rgb(0, 230, 118)

// 4 level of red
redHigh = color.rgb(156, 39, 176)
redMidHigh = color.rgb(156, 39, 176)
redMidLow = color.rgb(156, 39, 176)
redLow = color.rgb(156, 39, 176)

// Default color
candleBody = yellowLow

// Ranging trend
if hist > 0
    if hist > hist[1] and hist[1] > 0
        candleBody := greenLow

if hist < 0
    if hist < hist[1] and hist[1] < 0
        candleBody := redLow

// Bullish trend
if macd > 0 and hist > 0
    candleBody := greenMidLow

    if hist > hist[1] and macd[1] > 0 and hist[1] > 0
        candleBody := greenMidHigh

        if hist > hist[2] and macd[2] > 0 and hist[2] > 0
            candleBody := greenHigh

// Bearish trend
if macd < 0 and hist < 0
    candleBody := redMidLow

    if hist < hist[1] and macd[1] < 0 and hist[1] < 0
        candleBody := redMidHigh

        if hist < hist[2] and macd[2] < 0 and hist[2] < 0
            candleBody := redHigh

barcolor(candleBody) // Include suggestion by Shaheen204

// Smart Trail

// inputs //
//{

trailType = 'modified'
ATRPeriod = 13
ATRFactor = 4
smoothing = 8

norm_o = request.security(ticker.new(syminfo.prefix, syminfo.ticker), timeframe.period, open)
norm_h = request.security(ticker.new(syminfo.prefix, syminfo.ticker), timeframe.period, high)
norm_l = request.security(ticker.new(syminfo.prefix, syminfo.ticker), timeframe.period, low)
norm_c = request.security(ticker.new(syminfo.prefix, syminfo.ticker), timeframe.period, close)
//}

//////// FUNCTIONS //////////////
//{
// Wilders ma //
Wild_ma(_src, _malength) =>
    _wild = 0.0
    _wild := nz(_wild[1]) + (_src - nz(_wild[1])) / _malength
    _wild

/////////// TRUE RANGE CALCULATIONS /////////////////
HiLo = math.min(norm_h - norm_l, 1.5 * nz(ta.sma(norm_h - norm_l, ATRPeriod)))

HRef = norm_l <= norm_h[1] ? norm_h - norm_c[1] : norm_h - norm_c[1] - 0.5 * (norm_l - norm_h[1])

LRef = norm_h >= norm_l[1] ? norm_c[1] - norm_l : norm_c[1] - norm_l - 0.5 * (norm_l[1] - norm_h)

trueRange = trailType == 'modified' ? math.max(HiLo, HRef, LRef) : math.max(norm_h - norm_l, math.abs(norm_h - norm_c[1]), math.abs(norm_l - norm_c[1]))
//}


/////////// TRADE LOGIC ////////////////////////
//{
loss = ATRFactor * Wild_ma(trueRange, ATRPeriod)

Up = norm_c - loss
Dn = norm_c + loss

TrendUp = Up
TrendDown = Dn
Trend = 1

TrendUp := norm_c[1] > TrendUp[1] ? math.max(Up, TrendUp[1]) : Up
TrendDown := norm_c[1] < TrendDown[1] ? math.min(Dn, TrendDown[1]) : Dn

Trend := norm_c > TrendDown[1] ? 1 : norm_c < TrendUp[1] ? -1 : nz(Trend[1], 1)
trail = Trend == 1 ? TrendUp : TrendDown

ex = 0.0
ex := ta.crossover(Trend, 0) ? norm_h : ta.crossunder(Trend, 0) ? norm_l : Trend == 1 ? math.max(ex[1], norm_h) : Trend == -1 ? math.min(ex[1], norm_l) : ex[1]
//}

// //////// PLOT TP and SL /////////////

////// FIBONACCI LEVELS ///////////
//{
state = Trend == 1 ? 'long' : 'short'

fib1Level = 61.8
fib2Level = 78.6
fib3Level = 88.6

f1 = ex + (trail - ex) * fib1Level / 100
f2 = ex + (trail - ex) * fib2Level / 100
f3 = ex + (trail - ex) * fib3Level / 100
l100 = trail + 0

fill(plot(ShowSmartTrail ? (ta.sma(trail, smoothing)) : na, 'Trailingstop', style=plot.style_line, color=Trend == 1 ? color.new(#14ff34, 0) : Trend == -1 ? color.new(#ff0015, 0) : na),
 plot( ShowSmartTrail ? (ta.sma(f2, smoothing)) : na, 'Fib 2', style=plot.style_line, display=display.none),
 color=state == 'long' ?  color.rgb(224, 64, 251): state == 'short' ? color.rgb(255, 152, 0): na)
//}
How to Apply Pine Script in TradingView:
- Open TradingView and log in.
- Navigate to the Pine Script Editor at the bottom of the screen.
- Copy the provided Pine Script code.
- Paste it into the editor and click Save.
- Name the script, e.g., “ZZ Algo MR V3.”
- Click Add to Chart to apply the script.
- Customize settings to fit your trading style via the indicator panel.
Final Verdict:
The ZZ Algo MR V3 script delivers a well-rounded trading strategy with a focus on trend analysis, risk management, and flexibility. Its non-repainting nature ensures reliable outputs, while its robust features make it suitable for professional and active traders. However, new users may need time to adapt to its extensive settings and configurations. Streamlining certain processes could further improve its efficiency and usability.
RELATED POSTS
View all
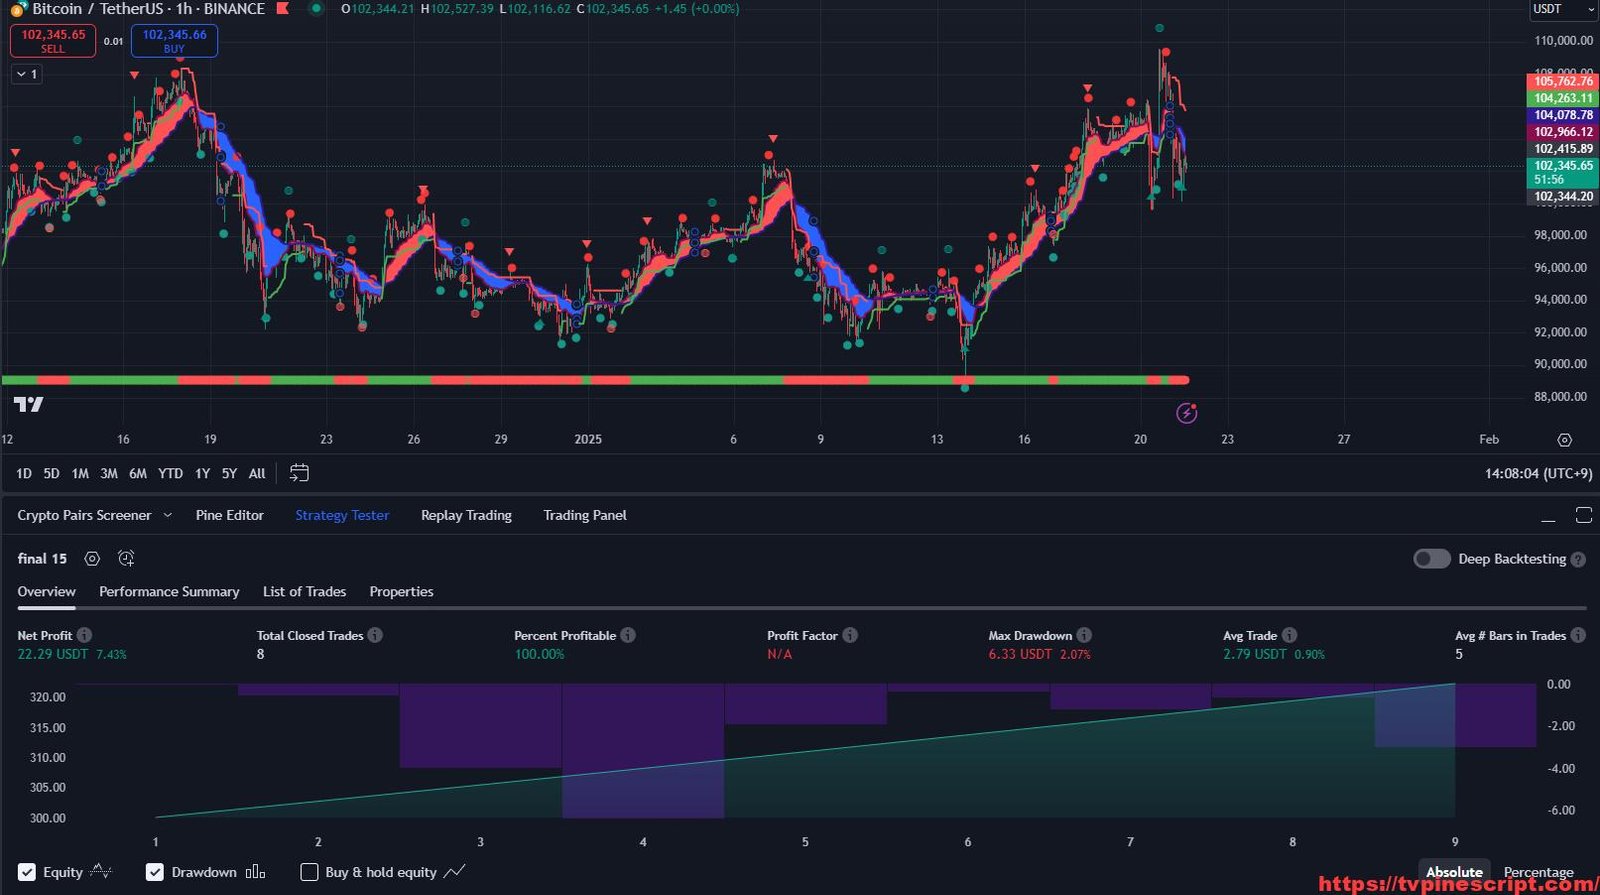
Final 15 Strategy: A Comprehensive Trading System Combining Adaptive Indicators
January 21, 2025 | by admin
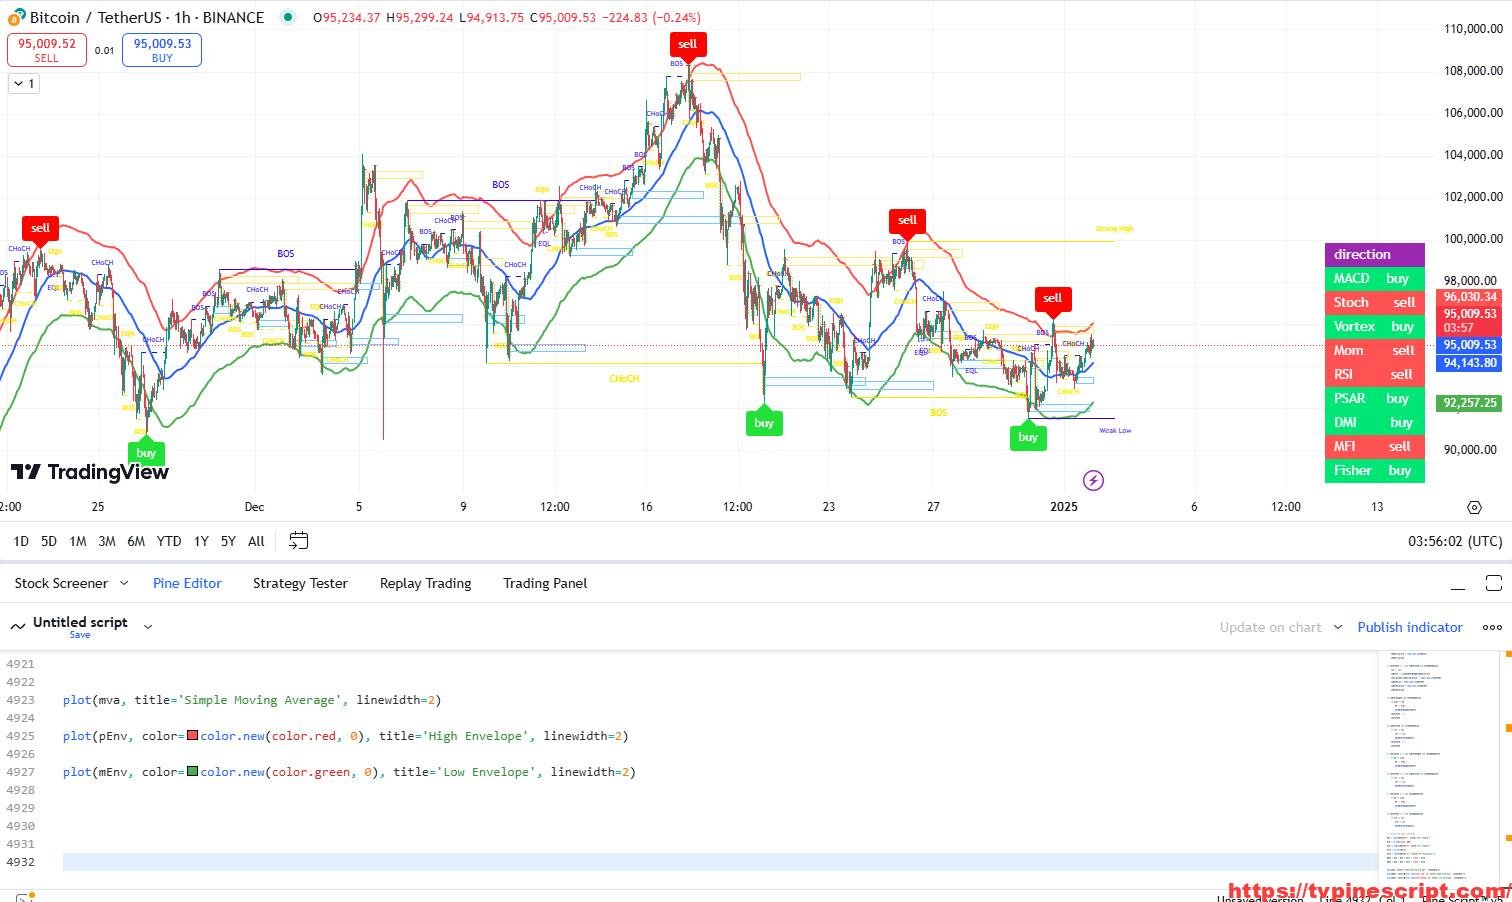
The REAL-GAINS Algo: A Comprehensive Range Filter Strategy for Precise Market Entries
January 24, 2025 | by admin
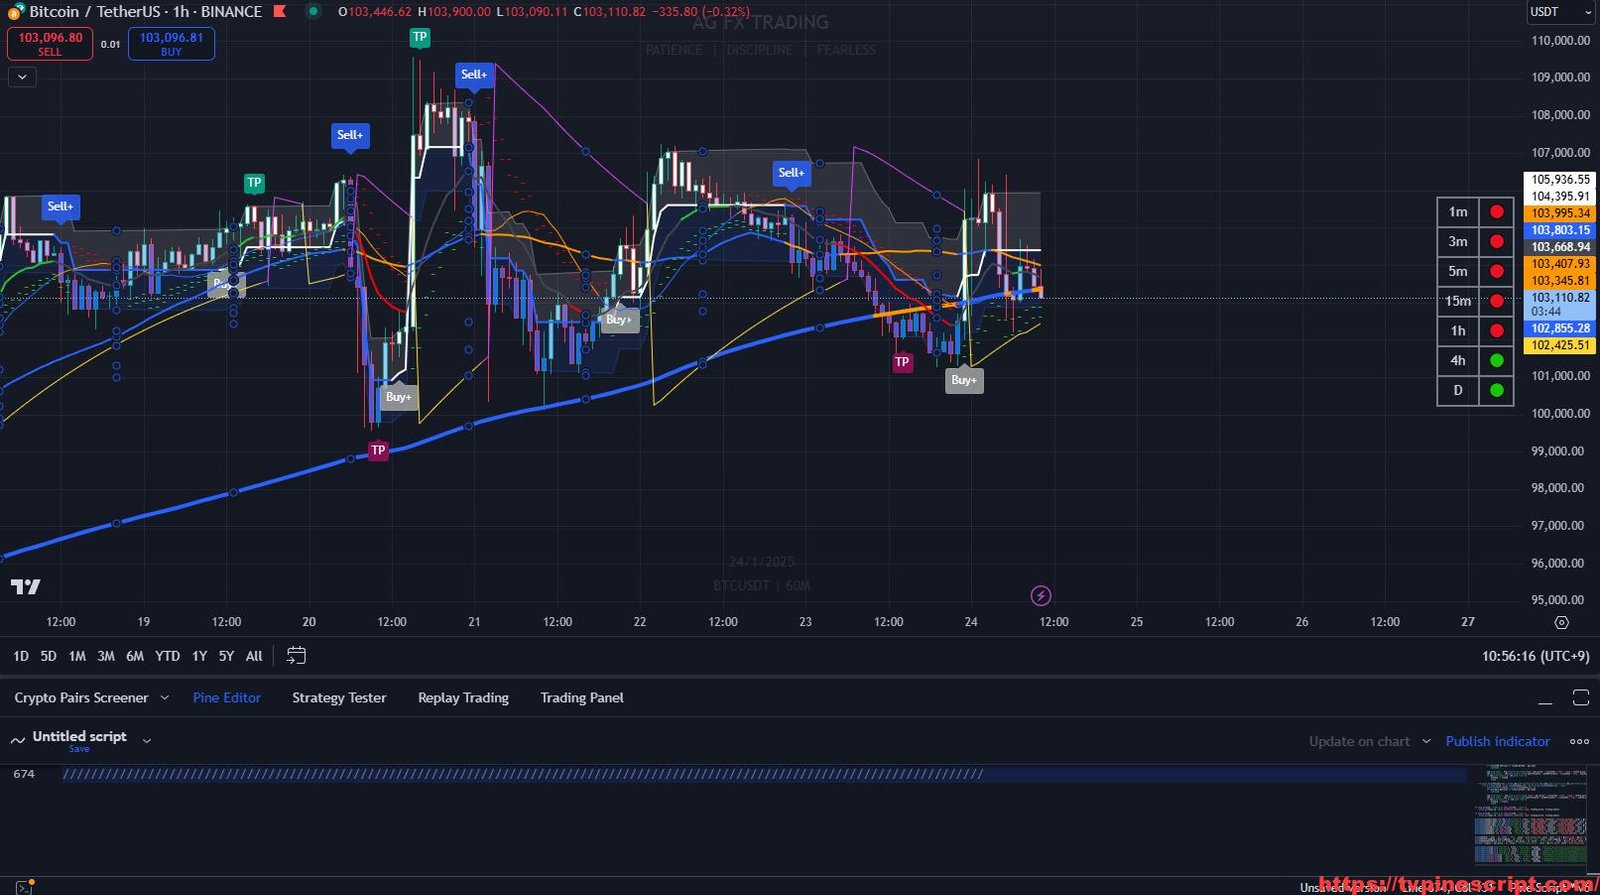
Scalping and Market Structure Analysis with Advanced Pine Script Indicators
January 3, 2025 | by admin